

Abstract
The present research aimed to improve the dissolution rate and bioavailability of curcumin using the potential of liquisolid technology. Twelve drug-loaded liquisolid systems (LS-1 to LS-12) were prepared using different vehicles (PEG 200, PEG 400 and Tween 80) and curcumin concentrations in vehicle (40%, 50%, 60% and 70%, w/w). The carrier [microcrystalline cellulose (MCC) PH102] to coat (Aerosil®) ratio was 20 in all formulations. The systems were screened for pre-compression properties before being compressed to liquisolid tablets (LT-1 to LT-12). Post compression tests and in vitro dissolution of LTs were conducted and the results compared with those obtained for a directly compressed tablet (DCT) made of curcumin, MCC PH102 and Aerosil®. LTs exhibited higher cumulative drug release (CDR) than the DCT and the optimum formulation, LT-9 (made using Tween 80), was studied by powder XRD, DSC, SEM and FTIR. Ex-vivo permeation of curcumin from LT-9 through goat gastrointestinal mucosa was significantly (P<0.05) enhanced and its oral bioavailability was increased 18.6-fold in New Zealand rabbits. In vitro cytotoxicity (IC50) of LT-9 towards NCL 87 cancer cells was 40.2 µmol/L substantiating its anticancer efficacy. Accelerated stability studies revealed insignificant effects of temperature and humidity on LT-9. In summary, solubility enhancement of curcumin in LTs produced significant improvements in its permeation and bioavailability.
KEY WORDS: Liquisolid tablet, Powder solution technology, Curcumin, Hydrogen bond formation, Cytotoxicity, Gastric permeation, Bioavailability, Pharmacokinetics
Graphical abstract
A liquisolid tablet of curcumin was prepared by compression of a liquisolid system made by solubilizing curcumin in a non-volatile solvent followed by adsorption/absorption on MCC PH102 (carrier) and coating with Aerosil®(coating material). Increased solubility/release characteristics of curcumin through formulation in a liquisolid tablet resulted in enhanced bioavailability in New Zealand rabbits as compared to a conventional directly compressed tablet of curcumin.

1. Introduction
Despite exerting a range of therapeutic effects, curcumin possesses limited commercial viability due to its poor water solubility and relatively low bioavailability1. Numerous approaches have been utilized to overcome these limitations, including reformulation of curcumin with various oils2, the use of piperine to inhibit its metabolism3 and the development of vesicular carriers4 and nanoparticles of curcumin5. Conjugation of curcumin prodrugs and linkage of curcumin to polyethylene glycol have also been reported as fruitful approaches. Development of natural and synthetic curcumin analogs has also been investigated and shown promising results6.
In spite of its efficacy and safety, curcumin remains to be approved as a therapeutic agent mainly because of its low bioavailability7. The reasons for this low bioavailability include poor absorption, limited tissue distribution and rapid metabolism8, 9, 10. Although curcumin has been reported to be more permeable under acidic conditions, its permeability cannot be improved by specific P-glycoprotein (P-gp) or multi-drug resistance protein (MRP) inhibitors. However, it can be significantly increased through the use of a curcumin delivery system which reversibly compromises mucus integrity. Nevertheless, despite intensive research, curcumin has not fulfilled its pharmacological promise in clinical trials due to its poor water solubility and extremely low bioavailability11.
Among various techniques used to improve the dissolution of poorly soluble drugs, the application of powder solution or liquisolid technology is one of the most promising techniques. This is because it is simple, cost effective and commercially attractive for industrial production. Given that the technique has never been applied to curcumin, the present research focused on developing liquisolid tablets of curcumin and assessing their dissolution characteristics, ability to improve the permeation of curcumin through the gastrointestinal tract and bioavailability.
2. Materials and methods
2.1. Materials
Curcumin (Lot. No. PC/CL/10LOT/09) was kindly supplied by Natural Remedies Pvt. Ltd. (Bangalore, India). Di-sodium hydrogen phosphate, concentrated hydrochloric acid and microcrystalline cellulose MCC PH101 and PH102 were purchased from S.D. Fine Chemical Ltd. (Mumbai, India). Polyethylene glycol 200 (PEG 200) and 400 (PEG 400), glycerol, Tween 80, propylene glycol and Aerosil® were procured from S. Merck (India) Ltd. HPLC grade methanol and water were purchased from Sigma– Aldrich Ltd., USA. All other reagents were of analytical grade and used as received.
2.2. Saturation solubility
Saturation solubility of curcumin was determined by the shake flask method12. An excess of curcumin was added to 25 mL, 0.1 mol/L HCl, pH 1.2 and 25 mL double distilled water and shaken for 72 h in a thermostatted water bath (HICON®, Grover Enterprises, New Delhi, India) at 25±2 °C. The resulting suspensions of curcumin were filtered through Whatman #1 filter paper and the filtrates centrifuged (Remi Centrifuge, Remi Instruments Ltd., Vasai, India) at 3000 rpm for 15 min. The supernatants were suitably diluted and analyzed spectrophotometrically (Shimadzu-1700, Tokyo, Japan) at 424 nm. The solubilities of curcumin in the non-volatile solvents glycerin, propylene glycol, PEG 200, PEG 400 and Tween 80 were determined in the same way.
2.3. Mathematical design and development of liquisolid systems
In the development of a liquisolid system (LS), the relative amounts of carrier and coating material that impart acceptable flow properties and compression characteristics need to be determined. Knowing the flowable liquid retention potentials of the carrier (ΦCA) and coat (ΦCO) and the ratio (R) of the amount of carrier (Q) to coating material (q), the maximum amount of liquid that can be loaded on a carrier material, i.e. the liquid load factor (FL), can be calculated using the mathematical model suggested by Spireas and Bolton13 (Eq. (1)):
| (1) |
Then, based on the drug concentration in the liquid medication, the weight of drug solution (liquid medication) (W) can be calculated and used to determine the weight of the carrier (Q) (Eq. (2)):
| (2) |
Finally, since
| (3) |
the weight of coating (q) can be calculated. As previously suggested, an R value of 20 was used in this study to provide admixtures with appropriate properties14, 15, 16, 17.
2.4. Flowable retention potential (Φ)
The Φ values were determined by first determining the angle of slide (θ). Solvent-powder admixtures with increasing quantities of non-volatile solvents were prepared and placed individually on one end of a polished metal plate. This was then gradually uplifted until the plate makes an angle with the horizontal at which the admixture is just about to slide. Thereafter, Φ values are calculated (Eq. (4))
| (4) |
and plotted against the corresponding θ values. The Φ value corresponding to θ=33° is regarded as the Φ value of the admixture18. The Φ values were used to formulate the drug loaded LS.
2.5. Interaction studies
Physical mixtures of curcumin with MCC PH102 and Aerosil® were placed in sealed vials and stored for 2 weeks at a temperature of 55±2 °C under 5% moisture19. At the end of the storage period, samples were collected, mixed with dry KBr powder in a ratio of 1:9 and subjected to diffuse reflectance spectroscopy (DRS, Shimadzu FTIR-8400, Kyoto, Japan) against a background of KBr using a scanning range of 500–4000 cm−1 and 1 cm−1 resolution. The spectra of mixtures were compared with those of curcumin, MCC PH102 and Aerosil® to detect possible interactions.
2.6. Formulation of liquisolid systems
A total of 12 liquisolid systems (LS-1–LS-12) were formulated using one non-volatile solvent per group of 4 systems [Group I, LS-1 to 4, PEG 200; Group II, LS-5 to 8, PEG 400; Group III, LS-9 to 12, Tween 80]. MCC PH102 was used as carrier and Aerosil® as coating material in a ratio (R) of 20:1. The Φ values for carrier and coating were determined and used to calculate FL which, with the value of W, was used to calculate the values of Q and q (Table 1).
Table 1.
Formulation details of liquisolid systems (LS-1 – LS-12), liquisolid tablets and directly compressed tablets (DCTs) of curcumin.
| Group No. | Formulation code | Drug (%, w/w) | Ratio, Q/q | Non-volatile solvent, W (mg)a | Liquid load factor, FL | Carrier material, Q | Coating material, q | Weight of tablet (g) | Molecular fraction |
|---|---|---|---|---|---|---|---|---|---|
| Group-I | LS-1 | 40 | 20:1 | 150.0 | 0.27 | 538.5 | 26.92 | 0.815 | 1.353 |
| LS-2 | 50 | 20:1 | 100.0 | 0.27 | 359.1 | 17.95 | 0.577 | 1.082 | |
| LS-3 | 60 | 20:1 | 67.75 | 0.27 | 239.5 | 11.97 | 0.418 | 0.902 | |
| LS-4 | 70 | 20:1 | 42.85 | 0.27 | 153.9 | 7.69 | 0.304 | 0.773 | |
| Group-II | LS-5 | 40 | 20:1 | 150.0 | 0.28 | 535.7 | 26.78 | 0.812 | 0.992 |
| LS-6 | 50 | 20:1 | 100.0 | 0.28 | 357.1 | 17.85 | 0.575 | 0.793 | |
| LS-7 | 60 | 20:1 | 67.75 | 0.28 | 238.2 | 11.91 | 0.416 | 0.661 | |
| LS-8 | 70 | 20:1 | 42.85 | 0.28 | 153.0 | 7.65 | 0.303 | 0.566 | |
| Group-III | LS-9 | 40 | 20:1 | 150.0 | 0.35 | 425.5 | 26.78 | 0.812 | 0.841 |
| LS-10 | 50 | 20:1 | 100.0 | 0.35 | 283.7 | 17.85 | 0.498 | 0.672 | |
| LS-11 | 60 | 20:1 | 67.75 | 0.35 | 189.2 | 11.91 | 0.435 | 0.560 | |
| LS-12 | 70 | 20:1 | 42.85 | 0.35 | 121.6 | 7.65 | 0.270 | 0.480 | |
| DCT | 100 mg | 20:1 | – | – | 100 | 5 | 0.205 | – | |
Nonvolatile solvent used: PEG 200 (Group-I; LS-1–LS-4), PEG 400 (Group-II; LS-5–LS-8), and Tween 80 (Group-III; LS-9–LS-12).
In the primary stage of formulation, MCC PH102 was mixed with the liquid medication and blended for 2 min in a glass pestle and mortar to give an even distribution of liquid medication in MCC PH102. In the secondary stage, the liquid–powder admixture was spread as a uniform layer on the surface of the mortar and left for 5 min to allow sufficient adsorption of drug solution to the surface of the carrier particles. The damp liquid–powder mixture was converted into a dry and free flowing powder by the gradual addition of the coating material with continuous blending.
2.7. Pre-compression evaluation
LS-1–LS-12 were evaluated for pre-compression properties; bulk density, tapped density, compressibility index, angle of repose, percent cohesivity, Hausner׳s ratio, percent porosity20, 21 and dispersibility. Cohesivity was determined by placing a weighed amount of LS on a watch glass and leaving for 15 min to allow it to adhere. The watch glass was then tilted at an angle of 90° and the amount retained on the watch glass recorded as cohesivity. Dispersibility (%) was determined using the method of Gupta et al. (Eq. (5))22:
| (5) |
2.8. Preparation of liquisolid tablets
LS were compressed using a hand-operated single punch tablet press (Jindal Scientific Industries, Ahmedabad, India) to give a total of 12 liquisolid tablets (LT-1–LT-12). A batch of directly compressed tablets (DCTs) was also prepared by direct compression of a blend of curcumin, MCC PH102 and Aerosil® (Table 1).
2.9. Tablet characteristics
Tablet hardness and friability were determined in triplicate using a Monsanto hardness tester and Roche′s Friabilator (both from HICON®, Grover Enterprises, New Delhi, India). To determine uniformity of weight (mean±standard deviation), 20 tablets were randomly selected and weighed individually. To determine drug content, ten tablets from each batch were powdered and extracted with methanol by vortexing for 10 min. The resulting extracts were filtered through Whatman #1 filter paper and the filtrates analyzed spectrophotometrically. Disintegration time was determined as detailed in the USP-27/NF 2223.
In vitro dissolution was performed using a USP dissolution apparatus II. The dissolution medium was 900 mL 0.1 mol/L HCl, pH 1.2 maintained at 37±0.5 °C and stirred at 100 rpm. Aliquots (5 mL) were withdrawn initially and after 5, 10, 20, 30, 40 and 60 min and replaced with fresh dissolution medium. Samples were analyzed spectrophotometrically and plots of percent cumulative drug release (CDR) versus time compared with the dissolution profile of the DCT of curcumin. Formulations giving high rates of CDR were selected to undergo powder X-ray diffraction (XRD).
2.10. Powder XRD
Powder XRD of curcumin, MCC PH102, Aerosil® and LS-1, 5 and 9 was performed using an X-ray diffractometer (Bruker AXS D8 Advance®, Germany). The samples were irradiated by a Nickel filtered 2.2 Cu-Kα anode, Dermic X-ray tube equipped with a sample holder with zero background and PMMA & Linux eye detector. The samples were scanned over a 2θ range of 5–80°. Peak intensities were recorded and the crystallinity index (CI) calculated using Eq. (6):
| (6) |
where I002 is the intensity at 21.5° and IAM is the lowest intensity at 2θ near 18°.
2.11. Differential scanning calorimetry (DSC)
DSC thermograms of curcumin, MCC PH102, Aerosil® and LS-9 were obtained using a DSC-60 instrument equipped with an intra-cooler and controlled by TA-60 WS software (Shimadzu, Kyoto, Japan). Samples were weighed, transferred to hermetically sealed aluminum pans and heated at a rate of 10 °C/min over a range of 0–300 °C. An indium standard was used to calibrate the instrument and enthalpy scale. An inert atmosphere was maintained by purging nitrogen at a rate of 10 mL/min.
2.12. Scanning electron microscopy (SEM)
SEM was performed in order to assess the morphological characteristics of curcumin, MCC PH102, Aerosil® and LS-9. The sample was mounted on the sample holder with the help of double sided sticking tape and coated with the layer of gold for 5–6 min. SEM images were recorded at different magnifications at an acceleration voltage of 15 kV on a scanning electron microscope (JEOL 5400, Kyoto, Japan).
2.13. Fourier transform infrared spectroscopy (FTIR)
Samples of curcumin, Tween 80, MCC PH102 and Aerosil® were prepared according to the mathematical model applied to formulate LS-9, mixed with dry KBr powder in a ratio of 1:9 and examined by FTIR (Shimadzu FTIR-8400, Kyoto, Japan) using KBR as background. The scanning range was 4000–400 cm−1 with 1 cm−1 resolution. The spectra of liquid powder mixtures were compared with those of curcumin to detect any interactions.
2.14. Ex-vivo gastric permeation
Fresh abomasum from goat stomach was obtained from a local butcher shop and mucosa prepared by separation of connective tissue using a scalpel. The prepared sample was mounted over the receptor compartment of a Franz diffusion cell (internal diameter 2.03 cm) with the dorsal surface facing the donor compartment. A portion of crushed LT-9 containing 100 mg curcumin was dispersed in 0.1 mol/L HCl, pH 1.2 and placed in the donor compartment. The receptor compartment was filled with 0.1 mol/L HCl, pH 1.2 and maintained at 37±0.5 °C. Aliquots (1 mL) were withdrawn from the receptor compartment initially and after 5, 10, 15, 20, 30, 40, 60, 100 and 120 min and replaced with equal volumes of fresh medium. The study was performed in triplicate. The cumulative amount of drug permeating across the mucosal membrane (cumulative drug release, CDR) was plotted against time and compared with the CDR (%) profile of LT-9.
2.15. In vitro cytotoxicity
The cytotoxicity of curcumin and LT-9 to NCL-87 cancer cells was determined using paclitaxel as control. Aliquots of cell suspension (5000 cells/100 μL) were seeded into 96-well plates, incubated for 24 h and then treated with 150 μL curcumin solution or the equivalent amount of LT-9 for a further 4 h at 37 °C. Finally the absorbance of each well was determined at 424 nm using a microplate reader (CLARIOstar® High Performance Microplate Reader, BMG Labtech, Offenburg, Germany) with 344 nm as reference wavelength24. Cell growth inhibition (%) was calculated using the following equation:
| (7) |
where WT denotes the mean number of cancer cells of the treated group and WC the mean number of cancer cells of the control group. Data are presented as growth inhibition profiles (growth inhibition as a function of concentration) and IC50 values.
2.16. Pharmacokinetic study
2.16.1. Protocol
The pharmacokinetic study was performed after obtaining approval from the Institutional Animal Ethics Committee of the Rajiv Academy for Pharmacy, Mathura, INDIA (IAEC No: IAEC/RAP/03966). All animal experiments were conducted in full compliance with ethical and regulatory principles and following the guidelines of the Association for Assessment and Accreditation of Laboratory Animal Care. A group of New Zealand rabbits (n=8, weight 2–3.5 kg) were divided into two equal groups designated test (group I) and control (group II). The animals were fasted overnight prior to drug administration and for a further 4 h thereafter. Animals received a single oral dose of either LT-9 (group I) or DCT (group II) containing 50 mg of curcumin with 5 mL water. Blood samples (1 mL) were collected using a 3 mL syringe (Dispo Van, HMD, Faridabad, Haryana, India) from the marginal ear vein before the dose and at 0.5, 1, 1.5, 2, 4, 6, 8 and 10 h after the dose. Blood samples were transferred into 5 mL heparinized plastic plasma tubes (13 mm×7.5 mm spray-coated with 150 USP Units of sodium heparin and with BD hemoguard closures) (BD & Co., NJ, USA) and plasma separated by centrifugation at 3500 rpm for 15 min at 8 °C. Plasma samples were transferred into microcentrifuge tubes and stored at –20 °C pending analysis.
2.16.2. Curcumin assay
Curcumin plasma concentration was determined using a validated HPLC assay as reported by Heath et al.25. Chromatography was performed by isocratic elution on a C18 reversed phase column (150 mm×3.9 mm, 5 μm, Pierce Chemical Compound, Rockford, USA) attached to a model LC-CHT 2010 HPLC system (Shimadzu, Japan) equipped with an automatic injector (SIL 10A) and UV detector set at 424 nm. The mobile phase consisted of acetonitrile:water:methanol:acetic acid (41:36:23:1, v/v/v/v) delivered at 20 μL/min. The injection volume was 20 μL. A standard solution of curcumin (100 μg/mL) was prepared by diluting a stock solution (5 mg in 25 mL methanol) with mobile phase. Calibration standards of curcumin (0.01, 0.05, 0.1, 0.5, 1.0, 2.5, 5.0 and 10 µg/mL) were prepared by spiking 100 µL aliquots of blank rabbit plasma with the standard solution. A working solution of internal standard (4-hydroxybenzophenone) was prepared by dissolving 5 mg in 1.0 mL methanol and diluting to 25 mL with mobile phase.
2.16.3. Pharmacokinetic analysis
The maximum plasma concentration (Cmax) and time to reach it (Tmax) were determined directly from the plasma concentration–time profiles. The area under the plasma concentration–time curve (AUC) was estimated using the linear trapezoidal method. The elimination rate constant (ke) and absorption rate constant (ka) were obtained by linear regression of the log-transformed concentration–time data of the elimination and absorption phases, respectively. The absorption half-life (ta1/2) and elimination half-life (t1/2) were calculated as 0.693/ka and 0.693/ke, respectively. The unpaired Student׳s t-test was used to determine differences between calculated parameters. Differences yielding P<0.05 were considered statistically significant.
2.17. Stability
Accelerated stability testing of LS-9 and LT-9 at 40±2 °C and 75±5% relative humidity for 3 months was performed in accordance with ICH Q1A(R2) guidelines. After storage, samples of LS-9 were evaluated for solid state reversion by determination of the crystallization index (CI) using powder XRD. Samples of LT-9 were subjected to in vitro dissolution testing where the dissolution data of stored samples were compared with those of fresh LT-9 samples in terms of the similarity (f2) and difference factor (f1).
3. Results and discussion
3.1. Solubility enhancement
The solubility of curcumin was found to be 0.002±0.001 mg/mL in 0.1 mol/L HCl, pH 1.2 and 0.003±0.001 mg/mL in double distilled water. This indicates poor solubility of curcumin in both media in agreement with results reported by other researchers5, 26. Results of this study show application of liquisolid technology can enhance the solubility of curcumin. This is because the non-volatile solvents evaluated in the study (glycerine, propylene glycol, PEG 200, PEG 400 and Tween 80) contain polyhydric alcohols capable of forming hydrogen bonds with the hydroxyl groups (–OH) and hydrogen (–H) atoms in curcumin. Solubility of curcumin in glycerin (0.800±0.005 mg/mL) and propylene glycol (1.600±0.021 mg/mL) was still relatively low but was greatly increased in Tween 80 (13.53±0.42 mg/mL) PEG 400 (9.92±0.24 mg/mL) and PEG 200 (8.41±0.22 mg/mL). The order of solubility enhancement was: glycerin<propylene glycol<PEG 200<PEG 400<Tween 80.
The fact that the formulation with Tween 80 exhibited the highest solubility is presumably because polyoxyethylene sorbitan monooleate contains more –OH groups27 than the other non-volatile solvents and can form more hydrogen bonds with curcumin. This was confirmed by FTIR spectroscopy. The fact that formulations with glycerin and propylene glycol displayed poor solubility enhancement despite having large numbers of –OH groups is attributable to their viscous character that impedes the solubilization process. On the basis of the order of solubility enhancement, formulations made using PEG 200, PEG 400, and Tween 80 were selected for further studies.
3.2. Selection of excipients
In order to develop an effective liquisolid formulation, the selection of carrier and coating material is crucial. The criteria for selection of the carrier material include good porosity (ability to adsorb/absorb a large amount of liquid medication), hygroscopicity (ability to solubilize the drug), flow properties (while retaining the liquid medication) and compactability (to provide physical strength to the final formulation)28. Similarly, the selection of coating material must be based on its ability to cover the wet carrier particles uniformly and produce a dry-looking powder with free flowing properties through adsorbing any excess liquid29.
To facilitate selection of carrier and coating materials, the Φ values of MCC PH101 and PH102 were estimated using the three non-volatile solvents. MCC PH102 was found to exhibit a higher Φ value than MCC PH101 (data not shown) consistent with its higher specific surface area (SSA) of 1.10 m2/g compared to 1.07 m2/g for MCC PH10130. In addition, MCC PH102 is more porous than MCC PH101 enabling it to adsorb a larger amount of liquid31, 32. For these reasons, MCC PH102 was selected as the carrier material in further studies. Simultaneously, Aerosil® was selected as coating material as it was found to possess all the properties recommended for an efficient coating material.
3.3. Application of mathematical design and formulation development
The angle of slide was used to determine the Φ values required for the calculation of FL. Spireas et al.30 claimed that the angle of slide is the preferred method to determine the flowability of powders with particle size <150 μm such as MCC PH102 and Aerosil®. Fig. 1 (A and B) depicts the relationship between the angle of slide and the corresponding Φ values of MCC PH102 and Aerosil®, respectively. As reported in Table 1, LS with lower drug concentrations contains relatively more liquid vehicle and require more carrier material to be adsorbed/absorbed and consequently more coating material to cover the larger surface area in order to produce a dry free flowing powder. Such LS requires larger tablets than those containing higher drug concentrations (Table 1).
Figure 1.

Plots showing relationship between the angle of slide (θ) and corresponding Φ values of (A) MCC PH102 and (B) Aerosil®.
The FL value is the maximum amount of liquid that can be retained by LS to maintain its flowability and compactability. FL values calculated using Eq. (1)28 are reported in Table 1. In addition, the physicochemical characteristics of the non-volatile solvent such as its polarity, viscosity and lipophilicity may also affect the FL value29. FL values for PEG 200, PEG 400 and Tween 80 were found to be 0.27, 0.28 and 0.35, respectively. According to Eq. (2), FL is inversely proportional to the amount of carrier such that smaller tablets can be achieved if the FL value is high. Utilizing the FL value, the amounts of carrier and coating material determined by the value of R were calculated. The higher the R value, the greater the amount of carrier material and the larger the weight of tablet produced.
3.4. Interaction studies
Interactions between curcumin and MCC PH102 and curcumin and Aerosil® were examined using DRS. The spectrum of curcumin revealed the presence of both the enolic form (a peak at 3508 cm–1) and ketonic form (the two carbonyl peaks in the range 1730–1659 cm–1). Furthermore, the C=C stretching vibration at 1601 cm–1and the peak at 1274 cm–1 revealed the presence of the aromatic alkene group and asymmetric ether group (C–O–C), respectively (Fig. 2). All these peaks were present in the DRS spectrum of a binary mixture containing curcumin and MCC PH102 although some of them were overlapping. However, the intensity of the stretching vibration at 3508 cm–1 was less than in the spectrum of curcumin possibly due to hydrogen bonding between curcumin and MCC PH10233. In the case of the DRS of the binary mixture of curcumin and Aerosil®, peak broadening was evident in the –OH stretching vibration at 3508 cm–1 and in the region 1700–1500 cm–1. This again suggests an interaction involving hydrogen bonding between curcumin and the excipient34. Thus DRS studies indicate the presence of interactions between curcumin and excipients which are highly desirable in the development of successful LS of curcumin with increased hydrophilic characteristics.
Figure 2.
Diffuse reflectance spectra of curcumin, MCC PH102, Aerosil® and their respective binary mixtures for estimation of compatibility of drug and excipients used.
3.5. Formulation of LS
Determination of Ф values, FL and the quantities of carrier and coating material based on R=20 were sequential steps in the development of LS. Spireas et al.15 reported that release of methyclothiazide from a liquisolid compact was improved by increasing the powder excipients R value from 5 to 20 but that no further improvement occurred even if R was increased to 70. Similar findings have been reported by numerous other researchers14, 16, 17. Hence, in this study an R value of 20 was selected. In addition, the total weight of each individual LS was designed to incorporate 100 mg curcumin (Table 1).
3.6. Pre-compression evaluation of LS
The bulk density (w/v) of the LS was found to be in the range 0.32±0.20 to 0.56±0.76 (Table 2) whereas the tapped density was in the range 0.44±0.70 to 0.73±0.38. In terms of cohesiveness, ISO Standard 3435 indicates how the angle of repose is a measure of the cohesiveness of a granular material35. As a characteristic of the internal friction or cohesion of particles, the angle of repose is high for a cohesive powder and low for a non-cohesive one. For all formulations except LS-4, LS-5 and LS-12, the angle of repose was in the range 22–25° which reflects excellent flow properties. The three exceptions possessed reasonable flow properties that could be improved by including a glidant. Hausner׳s ratio and Carr׳s index of the LS confirmed good flow properties as all values of the latter were <25% and of the former <1.2536. As regards dispersibility which assesses the ability of a powder to flow or pour easily over a plane, the high values of dispersibility of LS (86.47±0.83 to 93.25±0.47) assured the ability of the LS to flow.
Table 2.
Pre-compression evaluation of liquisolid systems (LS-1–LS-12).
| Formulation | Bulk density (w/v) | Tapped density (w/v) | Carr׳s index | Hausner׳s ratio | Angle of repose (°) | Porosity (%) | Cohesive index | Dispersibility (%) |
|---|---|---|---|---|---|---|---|---|
| LS-1 | 0.324±0.20 | 0.452±0.55 | 11.65±0.12 | 1.13±0.38 | 22±0.12 | 24.76 | 1.5±0.5 | 91.87±0.67 |
| LS-2 | 0.545±0.34 | 0.731±0.38 | 21.44±0.22 | 1.24±0.44 | 23±0.32 | 24.20 | 1.7±0.2 | 90.35±0.85 |
| LS-3 | 0.545±0.43 | 0.697±0.44 | 22.80±0.31 | 1.23±0.47 | 25±0.15 | 22.48 | 1.8±0.4 | 88.45±0.43 |
| LS-4 | 0.555±0.76 | 0.714±0.25 | 22.26±0.29 | 1.24±0.58 | 31±0.54 | 22.22 | 2.1±0.4 | 87.87±0.25 |
| LS-5 | 0.357±0.19 | 0.500±0.71 | 23.60±0.32 | 1.20±0.61 | 24±0.54 | 28.57 | 1.3±0.2 | 93.25±0.47 |
| LS-6 | 0.348±0.23 | 0.454±0.40 | 23.34±0.56 | 1.22±0.40 | 24±0.34 | 25.52 | 1.4±0.4 | 90.85±0.15 |
| LS-7 | 0.328±0.83 | 0.468±0.27 | 24.64±0.19 | 1.24±0.55 | 25±0.17 | 23.32 | 1.7±0.5 | 90.17±0.37 |
| LS-8 | 0.375±0.32 | 0.445±0.22 | 19.87±0.70 | 1.24±0.49 | 32±0.24 | 22.43 | 1.9±0.2 | 88.43±0.45 |
| LS-9 | 0.340±0.37 | 0.444±0.25 | 21.36±0.33 | 1.21±0.28 | 23±0.24 | 23.40 | 1.4±0.4 | 91.25±0.27 |
| LS-10 | 0.342±0.37 | 0.441±0.70 | 21.08±0.39 | 1.20±0.72 | 23±0.14 | 23.13 | 1.5±0.2 | 91.05±0.55 |
| LS-11 | 0.358±0.33 | 0.465±0.82 | 22.90±0.24 | 1.23±0.28 | 24±0.19 | 22.99 | 1.8±0.5 | 89.25±0.20 |
| LS-12 | 0.375±0.37 | 0.473±0.78 | 23.11±0.27 | 1.23±0.59 | 31±0.46 | 22.39 | 2.0±0.4 | 86.47±0.83 |
3.7. Post compression parameters of LTs
Generally, a tablet that provides rapid disintegration and drug dissolution can be produced without applying excessive compression force37. In this study, sufficient compression force was applied to produce LTs that did not break during normal handling and transport but disintegrated and released active drug when required. Hardness of LTs was in the range 3.0±0.2 to 3.8±0.4 kg/cm2 indicating sufficient strength. At the same time, all LTs passed the friability test with none showing friability >1% by weight (Table 3). The LTs also passed the weight variation test23 and drug content revealed uniformity ranging from 95.2±2.2% to 98.2±1.4%.
Table 3.
Post-compression studies of liquisolid tablets (LT-1–LT-12).
| Formulation | Hardness (kg/cm2) | Friability (%) | Weight variation (mg) | Drug content (%) | Disintegration time (min) |
|---|---|---|---|---|---|
| LT-1 | 3.8±0.4 | 0.78 | 800±10 | 96.58±2.65 | 3.5±0.3 |
| LT-2 | 3.2±0.6 | 0.72 | 590±12 | 95.87±3.26 | 3.7±0.5 |
| LT-3 | 3.2±0.4 | 0.64 | 430±15 | 95.24±2.43 | 4.5±0.6 |
| LT-4 | 3.0±0.2 | 0.56 | 315±10 | 96.07±2.59 | 5.2±0.2 |
| LT-5 | 3.2±0.6 | 0.22 | 810±10 | 97.18±2.58 | 4.0±0.3 |
| LT-6 | 3.4±0.4 | 0.18 | 580±15 | 95.18±2.18 | 4.2±0.5 |
| LT-7 | 3.6±0.8 | 0.10 | 415±10 | 96.02±2.43 | 5.3±0.2 |
| LT-8 | 3.4±0.6 | 0.07 | 300±05 | 95.16±2.22 | 5.5±0.4 |
| LT-9 | 3.2±0.8 | 0.42 | 800±10 | 96.02±1.56 | 4.5±0.3 |
| LT-10 | 3.6±0.2 | 0.38 | 500±10 | 96.19±2.18 | 4.7±0.8 |
| LT-11 | 3.0±0.6 | 0.37 | 450±05 | 97.43±2.56 | 5.2±0.7 |
| LT-12 | 3.2±0.4 | 0.34 | 270±10 | 98.18±1.43 | 5.4±0.6 |
Disintegration time ranged from 3.5±0.3 min for LT-1 to 5.5±0.4 min for LT-8 (Table 3). The low disintegration time for LT-1 is indicative of rapid drug release that could result in rapid onset of action. The disintegration time increased with increase in drug concentration probably due to the lipophilic nature of curcumin and resulting decreased wettability of the LT.
3.8. In-vitro dissolution
The in-vitro dissolution profiles (Fig. 3A) of LTs made with Tween 80 (LT-9 to LT-12) displayed the highest CDR of 89.2±2.0% to 97.3±2.0% followed in order by those made with PEG400 (LT-5 to LT-8) of 71.4±2.0% to 84.1±3.0% and PEG200 (LT-1 to LT-4) of 61.2±1.0% to 72.8±2.0%. This greater ability of Tween 80 to release curcumin is due to its ability to solubilize more amount of drug. The dissolution profiles exhibited a biphasic release pattern with an initial fast release phase (CDRR0–20 min) followed by a slow release phase (CDRR20–60 min). Values of the rate of drug release over 20 min (CDRR0–20 min) ranged from 5.09 mg/min for LT-4 to 7.58 mg/min for LT-9; values of CDRR20–60 min ranged from 1.10 mg/min for LT-1 to 2.72 mg/min for LT-12 (Table 4). Among the three groups, the highest CDRs at 60 min were from LT-1, LT-5 and LT-9 with values of 72.2%, 84.1% and 97.3%, respectively. Given that these three LTs contain the lowest drug concentrations in the liquid portion, it is clear that increasing the drug concentration in the liquid portion decreases the release rate. This is presumably because at higher drug concentration the solubility limit is exceeded, the fraction of dissolved drug in the non-volatile solvent is decreased and the release rate is thereby decreased38. Interestingly, a remarkable difference in the dissolution behavior of curcumin from LTs was observed when compared to its saturation solubility in the non-volatile solvents. This indicates that drug release from LTs is not only dependent on the solubility of the drug in the non-volatile solvent but also on other factors such as a physical or chemical interaction between curcumin and the non-volatile solvent.
Figure 3.

In-vitro dissolution profiles of (A) all liquisolid tablets (LT-1 to LT-12) and (B) selected formulations (LT-1, LT-5 and LT-9) compared to that of a directly compressed tablet (DCT) of curcumin.
Table 4.
Comparative drug release rate (CDRR) in the initial 20 min (CDRR0–20 min) and in the range 20–60 min (CDRR20–60 min) from liquisolid tablets (LT-1–LT-12).
| Formulation | CDR (%) at 20 min | CDRR0–20 min (mg/min) | CDR (%) at 60 min | CDRR20–60 min (mg/min) |
|---|---|---|---|---|
| LT-1 | 61.13 | 6.13 | 72.18 | 1.10 |
| LT-2 | 57.16 | 5.71 | 70.11 | 1.29 |
| LT-3 | 55.78 | 5.57 | 63.13 | 1.33 |
| LT-4 | 50.98 | 5.09 | 61.16 | 1.42 |
| LT-5 | 67.11 | 6.71 | 84.12 | 1.70 |
| LT-6 | 64.12 | 6.41 | 78.19 | 1.61 |
| LT-7 | 61.13 | 6.11 | 74.87 | 1.37 |
| LT-8 | 56.84 | 5.61 | 71.38 | 1.45 |
| LT-9 | 75.83 | 7.58 | 97.34 | 2.15 |
| LT-10 | 72.40 | 7.24 | 94.12 | 2.27 |
| LT-11 | 69.14 | 6.91 | 92.31 | 2.31 |
| LT-12 | 61.98 | 6.19 | 89.18 | 2.72 |
| DCT | 4.65 | 0.46 | 20.08 | 1.54 |
Reviewing the components of LTs, the role of the carrier material in the absorption/adsorption of the liquid medication (solution of curcumin in selected non-volatile solvent) and on the CDR must be recognized. MCC PH102 is porous, highly hygroscopic and hydrophilic in nature. Liquid medication is firstly adsorbed onto its surface and then absorbed through available pores resulting in disintegration of the tablet. On contact with dissolution media, the time taken for LT disintegration varied from 3.5±0.3 min (LT-1) to 5.5±0.3 min (LT-5) with the more rapid disintegration being due to the faster wetting of the LT and collapse of its structure39, 40. Thus the process of dissolution can be attributed to three mechanisms: (a) penetration of the dissolution medium through pores of the carrier material, (b) solubilization of carrier material by the dissolution medium, and (c) dissolution/diffusion/transfer of dissolved drug molecules41.
The results of dissolution can be better explained using the Noyes–Whitney equation:
| (8) |
where dC/dt is the dissolution rate of the drug particles, D is the diffusion coefficient of the dissolved drug which is dependent on the viscosity of the dissolution medium, S is the surface area exposed to dissolution, h is the thickness of the diffusion layer which is affected by agitation, CS is the saturation solubility of drug in the diffusion layer and C is the concentration of drug in the dissolution medium. Since the stirring speed and viscosity of the dissolution medium are constant, h and D can be assumed to be constant. This indicates that S and (CS–C) are the factors that control the dissolution rate of a tablet17.
The drug particles in an LT are dispersed in a hydrophilic non-volatile solvent which efficiently wets the drug particles and provides a high surface area of drug for dissolution42. When the LT disintegrates, the primary particles of the LS containing drug in a state of molecular dispersion are distributed in the dissolution medium. Accordingly, the higher dissolution rate of an LT may be attributed to the significantly larger surface area of the molecularly dispersed drug43. In addition, the solubility of the drug (CS) in the dissolution medium may be increased although this may be limited by the small amount of liquid vehicle in the LT. Nevertheless, in the diffusion layer at the solid/liquid interface, it is possible that the liquid vehicle diffuses with the drug particles away from the primary liquisolid particles. In this case, the small amount of liquid vehicle may be sufficient to increase the solubility of drug particles by acting as a co-solvent with the dissolution medium. As a result, the concentration gradient (CS−C) of the drug and the drug dissolution rate are increased41, 43, 44.
The results of solubility determination show that curcumin is more soluble in Tween 80 (54.1%, w/w), than in PEG 200 (33.6%, w/w) or PEG 400 (39.7%, w/w). In other words, Tween 80 solubilizes 37.8% more curcumin than PEG 200 and 26.7% more than PEG 400. These differences must be maintained in the LTs formulated using these solvents. The in-vitro dissolution data reveal that formulations with the lowest drug concentration (40%, w/w) exhibit the highest dissolution which can be best explained on the basis of saturation solubility. The higher the drug concentration in an LT the smaller will be the amount of non-volatile solvent added and the smaller the amount of drug solubilized in the liquid vehicle. Another explanation is that at high drug concentration, the drug precipitates the carrier pores and thereby reduces the rate of drug dissolution18. The potential to precipitate obviously depends on the solubility of drug in the solvent and the degree of saturation of the drug solution. However, it may also depend on a physical interaction between curcumin and one or more of the carrier, coating material and non-volatile solvent43, 45. Comparative analysis of dissolution profiles revealed that formulations LT-1, LT-5 and LT-9 exhibited the highest CDR (%) in their respective groups and all displayed higher dissolution than the DCT (Fig. 3B).
As reported by Abdou46, the rate of drug dissolution may depend on the physicochemical properties of the drug including its solubility, crystalline state, state of hydration, solvation and complexation. In the case of LS, the increase in surface area of the drug resulting from its adsorption onto the surface of the carrier plays a significant role. This adsorption possibly converts the drug from a crystalline to an amorphous state. In order to investigate this, powder XRD studies were carried out on LS-1, LS-5 and LS-9 as well as on curcumin and excipients.
3.9. Powder XRD
The X-ray diffractogram of curcumin showed sharp, distinct peaks notably at 2θ angles of 23.1°, 24.4° and 25.4° confirming its crystallinity (Fig. 4). Similarly the diffractogram of MCC PH102 showed a sharp prominent peak at 22.3° also confirming its crystalline nature. In contrast, a smooth low intensity broad peak in the diffractogram of Aerosil® reflected its amorphous nature. Utilizing the concept of proportionality between the intensity of peaks47 and solubility, diffractograms of LS and LTs were compared in terms of CI values.
Figure 4.
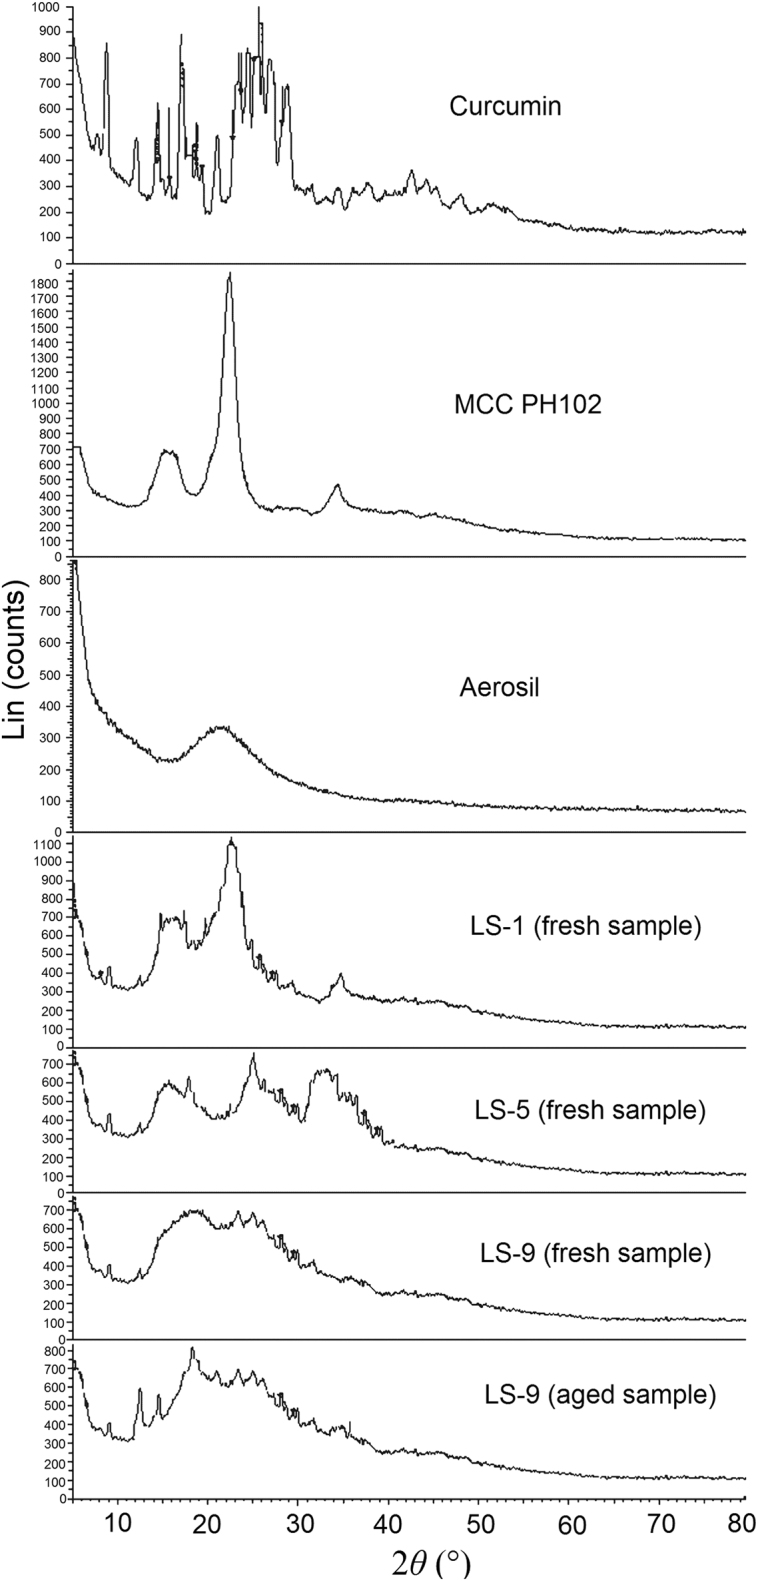
Powder X-ray diffractograms of curcumin, MCC PH102, Aerosil®, selected liquisolid systems (LS-1, LS-5 and LS-9, fresh samples) and LS-9 (aged sample).
The diffractogram of LS-9 did not show a peak at 25.4° (characteristic of curcumin) but did show one at 22.3° (characteristic of MCC PH102) but with reduced intensity (Fig. 4). This indicates that curcumin is no longer in a crystalline form in LS-9 and that MCC PH102 is less crystalline probably due to its partial solubilization in the non-volatile solvent. Similar patterns were observed for LS-1 and LS-5 also indicating their more amorphous state. This was further confirmed by CI determinations where the CI of curcumin of 78.2 was reduced to values of 65.5 (LS-1), 52.6 (LS-5) and 47.8 (LS-9). This confirms that curcumin is molecularly dispersed and that LS systems are more amorphous due to partial solubilization of MCC PH102 and Aerosil® in the non-volatile solvent.
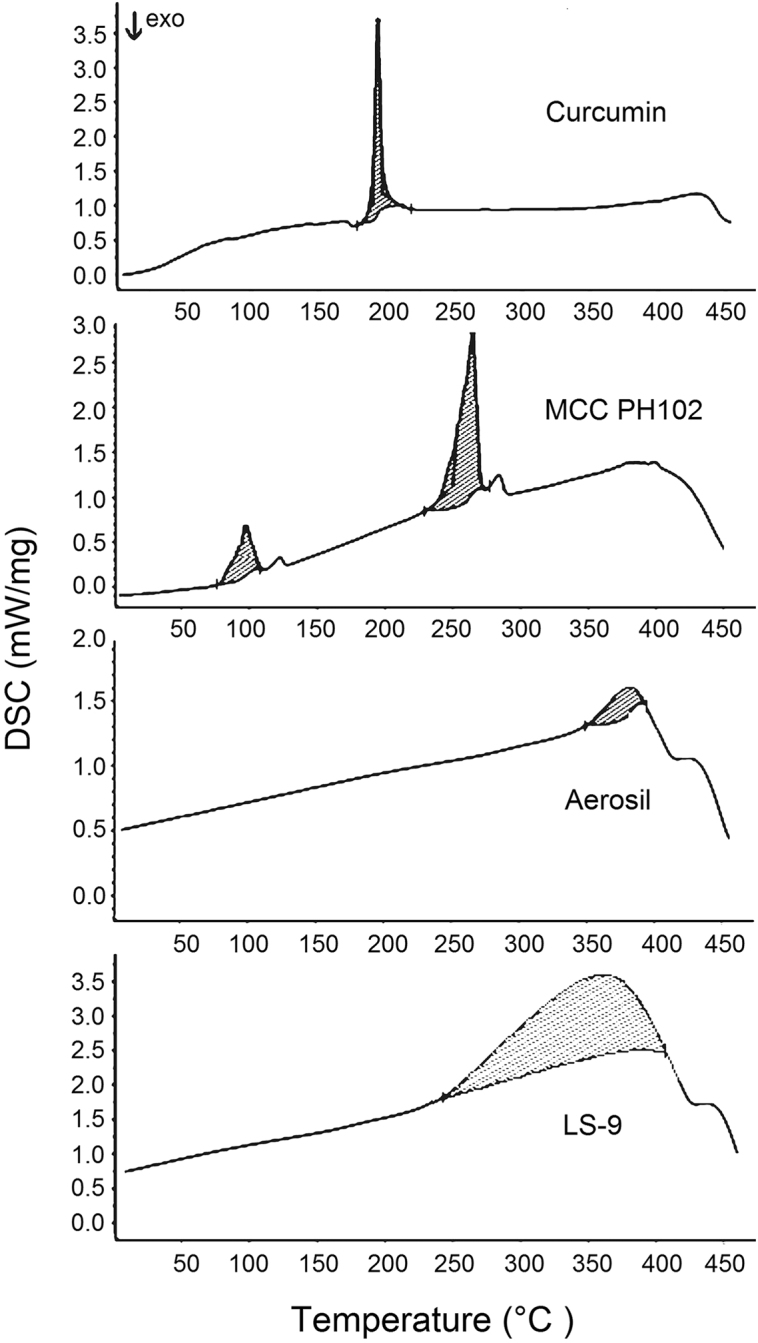
3.10. DSC
The characteristic peak of curcumin at 182.4 °C corresponds to its melting point (Fig. 5). The thermogram of MCC PH102 displays two broad endothermic peaks at 98.99 and 264.7 °C corresponding to volatilization of absorbed water and melting of crystalline cellulosic material, respectively44. The thermogram of Aerosil® showed a broad endotherm at 376 °C due to charring and decomposition of the sample mass. In the thermogram of LS, the characteristic peak of curcumin was absent confirming its molecular dispersion in the system. This is consistent with information provided by McCauley and Brittain (1995)48 indicating the complete loss of drug thermal features in an amorphous solid solution. However, a broad endothermic peak over the temperature range 242–404 °C probably results from the melting and decomposition of the entire LS. The thermogram of LS-9 is indicative of a disturbance in the crystalline habit of the components of the formulation which can be ascribed to a physical interaction between the excipients during processing. This physical interaction may be the result of adsorption of liquid drug onto the surface of MCC PH102. Furthermore, the absence of the characteristic peak of curcumin at 182.4 °C indicates a physical interaction between drug, carrier material and non-volatile solvent, validating the results of powder XRD.
Figure 5.
Differential scanning calorimetry (DSC) thermograms of curcumin, MCC PH102, Aerosil® and LS-9.
3.11. SEM
The photomicrograph of curcumin (Fig. 6A) reveals irregular crystals with a wide particle distribution while that of MCC PH102 (Fig. 6B) shows large elongated slab-like crystals. The photomicrograph of Aerosil® (Fig. 6C) indicates the presence of clusters of microfibers and a fluffy arrangement. The SEM of LS-9 (Fig. 6D) reveals particles of MCC PH102 uniformly covered with Aerosil®. The complete absence of curcumin crystals clearly indicates the drug is completely solubilized in the non-volatile solvent (Tween 80) and is adsorbed/absorbed onto the carrier material (MCC PH102). The efficiency of Aerosil® as a coating material is also evidenced by its uniform distribution on the surface of MCC PH102 promoting the retention of non-volatile solvent to produce an apparently dry free flowing LS. Hence the ability of LS to hold drug within a powder substrate in a solubilized form is confirmed.
Figure 6.

Scanning electron micrographs of (A) curcumin, (B) MCC PH102, (C) Aerosil® and (D) LS-9.
The mechanism of enhanced dissolution of LT-9 has been thoroughly discussed but it is important to elucidate the chemical interaction at the molecular level. As explained previously, the non-volatile solvent forms hydrogen bonds with curcumin which solubilize it and ultimately affects its release. However, drug release is not solely dependent on enhanced solubility but possibly involves some degree of chemical interaction. This interaction was investigated by FTIR analysis of LT-9.
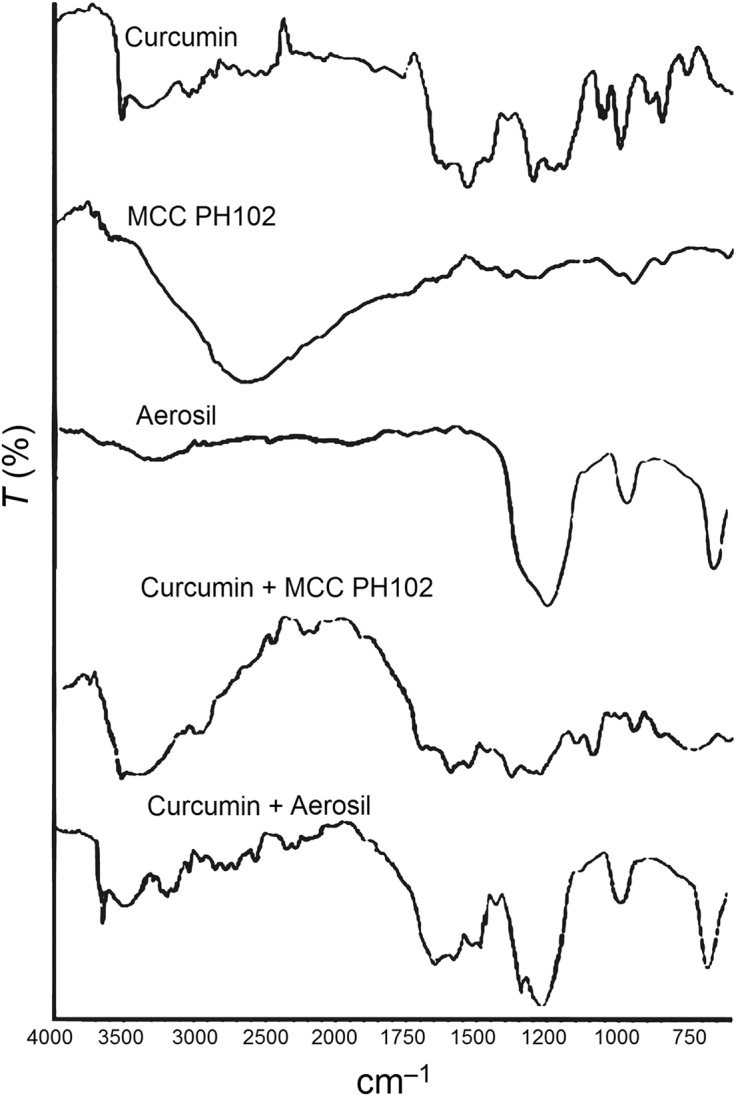
3.12. FTIR analysis
The FTIR spectrum of curcumin displays a sharp and prominent peak in the range 3550–3400 cm–1 reflecting the presence of free –OH groups (Fig. 7A) which are the predominant site for hydrogen bond formation49. In the presence of Tween 80 and MCC PH102, the sharp peak at 3508 cm–1 becomes much weaker and is accompanied by the appearance of a broad band at 3550–3050 cm–1 (Fig. 7B). This is indicative of hydrogen bond formation34. Furthermore, on addition of Aerosil®, the sharp –OH stretching vibration completely disappears and the broad band extends over the broader range of 3780–3050 cm–1 (Fig. 7C). This indicates the replacement of weak hydrogen bonds by stronger ones on addition of Aerosil®50. A similar finding was reported by Planinsek et al.51 who investigated the interaction between drug and excipients and reported that newly formed strong hydrogen bonds cause cleavage of weaker ones and play an important role in enhancing drug release from the system. In conclusion, it is apparent that Tween 80, MCC PH102 and Aerosil® all make positive contributions to enhancing the dissolution of curcumin from an LT.
Figure 7.

FTIR spectra of (A) curcumin, (B) curcumin + Tween 80 + MCC PH102 and (C) curcumin + Tween 80 + MCC PH102 + Aerosil®, indicating a positive chemical interaction involving formation of new hydrogen bonds.
3.13. Ex-vivo gastric permeation
Any dosage form administered by the oral route must transit the gastric cavity and later the intestinal region. During this transit, the drug is exposed to an acidic pH in the stomach followed by a more alkaline pH in the gastrointestinal tract. As reported previously, curcumin is insoluble and stable at acidic pH but slightly soluble and unstable at alkaline pH52. Thus, bioavailability is predicted to be increased if most of the drug is absorbed from the gastric cavity rather than from the intestine. To investigate whether formulation in an LT can enhance permeation of curcumin as shown for other drugs53, an ex vivo permeation study was performed. Since the gastric transit time is 2 h, the study was designed to estimate drug permeation within 2 h. The percent cumulative drug permeated (CDP) was found to be 89.2% with an r20–20min value (coefficient of regression ranges from 0 to 20 min) of 0.9854 in the initial phase followed by r220–120min (coefficient of regression ranges from 20 to 120 min) of 0.8445 in the later phase. The ex vivo permeation profile (CDP, %) is compared with the in vitro dissolution profile of LS-9 (CDR, %) in Fig. 8 where at any given time the magnitude of release is greater than that of permeation. This indicates that curcumin effectively permeates across the gastric mucosa with almost 100% of drug permeating within 2 h.
Figure 8.

Plots of cumulative drug release (CDR%) and cumulative drug permeation (CDP %) vs. time profiles of LT-9.
3.14. In vitro cytotoxicity
Although curcumin is a proven anticancer agent, the objective of the in vitro cytotoxicity study was to validate the anticancer activity of a curcumin LT against NCL-87 cancer cells. The growth inhibition profiles (Fig. 9) of curcumin and LT-9 indicate similar anticancer activity that is much less than that of paclitaxel (reference) which shows 100% growth inhibition at <10 µmol/L. The IC50 for paclitaxel of 5.20 µmol/L was significantly lower (P<0.01) than those for curcumin of 32.1 µmol/L and LT-9 of 40.2 µmol/L. This may be attributed to the fact that curcumin has less ability to reach the cellular cytoplasm. The slightly lower cytotoxicity of LT-9 than curcumin is presumably due to the presence of the excipients in the LT54. As previously documented by Perkin et al.55, IC50≤20 µmol/L indicates excellent anticancer activity while IC50≤40 µmol/L reflects good anticancer activity.
Figure 9.

In vitro cytotoxicity profiles of curcumin, LT-9 and paclitaxel.
3.15. Pharmacokinetic study
The mean plasma concentration-time profiles (Fig.10) for curcumin administered as LT-9 and DCTs to rabbits were analyzed by a one compartment open model for which data are presented in Table 5. The curcumin concentration-time profile of LT-9 shows much higher plasma concentrations than that of DCT at all time points. Values of Cmax and Tmax for LT-9 were 3.62±0.33 µg/mL and 2.00±0.17 h, respectively, compared to 0.24±0.47 µg/mL and 1.00±0.16 h, respectively, for DCTs. Thus the curcumin Cmax was enhanced 15.4-fold by formulation in an LT.
Figure 10.

Curcumin plasma concentration–time profiles of LT-9 and a directly compressed tablet (DCT).
Table 5.
Comparative pharmacokinetic data for curcumin administered as DCT and LT-9 formulations.
| Parameter | Unit | DCT | LT-9 |
|---|---|---|---|
| Cmax | µg/mL | 0.24±0.47 | 3.62±0.33 |
| Tmax | h | 1.00±0.16 | 2.00±0.17 |
| AUC0–10 h | µg·h/mL | 1.21±3.57 | 22.35±2.96 |
| AUC0–∞ | µg·h/mL | 1.22±4.62 | 22.80±5.55 |
| FR | – | 18.63±1.026 | |
| Ka | h–1 | 0.54±0.00 | 4.48±0.00 |
| Ke | h–1 | 0.06±0.01 | 0.33±0.04 |
| CLT | – | 0.06 × Vd | 0.33×Vd |
| t1/2 | h | 11.17±0.15 | 2.11±0.56 |
The absorption rate constant (Ka) of curcumin in LT-9 was enhanced 8.28-fold in comparison to DCT consistent with enhanced in vivo dissolution of the drug from the LT (Table 5). As the rate of absorption is a directly related to bioavailability which in turn depends on the solubility of the drug, the AUC was predictably higher for LT-9 than for DCT with values of AUC0–∞ of 22.80±5.55 and 1.22±4.62 μg·h/mL, respectively. This corresponds to a relative bioavailability of 18.6±1.0. This pharmacokinetic data support the results of in vitro studies in showing that the liquisolid technique increases drug solubility leading to higher dissolution, improved absorption and enhanced bioavailability. A similar increase in bioavailability by formulation in an LT was previously established for famotidine44.
3.16. Stability
Accelerated stability studies of LT-9 and LS-9 were performed to investigate the effect of storage on physical state and dissolution behavior. A dissolution study of aged LT-9 samples showed CDR (%) was not significantly different from the value for fresh LT-9 samples indicating dissolution was not affected by stressed environmental conditions. The similarity factor (f2) of 79 and difference factor (f1) of 4 confirm no effect of aging on the performance of LT-9. Powder XRD analysis of aged LS-9 (Fig. 4) showed small increment in the intensity of the characteristic peaks of MCC PH102, which may indicate slight crystallization of dissolved MCC PH102 in the non-volatile solvent. The XRD pattern was also analyzed for changes in crystallinity of LS-9 by calculating the CI where the value of 49.2 for aged samples was not significantly different from the value of 47.8 for fresh samples. In summary, the data show both LS-9 and LT-9 are stable on storage under stressed conditions.
4. Conclusions
This study confirmed that liquisolid technology is a promising approach to formulate a solid dosage form of curcumin with enhanced dissolution characteristics. Formulation in a liquisolid tablet facilitated molecular dispersion of the poorly water-soluble drug within a hydrophilic carrier matrix that was amenable to pharmaceutical manufacturing. Determination of in vitro cytotoxicity established that the anticancer potential of the dosage form was comparable to that of curcumin. A pharmacokinetic study in rabbits showed that the enhancement in dissolution due to replacement of weaker hydrogen bonds by stronger ones resulted in enhanced bioavailability of curcumin. Stability studies indicated that the liquisolid tablets were stable even under stressed conditions. Overall, the developed liquisolid tablet of curcumin has strong potential for commercialization once its clinical efficacy has been established.
Footnotes
Peer review under responsibility of Institute of Materia Medica, Chinese Academy of Medical Sciences and Chinese Pharmaceutical Association.
References
- 1.Preetha A., Banerjee R., Huilgol N. Tensiometric profiles and their modulation by cholesterol: implications in cervical cancer. Cancer Invest. 2007;25:172–181. doi: 10.1080/07357900701209053. [DOI] [PubMed] [Google Scholar]
- 2.Fang J.Y., Hung C.F., Chiu H.C., Wang J.J., Chan T.F. Efficacy and irritancy of enhancers on the in-vitro and in-vivo percutaneous absorption of curcumin. J Pharm Pharmacol. 2003;55:593–601. doi: 10.1211/002235703765344496. [DOI] [PubMed] [Google Scholar]
- 3.Shobha G., Joy D., Joseph T., Majeed M., Rajendran R., Srinivas P.S. Influence of piperine on the pharmacokinetics of curcumin in animals and human volunteers. Planta Med. 1998;64:353–356. doi: 10.1055/s-2006-957450. [DOI] [PubMed] [Google Scholar]
- 4.Li L., Braiteh F.S., Kurzrock R. Liposome-encapsulated curcumin: in vitro and in vivo effects on proliferation, apoptosis, signaling, and angiogenesis. Cancer. 2005;104:1322–1331. doi: 10.1002/cncr.21300. [DOI] [PubMed] [Google Scholar]
- 5.Bisht S., Feldmann G., Soni S., Ravi R., Karikar C., Maitra A. Polymeric nanoparticle-encapsulated curcumin (“nanocurcumin”): a novel strategy for human cancer therapy. J Nanobiotech. 2007;5:3. doi: 10.1186/1477-3155-5-3. [DOI] [PMC free article] [PubMed] [Google Scholar]
- 6.Mosely C.A., Liotta D.C., Snyder J.P. Highly active anticancer curcumin analouges. Adv Exp Med Biol. 2007;595:77–103. doi: 10.1007/978-0-387-46401-5_2. [DOI] [PubMed] [Google Scholar]
- 7.Anand P., Kunnumakkara A.B., Newman R.A., Aggarwal B.B. Bioavailability of curcumin: problems and promises. Mol Pharm. 2007;4:807–818. doi: 10.1021/mp700113r. [DOI] [PubMed] [Google Scholar]
- 8.Wahlström B., Blennow G. A study on the fate of curcumin in the rat. Acta Pharmacol Toxicol. 1978;43:86–92. doi: 10.1111/j.1600-0773.1978.tb02240.x. [DOI] [PubMed] [Google Scholar]
- 9.Ravindranath V., Chandrasekhara N. Absorption and tissue distribution of curcumin in rats. Toxicology. 1980;16:259–265. doi: 10.1016/0300-483x(80)90122-5. [DOI] [PubMed] [Google Scholar]
- 10.Ravindranath V., Chandrasekhara N. Metabolism of curcumin—studies with [3H]curcumin. Toxicology. 1981&;1982;22:337–344. doi: 10.1016/0300-483x(81)90027-5. [DOI] [PubMed] [Google Scholar]
- 11.Ireson C., Orr S., Jones D.J., Verschoyle R., Lim C.K., Luo J.L. Characterization of metabolites of the chemopreventive agent curcumin in human and rat hepatocytes and in the rat in vivo, and evaluation of their ability to inhibit phorbol ester-induced prostaglandin E2 production. Cancer Res. 2001;61:1058–1064. [PubMed] [Google Scholar]
- 12.Pathak D., Dahiya S., Pathak K. Solid dispersion of meloxicam: factorially designed dosage form for geriatric population. Acta Pharm. 2008;58:99–110. doi: 10.2478/v10007-007-0048-y. [DOI] [PubMed] [Google Scholar]
- 13.Spireas S, Bolton M. Liquisolid systems and methods of preparing same. United State Patent 6423339 B1. 2002 July 23.
- 14.Amidon G.L., Lennernäs H., Shah V.P., Crison J.R. A theoretical basis for Biopharmaceutic drug classification: the correlation of in vitro drug product dissolution and in vivo bioavailability. Pharm Res. 1995;12:413–420. doi: 10.1023/a:1016212804288. [DOI] [PubMed] [Google Scholar]
- 15.Spireas S., Sadu S. Enhancement of prednisolone dissolution properties using liquisolid compacts. Int J Pharm. 1998;166:177–188. [Google Scholar]
- 16.Nokhodchi A., Alikbar R., Desai S., Javadzadeh Y. Liquisolid compacts: the effect of cosolvent and HPMC on theophylline release. Col Surf B: Biointerfaces. 2010;79:262–269. doi: 10.1016/j.colsurfb.2010.04.008. [DOI] [PubMed] [Google Scholar]
- 17.Javadzadeh Y., Jafari-Navimipour B., Nokhodchi A. Liquisolid technique for dissolution rate enhancement of a high dose water-insoluble drug (carbamazepine) Int J Pharm. 2007;341:26–34. doi: 10.1016/j.ijpharm.2007.03.034. [DOI] [PubMed] [Google Scholar]
- 18.Tayel S.A., Soliman I.I., Louis D. Improvement of dissolution properties of carbamazepine through application of the liquisolid tablet technique. Eur J Pharm Biopharm. 2008;69:342–347. doi: 10.1016/j.ejpb.2007.09.003. [DOI] [PubMed] [Google Scholar]
- 19.Carstensen J.T., Rhodes C.T. 4th ed. Marcel Dekker; New York: 2000. Drug stability: principles and practices. [Google Scholar]
- 20.Martin A. Walters Kluwer Pvt. Ltd.; New Delhi: 1999. Physical pharmacy and pharmaceutical sciences. [Google Scholar]
- 21.Kumar B., Sharma V., Pathak K. Effect of melt sonocrystallization on pharmacotechnical properties of paracetamol, indomethacin and mefenamic acid characterized by dynamic laser scattering and its impact on solubility. Drug Dev Ind Pharm. 2012;39:687–695. doi: 10.3109/03639045.2012.687743. [DOI] [PubMed] [Google Scholar]
- 22.Gupta P.S., Sharma V., Pathak K. Melt sonocrystallized piroxicam for oral delivery: particle characterization, solid state analysis and pharmacokinetics. Expert Opin Drug Deliv. 2012;10:17–32. doi: 10.1517/17425247.2013.736961. [DOI] [PubMed] [Google Scholar]
- 23.The U.S. Pharmacopeial Convention . United States Pharmacopeia; Rockville, MD: 2004. The United States Pharmacopeia (USP 27); The National Formulary (NF 22) [Google Scholar]
- 24.Arya P., Pathak K. Assessing the viability of microsponges as gastro retentive drug delivery system of curcumin: optimization and pharmacokinetics. Int J Pharm. 2014;460:1–12. doi: 10.1016/j.ijpharm.2013.10.045. [DOI] [PubMed] [Google Scholar]
- 25.Heath D.D., Pruitt M.A., Brenner D.E., Rock C.L. Curcumin in plasma and urine: quantitation by high performance liquid chromatography. J Chromat B. 2003;783:287–295. doi: 10.1016/s1570-0232(02)00714-6. [DOI] [PubMed] [Google Scholar]
- 26.Aggarwal B.B., Kumar A., Bharti A.C. Anticancer potential of curcumin: preclinical and clinical studies. Anticancer Res. 2003;23:363–398. [PubMed] [Google Scholar]
- 27.Briscoe T., Luckham P., Zhu S. The effects of hydrogen bonding upon the viscosity of aqueous poly (vinyl alcohol) solutions. Polymer. 2000;41:3851–3860. [Google Scholar]
- 28.Sprieas S.S. St. John׳s University; New York: 1993. Theoretical and practical aspect of liquisolid compacts [dissertation] [Google Scholar]
- 29.Spirea S. Liquisolid systems and methods of preparing same. United State Patent US 5800834 A. 1998 Sep 1.
- 30.Spireas S.S., Jarowski C.I., Rohera B.D. Powdered solution technology: principle and mechanism. Pharm Res. 1992;9:1351–1358. doi: 10.1023/a:1015877905988. [DOI] [PubMed] [Google Scholar]
- 31.Takami K., Machimura H., Takado K., Inagaki M., Kawashima Y. Novel preparation of free flowing spherically granulated dibasic calcium phosphate anhydrous for direct tabletting. Chem Pharm Bull. 1996;44:868–870. [Google Scholar]
- 32.Schlack H., Bauer-Brandl A., Schubert R., Becker D. Properties of fujicalin, a new modified anhydrous dibasic calcium phosphate for direct compression: comparison with dicalcium phosphate dihydrate. Drug Dev Ind Pharm. 2001;27:789–801. doi: 10.1081/ddc-100107242. [DOI] [PubMed] [Google Scholar]
- 33.Stankovic I. Advantame—chemical and technical assessment. First draft published in joint FAO/WHO expert committee on food additives. 2004 〈http://www.fao.org/fileadmin/user_upload/agns/pdf/CTA_Advantame_77.pdf〉 Available from. [Google Scholar]
- 34.Singh D., Pathak K. Hydrogen bond replacement—unearthing a novel molecular mechanism of surface solid dispersion for enhanced solubility of a drug for veterinary use. Int J Pharm. 2013;441:99–110. doi: 10.1016/j.ijpharm.2012.12.008. [DOI] [PubMed] [Google Scholar]
- 35.Cain J. An alternative technique for determining ANSI/CEMA standard 550 flowability ratings for granular materials. Powder Hand Proc. 2002;14:218–220. [Google Scholar]
- 36.Aulton ME. Pharmaceutics: the science of dosage form design. 3rd ed. New York: Churchil Livingstone; 2008. p. 244–58
- 37.Lachman L, Leibermen HA, Kanig JK. The theory and practice of industrial pharmacy. Philadelphia: Lea and Febiger; 2002. p. 36–102
- 38.Hentzschel C.M., Sakmann A., Leopold C.S. Suitability of various excipients as carrier and coating materials for liquisolid compacts. Drug Dev Ind Pharm. 2011;37:1200–1207. doi: 10.3109/03639045.2011.564184. [DOI] [PubMed] [Google Scholar]
- 39.Smirnova I., Suttiruengwong S., Arlt W. Feasibility study of hydrophilic and hydrophobic silica aerogels as drug delivery systems. J Non-Cryst Solids. 2004;350:54–60. [Google Scholar]
- 40.Smirnova I., Türk M., Wischumerski R., Wahl M.A. Comparison of different methods for enhancing the dissolution rate of poorly soluble drugs: case of griseofulvin. Eng Life Sci. 2005;5:277–280. [Google Scholar]
- 41.Javadzadeh Y., Siahi M.R., Asnaashari S., Nokhodchi A. An investigation of physicochemical properties of piroxicam liquisolid compacts. Pharm Dev Tech. 2008;12:337–343. doi: 10.1080/10837450701247574. [DOI] [PubMed] [Google Scholar]
- 42.Elkordy A.A., Bhangale U., Murle N., Zarara M.F. Combination of lactose (as a carrier) with cremophor® EL (as a liquid vehicle) to enhance dissolution of griseofulvin. Powder Tech. 2013;246:182–186. [Google Scholar]
- 43.Tiong N., Elkordy A.A. Effects of liquisolid formulations on dissolution of naproxen. Eur J Pharm Biopharm. 2009;73:373–384. doi: 10.1016/j.ejpb.2009.08.002. [DOI] [PubMed] [Google Scholar]
- 44.Fahmy R.H., Kaseem M.A. Enhancement of famotidine dissolution rate through liquisolid tablet formation: in vitro and in vivo evaluation. Eur J Pharm Biopharm. 2008;69:993–1003. doi: 10.1016/j.ejpb.2008.02.017. [DOI] [PubMed] [Google Scholar]
- 45.Kamel R., Basha M. Preparation and in vitro evaluation of rutin nanostructured liquisolid delivery system. Bull Faculty Pharm Cairo Univ. 2013;51:261–272. [Google Scholar]
- 46.Abdou H.M. Effect of the physicochemical properties of the drug on dissolution rate. In: Abdou H.M., editor. Dissolution, bioavailability and bioequivalence. Mack Pub. Co; Easton: 1989. pp. 53–72. [Google Scholar]
- 47.Chaulang G., Patel P., Hardikar S., Kelkar M., Bhosale A., Bhise S. Formulation and evaluation of solid dispersions of furosemide in sodium starch glycolate. Tropical J Pharm Res. 2009;8:43–51. [Google Scholar]
- 48.McCauley J.A., Brittain H.G. Thermal methods of analysis. In: Brittain H.G., editor. Physical characterization of pharmaceutical solids, drugs and pharmaceutical sciences. Marcel Dekker Inc.; New York: 1995. pp. 223–250. [Google Scholar]
- 49.Von Silverstein R.M., Webster F.X. John Wiley and Sons Inc.; New York: 2003. Spectrometric identification of organic compounds. [Google Scholar]
- 50.Kaushal A.M., Chakraborti A.K., Bansal A.K. FTIR studies on differential intermolecular association in crystalline and amorphous states of structurally related non-steroidal anti-inflammatory drugs. Mol Pharmaceutics. 2008;5:937–945. doi: 10.1021/mp800098d. [DOI] [PubMed] [Google Scholar]
- 51.Planinšek O., Kovačič B., Vrečer F. Carvediol dissolution improvement by preparation of solid dispersions with porous silica. Int J Pharm. 2011;406:41–48. doi: 10.1016/j.ijpharm.2010.12.035. [DOI] [PubMed] [Google Scholar]
- 52.Kumria R., Pathak K., Singh Y. Curcumin: the therapeutic benefits. Pharma Buzz. 2009;4:19–23. [Google Scholar]
- 53.Sanka K., Poienti S., Mohd A.B., Diwan P.V. Improved oral delivery of clonazepam through liquisolid powder compact formulations: in-vitro and ex-vivo characterization. Powder Technol. 2014;256:336–344. [Google Scholar]
- 54.Wang E.S., Pili R., Seshadri M. Modulation of chemotherapeutic efficacy by vascular disrupting agents: optimizing the sequence and schedule. J Clin Oncol. 2012;30:760–761. doi: 10.1200/JCO.2011.39.3934. [DOI] [PubMed] [Google Scholar]
- 55.Perkin S., Verschoyle R.D., Hill K., Praveen I., Threadgill M.D., Sharma R.A. Chemopreventive efficacy and pharmacokinetics of curcumin in the Min/+ mouse, a model of familial adenomatous polyposis. Cancer Epidemiol Biomarkers Prev. 2002;11:535–540. [PubMed] [Google Scholar]