

Abstract
Study Objective
A safe alternative to erythropoiesis‐stimulating agents to treat anemia is warranted in patients with cancer and anemia; thus the objective of this trial was to compare the efficacy and safety of intravenous (IV) iron isomaltoside with oral iron in patients with cancer and anemia by testing the noninferiority of IV versus oral iron.
Design
Phase III, prospective, open‐label, comparative, randomized, noninferiority, multicenter trial.
Setting
Forty‐seven hospitals or private cancer clinics in Asia, the United States, and Europe.
Patients
A total of 350 patients with cancer and anemia.
Intervention
Patients were randomized in a 2:1 ratio to either intravenous iron isomaltoside or oral iron sulfate. Patients in the iron isomaltoside group were then randomized into an infusion subgroup (single intravenous infusions of a maximum dose of 1000 mg over 15 min) or a bolus injection subgroup (bolus injections of 500 mg over 2 min).
Measurements and Main Results
The primary efficacy outcome was change in hemoglobin concentration from baseline to week 4. Changes in other relevant hematology variables, effect on quality of life, and safety outcomes were also assessed. The primary efficacy outcome was tested for noninferiority, whereas the remaining outcomes were tested for superiority. Iron isomaltoside was noninferior to oral iron in change in hemoglobin concentration from baseline to week 4 (difference estimate 0.016, 95% confidence interval –0.26 to 0.29, p<0.001). A faster onset of the hemoglobin response was observed with infusion of iron isomaltoside (superiority test: p=0.03 at week 1), and a sustained effect on hemoglobin level was shown in both the iron isomaltoside and oral iron treatment groups until week 24. A significant mean decrease in fatigue score was observed from baseline to week 12 in the iron isomaltoside group (p<0.001) but not in the oral iron group (p=0.057). A higher proportion of patients treated with oral iron experienced adverse drug reactions (18.8% vs 6.6%, p<0.001) and discontinued the trial due to intolerance (8.0% vs 0.9%, p=0.001). Transient hypophosphatemia (phosphate level less than 2 mg/dl) was reported at similar low frequencies among the groups: 7.1% in the iron isomaltoside infusion subgroup versus 8.5% in the iron isomaltoside bolus injection subgroup versus 5.4% in the oral iron group.
Conclusion
This trial demonstrated comparable sustained increases in hemoglobin concentration over time with both iron isomaltoside and oral iron. Iron isomaltoside was better tolerated than oral iron, and fatigue was significantly decreased with iron isomaltoside. Low rates of clinically insignificant hypophosphatemia were reported in patients receiving both treatments.
Keywords: anemia, cancer, iron isomaltoside, iron treatment
Anemia is associated with chronic diseases including cancer. Mild to moderate anemia develops in up to 75% of patients with cancer who are undergoing treatment with chemotherapy and/or radiation therapy.1 Mild to moderate anemia is often not treated and frequently considered clinically unimportant. However, multiple clinical trials have reported that low hemoglobin (Hb) levels in patients with cancer result in a perceptible reduction in energy, activity, and quality of life (QoL)1 that correlates with decreased performance and poorer prognoses and outcomes.2 According to the European Cancer Anemia Survey, only 40% of patients who were anemic at some time during the survey received treatment for their anemia.3
Current treatments for anemia of cancer and chemotherapy include red blood cell transfusions and administration of erythropoiesis‐stimulating agents (ESAs) with or without iron therapy. Poor absorption and intolerance limit the use of oral iron supplementation,4 transfusions can cause serious adverse effects, and ESAs are costly and have safety issue concerns.5, 6 The current National Comprehensive Cancer Network guideline (v.2 [2016]) recommends intravenous (IV) or oral supplementation for absolute iron deficiency (defined as a ferritin level lower than 30 ng/ml and transferrin saturation [TSAT] less than 20%), and IV iron supplementation is recommended for functional iron deficiency (defined as a ferritin level 30–800 ng/ml and TSAT 20–50%) in patients receiving ESAs.7
Iron isomaltoside 1000 (Monofer; Pharmacosmos A/S, Holbaek, Denmark) was launched in Europe in 2010 as a high‐dose IV iron formulation for fast infusion. It consists of iron and a carbohydrate moiety in which the iron is tightly bound in a matrix structure, enabling a controlled and slow release of iron to iron‐binding proteins, avoiding potential toxicity from release of labile iron.8 Previous published data demonstrated safety, efficacy, and tolerability of iron isomaltoside in different patient populations.9, 10, 11, 12, 13, 14, 15 The primary objective of the current trial was to demonstrate whether IV iron isomaltoside is noninferior to oral iron sulfate in its ability to increase Hb concentration in anemic patients receiving cancer chemotherapy without concomitant use of ESAs.
Methods
Trial Design
This was a prospective, comparative, open‐label, randomized, noninferiority, multicenter trial that involved eight patient visits during a 24‐week period. All protocols and amendments were approved by local ethics committees, institutional review boards, and competent authorities (EudraCT number 2009‐016727‐53). The trial was conducted in accordance with good clinical practice and the Declaration of Helsinki of 1975, as revised in 2008. The trial was registered at ClinicalTrials.gov (identifier NCT0114‐5638). Written informed consent was obtained from all participants.
Patients
The trial was performed at 47 sites: 18 in India, 9 in Russia, 7 in Poland, 4 in Germany, 3 in the United States, 2 each in Sweden and Spain, and 1 each in Denmark and the United Kingdom. Patients were recruited if they were at least 18 years of age, were diagnosed with nonmyeloid malignancies (including all solid tumors, low‐grade lymphoma, high‐grade lymphoma, chronic lymphatic leukemia, and myeloma), were receiving chemotherapy (at least 1 day) prior to screening and had at least two more chemotherapy cycles planned, and had a Hb level lower than 12.0 g/dl, TSAT less than 50%, serum ferritin level lower than 800 μg/L, and an Eastern Cooperative Oncology Group performance status of 0–2. Inclusion and exclusion criteria are shown in Supplementary Table S1.
Interventions
Patients were randomized in a 2:1 ratio to either iron isomaltoside 1000 (Monofer) or oral iron sulfate (Ferro Duretter; GlaxoSmithKline, Stockholm, Sweden). The total IV iron needed for each patient in the iron isomaltoside group was calculated according to an adapted Ganzoni formula (target Hb level was 13 g/dl [8.1 mmol/L]): cumulative iron dose [mg] = [body weight (kg) × (target Hb: actual Hb (g/dl)] × 2.4 + depot iron (set at 500 mg).16 Patients treated with iron isomaltoside were randomized to either single IV infusions of a maximum of 1000 mg iron isomaltoside over 15 minutes or bolus injections of iron isomaltoside 500 mg over ~2 minutes. The full iron correction dose of infusion iron was achieved by one or up to two doses at a weekly interval, whereas the IV bolus injections were administered once/week until the full correction dose was achieved (1–4 doses at weekly intervals). Patients who received oral iron sulfate were treated daily for 12 weeks with 200 mg given as 100 mg twice/day, which is the standard summary of product characteristics recommendation for oral iron sulfate in patients with iron deficiency. During the trial, iron supplementation other than the investigational drug, blood transfusion, ESAs, and medications that could potentially reduce oral iron absorption were not allowed.
Outcomes
The primary efficacy outcome was a change in Hb concentration from baseline to week 4. The secondary efficacy outcomes were a change in Hb concentration from baseline to weeks 1, 2, 8, 12, and 24; change in serum iron and serum ferritin concentrations, total iron‐binding capacity (TIBC), and TSAT from baseline to weeks 1, 2, 4, 8, 12, and 24; and change in total QoL score (Functional Assessment of Cancer Therapy [FACT]‐Fatigue questionnaire17) from baseline to weeks 4 and 12.
Safety outcomes included the proportion of patients who experienced any adverse drug reaction (ADR) and abnormal safety laboratory assessments.
The primary efficacy outcome was tested for noninferiority, whereas the remaining outcomes were tested for superiority.
Sample Size and Randomization
A stratified block randomization methodology was used to assign patients in a 1:1:1 ratio to receive iron isomaltoside 1000‐mg infusions, iron isomaltoside 500‐mg bolus injections, or oral iron sulfate. The randomization was stratified by Hb level (lower than 10 vs 10 g/dl or higher), serum ferritin level (using two cut‐off 20 vs 20 μg/L or higher and lower than 100 vs 100 μg/L or higher), TSAT (TSAT less than 15% vs 15% or more), and whether or not the patient received platinum‐based chemotherapy.
With a two‐sided significance level of 5% and a noninferiority margin of −0.5 g/dl, there was 80% power to demonstrate noninferiority with 214 patients in the iron isomaltoside group and 107 patients in the oral iron group. Because the trial was designed to demonstrate noninferiority, and it was a requirement that the analyses of the full analysis set (FAS) and the per protocol (PP) population should lead to similar conclusions, both analysis sets needed to be powered properly. It was anticipated that ~10% of patients would have major protocol violations; thus a sample size of 350 patients would be required to achieve adequate power.
Statistical Analysis
A total of 556 patients were screened, of whom 350 patients were randomized in a 2:1 ratio to the iron isomaltoside group (231 patients) or oral iron group (119 patients). Those in the iron isomaltoside group were further randomized to the infusion group (114 patients) and bolus injection group (117 patients).
The following data sets were used in the analyses (Figure 1). The randomized population (350 patients) consisted of patients who were randomized in the trial. The safety population (341 patients) consisted of randomized patients who received at least one dose of the trial drug. The FAS population (337 patients) consisted of randomized patients who received at least one dose of the trial drug and had at least one post baseline Hb assessment. The PP population (315 patients) consisted of all patients in the FAS who did not have any major protocol deviation of clinical or statistical relevance.
Figure 1.
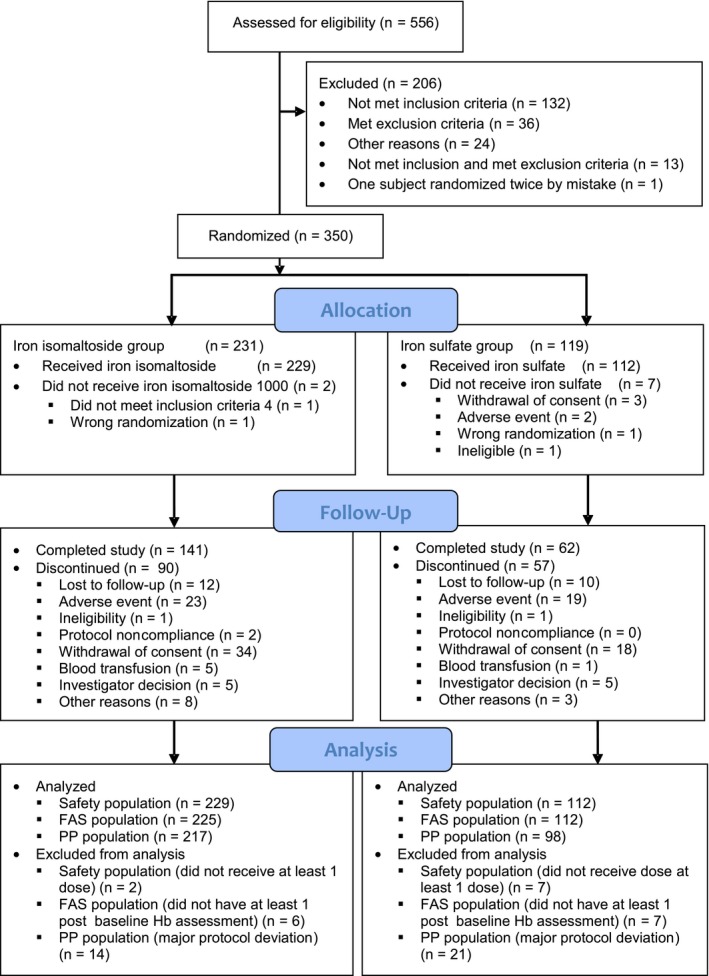
Schematic of the disposition of the study patients. FAS = full analysis set; Hb = hemoglobin; PP = per protocol.
The primary objective was to assess noninferiority, and the noninferiority margin was set as –0.5 g/dl. This margin was in line with previous trials and was regarded as clinically relevant. If the 95% confidence interval (CI) was entirely above 0, this was considered evidence of superiority in terms of statistical significance at the 5% level. The secondary objectives were to assess other relevant hematology variables, effect on QoL, and safety.
The primary efficacy data were tabulated using number, mean, standard deviation (SD), minimum, maximum, and 95% CI. A mixed analysis model for repeated measures was used to compare the average change in Hb level, serum iron level, serum ferritin level, TSAT, TIBC, and QoL score. All tests were two tailed, and the significance level was 0.05. Baseline characteristics and safety data were displayed descriptively.
Results
Patients
Of the 350 patients enrolled, 300 (86%) completed the first 4 weeks, 249 (71%) completed 12 weeks, and 203 (58%) completed the trial up to week 24. Figure 1 summarizes the details of patient disposition.
Patient demographics and baseline characteristics are summarized in Table 1. Baseline laboratory variables are shown in Table 2. Overall baseline characteristics were comparable between the treatment groups (Tables 1 and 2). In addition, area under the neutrophil time curve showed no significant differences in the degree of myelosuppression between the treatment groups (p>0.5, data not shown).
Table 1.
Baseline Demographic and Clinical Characteristics of the Randomized Population
| Characteristic | Iron isomaltoside group (n = 231) | Iron sulfate group (n = 119) | All patients (N = 350) |
|---|---|---|---|
| Age, yrs | |||
| Mean ± SD | 55 ± 12a | 54 ± 11 | 55 ± 11 |
| Median, range | 55 (21–87)a | 54 (23–80) | 55 (21–87) |
| Sex | |||
| Male | 80 (34.6) | 29 (24.4) | 109 (31.1) |
| Female | 151 (65.4) | 90 (75.6) | 241 (68.9) |
| Racial‐ethnic origin | |||
| White | 98 (42.4)a | 45 (37.8) | 143 (40.9) |
| Black | 0 (0) | 1 (0.8) | 1 (0.3) |
| Asian | 132 (57.1)a | 72 (60.5) | 204 (58.3) |
| Other | 0 (0) | 1 (0.8) | 1 (0.3) |
| Body mass index, kg/m2 | |||
| Mean ± SD | 23.2 ± 5.4a | 24.3 ± 6.1 | 23.6 ± 5.7 |
| Median, range | 22.7 (11.8–38.3)a | 23.1 (13.8–48.5) | 22.8 (11.8–48.5) |
| Prior therapy | |||
| Chemotherapy | 81 (35.1) | 42 (35.3) | 123 (35.1) |
| No. of courses given | |||
| > 5 | 60 (26.0) | 31 (26.1) | 91 (26.0) |
| 5–10 | 35 (15.2) | 16 (13.4) | 51 (14.6) |
| > 10 | 6 (2.6) | 4 (3.4) | 10 (2.9) |
| Previously received platinum‐based chemotherapy | 53 (22.9) | 29 (24.4) | 82 (23.4) |
| Radiotherapy | 11 (4.8) | 6 (5.0) | 17 (4.9) |
| Both chemotherapy and radiotherapy | 21 (9.1) | 9 (7.6) | 30 (8.6) |
| Therapy at screening | |||
| Chemotherapy | |||
| No. of cycles given | 230 (99.6) | 119 (100.0) | 349 (99.7) |
| > 5 | 196 (84.8) | 105 (88.2) | 301 (86.0) |
| 5–10 | 23 (10.0) | 9 (7.6) | 32 (9.1) |
| > 10 | 11 (4.8) | 5 (4.2) | 16 (4.6) |
| No. of cycles due | |||
| > 5 | 190 (82.3) | 105 (88.2) | 295 (84.3) |
| 5–10 | 29 (12.6) | 11 (9.2) | 40 (11.4) |
| > 10 | 11 (4.8) | 3 (2.5) | 14 (4.0) |
| Previously received platinum‐based chemotherapy | 26 (11.3) | 11 (9.2) | 37 (10.6) |
| TNM stageb | |||
| Localized | 22 (9.5) | 9 (7.6) | 31 (8.9) |
| Locally advanced | 48 (20.8) | 29 (24.4) | 77 (22.0) |
| Metastatic | 86 (37.2) | 53 (44.5) | 139 (39.7) |
| Not classifiable | 59 (25.5) | 24 (20.2) | 83 (23.7) |
Data are no. (%) of patients unless otherwise specified.
SD = standard deviation; TNM = cancer staging system by primary tumor (T), regional lymph nodes (N), and distant metastasis (M).
Data are for 230 patients in the iron isomaltoside group.
TNM classification: localized = T1/T2, NX/N0, and M0; locally advanced = (T3/T4 and NX/N0 and M0) or (N1 and M0); metastatic = M1.
Table 2.
Baseline Laboratory Test Results in the Full Analysis Set
| Laboratory variable | Statistical variable | Treatment groups | |||
|---|---|---|---|---|---|
| Iron isomaltoside infusion group (n = 109) | Iron isomaltoside bolus group (n = 116) | Iron isomaltoside group (n = 225) | Iron sulfate group (n = 112) | ||
| Hemoglobin, g/dl | Mean | 9.9 | 10.0 | 10.0 | 9.9 |
| SD | 1.3 | 1.3 | 1.3 | 1.3 | |
| Median | 10.0 | 10.0 | 10.0 | 9.9 | |
| Range | (6.5–13.7) | (6.4–13.1) | (6.4–13.7) | (6.3–12.4) | |
| Serum iron, μmol/La | Mean | 10.6 | 14.1 | 12.4 | 14.5 |
| SD | 8.7 | 14.4 | 12.1 | 11.9 | |
| Median | 7.7 | 9.0 | 8.6 | 10.7 | |
| Range | (1.8–51.7) | (2.0–76.1) | (1.8–76.1) | (1.8–60.1) | |
| Serum ferritin, μg/L | Mean | 254.2 | 222.0 | 237.6 | 247.4 |
| SD | 290.3 | 207.9 | 251.2 | 254.0 | |
| Median | 171.4 | 163.2 | 171.0 | 167.9 | |
| Rangea | (4.7–2313.0) | (3.2–939.3) | (3.2–2313.0) | (6.6–1258.0) | |
| Serum ferritin, no. of patients | < 30 μg/L | – | – | 30 | 15 |
| ≥ 30 μg/L | – | – | 195 | 97 | |
| Transferrin saturation, % | Mean | 18.7 | 22.8 | 20.8 | 23.9 |
| SD | 17.2 | 22.1 | 19.9 | 18.9 | |
| Median | 12.0 | 14.1 | 13.0 | 16.9 | |
| Rangea | (2.0–83.0) | (2.4–103.9) | (2.0–103.9) | (3.0–86.0) | |
| Transferrin saturation, no. of patients | < 20% | – | – | 150 | 78 |
| 20–50% | – | – | 75 | 33b | |
| Total iron‐binding capacity, μmol/L | Mean | 58.1 | 60.1 | 59.1 | 58.9 |
| SD | 13.5 | 14.6 | 14.1 | 13.3 | |
| Median | 55.3 | 57.8 | 56.9 | 57.8 | |
| Range | (35.1–91.8) | (27.0–98.3) | (27.0–98.3) | (30.6–104.4) | |
Conversion factor for serum iron: μmol/L/0.179 = μg/dl.
Some patients had baseline transferrin saturation (TSAT) and serum ferritin values that were increased above the inclusion screening values (TSAT less than 50% and ferritin less than 800 μg/L). All patients except one had a TSAT less than 50% and ferritin less than 800 μg/L at screening. This patient was excluded from the per protocol analysis set.
Exposure to Iron
The mean ± SD cumulative dose in the iron isomaltoside group was 849 ± 221 mg (range 500–2000 mg). A total of 112 patients were infused with iron isomaltoside at baseline (mean ± SD 833 ± 176 mg, range 500–1250 mg) and 11 patients were again infused at week 1 with an additional infusion of 250 mg (mean cumulative dose 857 ± 211 mg). A total of 117 patients were dosed with 500‐mg bolus injections of iron isomaltoside at baseline, 105 at week 1 (338 ± 120 mg, range 250–500 mg), 11 at week 2 (364 ± 131 mg, range 250–500 mg), and 1 with 500 mg again at week 4 (cumulative dose 842 ± 231 mg). In the oral iron group, 112 were dosed with iron sulfate 200 mg daily for 12 weeks (theoretically, up to 16,800 mg total if the patients adhered to treatment as prescribed during the 12‐week period). Actual mean cumulative dose in the oral iron group was 13,539 ± 5461 mg (range 800–20,000 mg). At every visit, the patients receiving oral iron sulfate were asked if they had followed the dosing schedule to check for compliance.
Efficacy Results
Change in Hemoglobin Concentration
The primary analysis (change in Hb level from baseline to week 4) was conducted on the FAS (337 patients) and PP analysis set (315 patients). The test for noninferiority showed that iron isomaltoside was noninferior to iron sulfate in its ability to increase Hb level from baseline to week 4 in both the FAS and PP data sets (FAS: difference estimate 0.016, 95% CI –0.26–0.29, p<0.001; PP: difference estimate –0.007, 95% CI –0.29 to 0.28, p<0.001) (Table 3). Similar results were observed when the iron isomaltoside subgroups were compared with the iron sulfate group in both FAS and PP data sets (Supplementary Tables S2 and S3). Iron isomaltoside did not show superiority over iron sulfate in terms of change in Hb concentration from baseline to week 4 in either the FAS or PP analysis sets (FAS: p=0.91; PP: p=0.96).
Table 3.
Changes in Hemoglobin and Iron Variables
| Laboratory variables, time point (no. of patients) | Iron isomaltoside (group A), least‐square mean estimatea | Iron sulfate (group B), least‐square mean estimatea | Difference estimates (95% CI) | p value |
|---|---|---|---|---|
| Hemoglobin, g/dl: full analysis set | ||||
| Week 1 (group A: 215, group B: 110) | 0.14 | −0.06 | 0.20 (−0.024–0.43) | 0.08 |
| Week 2 (group A: 210, group B: 100) | 0.34 | 0.19 | 0.15 (−0.10–0.40) | 0.24 |
| Week 4 (group A: 192, group B: 99) | 0.45 | 0.44 | 0.02 (−0.26–0.29) | < 0.001, 0.91b |
| Week 8 (group A: 181, group B: 84) | 0.74 | 0.71 | 0.03 (−0.33–0.38) | 0.88 |
| Week 12 (group A: 164, group B: 81) | 1.17 | 1.06 | 0.12 (−0.29–0.52) | 0.58 |
| Week 24 (group A: 157, group B: 72) | 1.58 | 1.64 | −0.05 (−0.60–0.49) | 0.85 |
| Hemoglobin, g/dl: per protocol analysis set | ||||
| Week 4 (group A: 184, group B: 89) | 0.46 | 0.47 | −0.007 (−0.29–0.28) | < 0.001, 0.96b |
| Serum iron, μg/dlc full analysis set | ||||
| Week 1 (group A: 216, group B: 109) | 21.5 | 2.92 | 18.6 (3.95–33.2) | 0.01 |
| Week 2 (group A: 210, group B: 100) | 12.3 | 12.3 | −0.008 (−16.3–16.2) | 0.99 |
| Week 4 (group A: 194, group B: 98) | 5.45 | 5.89 | −0.45 (−13.8–12.9) | 0.95 |
| Week 8 (group A: 182, group B: 84) | −4.26 | 1.67 | −5.93 (−19.3–7.46) | 0.38 |
| Week 12 (group A: 163, group B: 81) | −4.04 | 7.43 | −11.5 (−26.1–3.18) | 0.12 |
| Week 24 (group A: 156, group B: 72) | −6.97 | −4.89 | −2.08 (−16.1–11.9) | 0.77 |
| Serum ferritin, ng/ml: full analysis set | ||||
| Week 1 (group A: 216, group B: 109) | 513 | 78 | 435 (378–492) | < 0.001 |
| Week 2 (group A: 209, group B: 100) | 567 | 89 | 478 (374–582) | < 0.001 |
| Week 4 (group A: 193, group B: 98) | 445 | 121 | 324 (254–394) | < 0.001 |
| Week 8 (group A: 182, group B: 84) | 332 | 97 | 235 (175–295) | < 0.001 |
| Week 12 (group A: 164, group B: 81) | 262 | 83 | 179 (112–246) | < 0.001 |
| Week 24 (group A: 220, group B: 72) | 290 | 65 | 225 (103–347) | < 0.001 |
| Transferrin saturation, %: full analysis set | ||||
| Week 1 (group A: 216, group B: 109) | 6.83 | 0.69 | 6.14 (2.18–10.10) | 0.003 |
| Week 2 (group A: 210, group B: 100) | 4.92 | 3.12 | 1.79 (−2.95–6.54) | 0.46 |
| Week 4 (group A: 194, group B: 98) | 3.38 | 1.89 | 1.49 (−2.52–5.50) | 0.47 |
| Week 8 (group A: 182, group B: 84) | 0.45 | 0.60 | −0.16 (−4.24–3.92) | 0.94 |
| Week 12 (group A: 163, group B: 81) | −0.41 | 1.14 | −1.56 (−5.65–2.54) | 0.45 |
| Week 24 (group A: 155, group B: 72) | −1.65 | −2.43 | 0.77 (−3.75–5.30) | 0.74 |
| Total iron binding capacity, μmol/L: full analysis set | ||||
| Week 1 (group A: 216, group B: 109) | −3.90 | −1.34 | −2.57 (−4.25 to −0.88) | 0.003 |
| Week 2 (group A: 210, group B: 100) | −6.12 | −2.33 | −3.79 (−5.60 to −1.99) | < 0.001 |
| Week 4 (group A: 194, group B: 98) | −7.65 | −2.98 | −4.67 (−6.90 to −2.43) | < 0.001 |
| Week 8 (group A: 182, group B: 84) | −6.68 | −3.50 | −3.18 (−6.00 to −0.35) | 0.03 |
| Week 12 (group A:163, group B: 81) | −4.81 | −2.99 | −1.83 (−4.42–0.77) | 0.17 |
| Week 24 (group A: 155, group B: 72) | −3.76 | −0.52 | −3.24 (−6.33 to −0.16) | 0.04 |
CI = confidence interval.
Least‐square means from the repeated measures model with the inclusion of treatment, visit, treatment × visit interactions, platinum‐based chemotherapy (yes/no), and country as factors and baseline hemoglobin level as the covariate.
The first p value represents the noninferiority test, and the second p value represents the superiority test.
Conversion factor for serum iron: μmol/L/0.179 = μg/dl.
Hb concentration increased significantly from baseline in both treatment groups; no statistically significant difference in Hb concentration was observed between the groups from baseline to weeks 1, 2, 8, 12, and 24 (Table 3, Figure 2). Similar results were observed when the iron isomaltoside subgroups were compared with the oral iron group, except at week 1 where the difference in Hb concentration from baseline was significantly higher in the iron isomaltoside infusion group compared with the oral iron group (p=0.03) (Supplementary Tables S2 and S3). No significant differences in C‐reactive protein or albumin levels were noted between the treatment groups (data not shown).
Figure 2.

Hemoglobin level, serum ferritin level, transferrin saturation, and total iron‐binding capacity over time by treatment group. Data are least‐square means (95% confidence interval [CI]) from a repeated measures analysis with strata and country as factors, treatment × week interaction, and baseline value as the covariate. The change from baseline within the treatment group is statistically significant different from 0 if the 95% CI does not include 0. *p<0.05; **p=0.001–0.01, ***p<0.001 for the comparison of iron isomaltoside versus iron sulfate.
Change in Serum Iron, Serum Ferritin, Transferrin Saturation, and Total Iron‐Binding Capacity
These secondary outcomes were conducted on the FAS population (337 patients). The estimated effect size for the laboratory variables, including precision, are shown for the iron isomaltoside group compared with the oral iron group in Table 3 (the iron isomaltoside subgroups compared with the oral iron group are shown in Tables S2 and S3). A statistically significant greater increase was observed in serum iron level at week 1 (p=0.013), serum ferritin level at weeks 1, 2, 4, 8, 12, and 24 (p<0.001 at all time points), and TSAT at week 1 (p=0.003), and a statistically significant greater decrease in TIBC was noted at weeks 1, 2, 4, 8, and 24 (week 1: p=0.003; week 2: p<0.001; week 4: p<0.001; week 8: p=0.028; week 24: p=0.040) in the iron isomaltoside group compared with the oral iron group (Table 3 and Figure 2). Similar results were observed for all iron variables when the iron isomaltoside infusion and bolus subgroups were compared with the oral iron group (Supplementary Tables S2 and S3).
Patients with TSAT less than 20% had a significantly better Hb response from weeks 4–12 compared with those with TSAT more than 20–50% (Figure 3). Patients with serum ferritin levels lower than 30 μg/L had a significantly better and faster Hb response than those with levels of 30 μg/L or higher, and the same was true for those with serum ferritin levels lower than 100 μg/L versus those with levels of 100 μg/L or higher. Comparing 30‐μg/L and 100‐μg/L cut‐offs shows that the difference was greater and achieved earlier with the lower cut‐off (Figure 4).
Figure 3.

Change in hemoglobin concentration by transferrin saturation subgroups (more than 20% vs 20–50%). Data are estimates (mean and 95% confidence interval) from a mixed model with repeated measures with week and strata as factors and baseline value as the covariate. BL = baseline.
Figure 4.
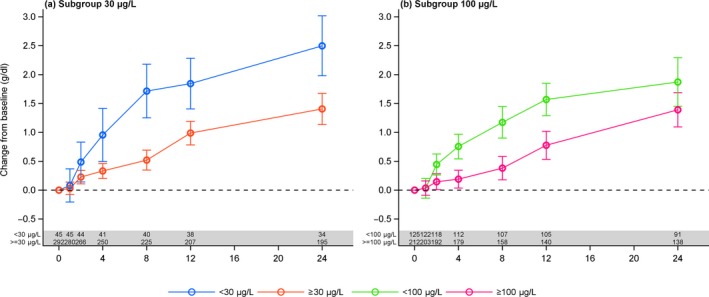
Change in hemoglobin concentration by the two serum ferritin level subgroups (lower than 30 vs 30 μg/L or higher and lower than 100 vs 100 μg/L or higher). Data are estimates (mean and 95% confidence interval) from a mixed model with repeated measures with week, strata, and country as factors and baseline value as the covariate.
Change in Quality of Life
The change in QoL was assessed in the FAS (337 patients). A statistically significant mean decrease in FACT fatigue score was observed, indicating less fatigue from baseline to week 4 in the iron isomaltoside infusion group (p=0.027) but not in the bolus injection group (p=0.61) or oral iron group (p=0.24). A statistically significant mean decrease in FACT fatigue score was observed from baseline to week 12 in the iron isomaltoside group (p<0.001) but not in the oral iron group (p=0.057), indicating less fatigue in the iron isomaltoside group at week 12. Similar results were observed in the iron isomaltoside subgroups at week 12 (p=0.002). No statistically significant difference was noted between the treatment groups in overall QoL from baseline at weeks 4 and 12 (week 4: p=0.92; week 12: p=0.25) (Table S4).
Safety
Safety outcomes were conducted on the safety analysis set (341 patients). A statistically significant lower proportion of patients in the iron isomaltoside group had an ADR (i.e., treatment‐related adverse event) compared with those in the oral iron group (15/229 [6.6%] vs 21/112 [18.8%], p<0.001). One patient in the iron isomaltoside group had a treatment‐related serious adverse reaction (transient nausea, back pain, persistent palpitations, and flushed face during drug administration). No serious adverse reactions were reported in the oral iron group.
No statistically significant difference in the proportion of patients experiencing an adverse event was noted between the treatment groups (72% [165/229] in the iron isomaltoside group vs 70% [78/112] in the oral iron group) (Table 4). In relation to severity, causality, and outcome, adverse events were comparable between the groups, and most of the adverse events were mild or moderate and unrelated to the trial drug. A statistically significantly higher proportion of patients in the oral iron group discontinued the trial due to intolerance of the trial drug compared with the iron isomaltoside group (8.0% [9/112] vs 0.9% [2/229], p=0.001).
Table 4.
Summary of Adverse Events for the Iron Isomaltoside (Infusion and Bolus) and Iron Sulfate, Safety Population
| Type of adverse event | Iron isomaltoside infusion group (n = 112) | Iron isomaltoside bolus group (n = 117) | Iron sulfate group (n = 112) |
|---|---|---|---|
| Adverse events | 82 (73.2) | 83 (70.9) | 78 (69.6) |
| Adverse drug reaction | 6 (5.4) | 9 (7.7) | 21 (18.8) |
| Serious adverse events | 15 (13.4) | 17 (14.5) | 18 (16.1) |
| Serious adverse drug reaction | 1 (0.9) | – | – |
| Suspected unexpected serious adverse reaction | – | – | – |
| Withdrawals due to adverse events | 11 (9.8) | 12 (10.3) | 17 (15.2) |
Data are no. (%) of patients.
A total of 11/229 patients (4.8%) in the iron isomaltoside group and 10/112 patients (8.9%) in the oral iron group had a fatal event during the trial. None of the fatal events, however, were related to the trial drug.
Transient hypophosphatemia (phosphate level lower than 2 mg/dl) was reported in 24 patients, at similar low frequencies among the groups: 7.1% (8/112) in the iron isomaltoside infusion group versus 8.5% (10/117) in the iron isomaltoside bolus injection group versus 5.4% (6/112) in the oral iron group. None of the transient hypophosphatemic events were reported as adverse events.
Discussion
Several clinical trials have demonstrated that IV iron supplementation enhances Hb response to ESA treatment and is superior to oral iron in doing so.18, 19, 20, 21, 22, 23 However, recent evidence reports that ESA treatment may cause increased mortality and worsened overall survival.24, 25 Clinical trials investigating IV iron alone without ESA supplementation in patients with cancer and anemia are warranted. Three small prospective trials using IV iron without ESA in anemic patients with cancer have been published. Two trials compared IV iron with no treatment,26, 27 and another compared IV iron with oral iron.28 In a trial comparing IV iron with no treatment of functional iron deficiency anemia in patients with lymphoid malignancies, a significant difference was shown in Hb response between the groups in spite of the small number of patients.26 One group reported a significant reduction in the proportion of patients receiving blood transfusions in the IV iron group compared with the no‐treatment group,27 and similar findings were reported by others comparing IV iron with oral iron.28 A recent prospective observational study enrolled patients with cancer and anemia who had absolute or functional iron deficiency and were receiving either IV iron without ESA or ESA and IV iron. Patients with baseline Hb levels up to 11 g/dl and serum ferritin levels up to 500 ng/ml as well as patients with serum ferritin levels higher than 500 ng/ml and low TSAT benefited from IV iron alone.29 At the annual meeting of the American Society of Hematology in 2014, a group of authors presented the results of a retrospective single‐center study derived from a pharmacy database, and they concluded that IV iron, either alone or combined with ESA, was well tolerated in an advanced cancer cohort and that the two treatments both increased Hb level at 1 month, with no significant difference found between treatments.30 To our knowledge, no previous trial has shown oral iron alone to be effective in the treatment of cancer‐related anemia except in patients with proven absolute iron deficiency.
The objective of our trial was to evaluate the efficacy and safety of IV iron isomaltoside compared with oral iron sulfate in patients with cancer and anemia who were not receiving ESA therapy by testing the noninferiority of IV versus oral iron.
Patients with a serum ferritin level up to 800 ng/ml and a TSAT up to 50% were included to compare IV iron with oral iron treatment in patients with cancer‐related anemia even without biochemical signs of iron‐restricted erythropoiesis. Only patients with high serum ferritin and TSAT levels were excluded (28 patients were excluded due to high serum ferritin levels, 63 due to high TSAT levels, and 9 due to both high serum ferritin and TSAT levels). The cumulative dose was 849 ± 221 mg in the iron isomaltoside group and 13,539 ± 5,461 mg in the oral iron group.
IV iron isomaltoside was noninferior to oral iron sulfate in increasing Hb level from baseline to week 4. The primary end point was met. An increase in Hb level over time was observed in both treatment groups, but a faster onset of the Hb response was observed with IV iron isomaltoside infusion compared with oral iron. A serum ferritin level lower than 30 μg/L and lower than 100 μg/L were tested as cut‐offs for true iron deficiency. Patients with serum ferritin levels lower than 30 μg/L had a greater response in Hb compared with those with levels higher than 30 μg/L. This was also true for the cut‐off of 100 μg/L, but serum ferritin levels lower than 30 μg/L indicated earlier and better Hb response. Therefore, a cut‐off of 30 μg/L seems more correct than 100 μg/L as an indicator of iron deficiency in these patients with cancer.
A statistically significant higher increase in serum ferritin level and decrease in TIBC was noted from baseline to week 24 in the iron isomaltoside group compared with the oral iron group. These results signify a faster repletion of body iron stores with administration of iron isomaltoside than with oral iron sulfate, consistent with previously published evidence.31 Although no statistically significant difference in QoL by testing noninferiority of IV versus oral iron from baseline to week 4 and week 12 was observed using the FACT score, there was a statistically significant mean decrease in the FACT fatigue score, indicating less fatigue from baseline to week 12 with iron isomaltoside.
Ideally, a placebo arm should have been included to account for the possible effects of the cancer and chemotherapy per se on the Hb response; however, because patients with absolute iron deficiency were also included in the trial, a placebo arm would have been imprudent.
The lack of superiority of IV iron on the Hb response over oral iron may be due to underdosing of IV iron isomaltoside compared with 12 weeks of oral iron (total of 16,800 mg of elemental iron). The duration of oral iron treatment was longer, and the total administered dose was higher compared with oral treatment regimens applied in several other IV versus oral iron trials, making it difficult to compare efficacy across trials and populations.31, 32 The response in Hb level to oral iron in this setting is a new finding. A Hb increase due to improved tumor status in the oral iron group may be suspected; however, C‐reactive protein and albumin values indicated no significant difference in tumor status between the groups.
Iron isomaltoside was better tolerated than oral iron. A statistically significant higher proportion of patients in the oral iron group discontinued the trial due to intolerance of trial drug (8.0% vs 0.9%). The results agreed with the previously published evidence reporting a significantly higher percentage of patients discontinuing treatment due to gastrointestinal disturbances with oral iron (11%).33 A statistically significant lower proportion of patients in the IV iron isomaltoside group reported ADRs compared with the oral iron group (6.6% vs 18.8%), and only one serious adverse reaction (0.4% [1/229]) was reported in the IV iron group. These findings were observed despite the exclusion of patients with known intolerance to oral iron. Oral iron in sufficient dosage may be efficient, but tolerability limits long‐term use.
Conclusion
This trial demonstrated that iron isomaltoside and oral iron increased Hb concentration. Iron isomaltoside in a cumulative dose of 849 ± 221 mg was found to be noninferior in its ability to increase Hb concentration from baseline compared with a cumulative dose of 13,539 ± 5461 mg of oral iron. A comparable sustained increase in Hb concentration over time was observed with both iron isomaltoside and oral iron, and fatigue was significantly decreased with iron isomaltoside. Iron isomaltoside was better tolerated than oral iron. Iron isomaltoside is a safe and effective alternative to oral iron in patients receiving cancer chemotherapy who have anemia.
Supporting information
Table S1. Inclusion and exclusion criteria.
Table S2. Change in hemoglobin and iron variables, iron isomaltoside infusion group versus oral iron group.
Table S3. Change in hemoglobin and iron variables, iron isomaltoside bolus injection group versus oral iron group.
Table S4. Quality of life measured by the FACIT‐Fatigue Scale: full analysis set.
Acknowledgments
The authors would like to thank all the investigators and trial personnel for their contributions to the trial: Jens‐Kristian Slott Jensen, Slott Stat, for statistical support, and Eva‐Maria Damsgaard Nielsen (employed at Pharmacosmos A/S) for her medical writing and editorial assistance to the authors’ original manuscript.
This trial was funded by Pharmacosmos A/S.
The results of this trial were presented at the Multinational Association of Supportive Care in Cancer Annual Meeting, June 25–27, 2015, Copenhagen, Denmark.
ClinicalTrials.gov identifier: NCT01145638.
References
- 1. Groopman JE, Itri LM. Chemotherapy‐induced anemia in adults: Incidence and treatment. J Natl Cancer Inst 1999;91:1616–34. [DOI] [PubMed] [Google Scholar]
- 2. Steinmetz HT. The role of intravenous iron in the treatment of anemia in cancer patients. Ther Adv Hematol 2012;3:177–91. [DOI] [PMC free article] [PubMed] [Google Scholar]
- 3. Ludwig H, Van BS, Barrett‐Lee P, et al. The European Cancer Anaemia Survey (ECAS): a large, multinational, prospective survey defining the prevalence, incidence, and treatment of anaemia in cancer patients. Eur J Cancer 2004;40:2293–306. [DOI] [PubMed] [Google Scholar]
- 4. Henry DH. The role of intravenous iron in cancer‐related anemia. Oncology (Williston Park) 2006;20(8 Suppl 6):21–4. [PubMed] [Google Scholar]
- 5. Khorana AA, Francis CW, Blumberg N, Culakova E, Refaai MA, Lyman GH. Blood transfusions, thrombosis, and mortality in hospitalized patients with cancer. Arch Intern Med 2008;168:2377–81. [DOI] [PMC free article] [PubMed] [Google Scholar]
- 6. Pirker R, Ramlau RA, Schuette W, et al. Safety and efficacy of darbepoetin alpha in previously untreated extensive‐stage small‐cell lung cancer treated with platinum plus etoposide. J Clin Oncol 2008;26:2342–9. [DOI] [PubMed] [Google Scholar]
- 7. Lichtin AE. Clinical practice guidelines for the use of erythroid‐stimulating agents: ASCO, EORTC, NCCN. Cancer Treat Res 2011;157:239–48. [DOI] [PubMed] [Google Scholar]
- 8. Jahn MR, Andreasen HB, Futterer S, et al. A comparative study of the physicochemical properties of iron isomaltoside 1000 (Monofer), a new intravenous iron preparation and its clinical implications. Eur J Pharm Biopharm 2011;78:480–91. [DOI] [PubMed] [Google Scholar]
- 9. Bhandari S, Kalra PA, Kothari J, et al. A randomized, open‐label trial of iron isomaltoside 1000 (Monofer) compared with iron sucrose (Venofer) as maintenance therapy in haemodialysis patients. Nephrol Dial Transplant 2015;30:1577–89. [DOI] [PMC free article] [PubMed] [Google Scholar]
- 10. Hildebrandt PR, Bruun NE, Nielsen OW, et al. Effects of administration of iron isomaltoside 1000 in patients with chronic heart failure. A pilot study. Transfus Altern Transfus Med 2010;11:131–7. [Google Scholar]
- 11. Johansson PI, Rasmussen AS, Thomsen LL. Intravenous iron isomaltoside 1000 (Monofer) reduces postoperative anaemia in preoperatively non‐anaemic patients undergoing elective or sub‐acute coronary artery bypass graft, valve replacement, or a combination thereof: A randomized double‐blind placebo‐controlled clinical trial (the PROTECT trial). Vox Sang 2015;109:257–66. [DOI] [PMC free article] [PubMed] [Google Scholar]
- 12. Kalra PA, Bhandari S, Saxena S, et al. A randomized trial of iron isomaltoside 1000 versus oral iron in non‐dialysis‐dependent chronic kidney disease patients with anaemia. Nephrol Dial Transplant 2015. doi: 10.1093/ndt/gfv293. [DOI] [PMC free article] [PubMed] [Google Scholar]
- 13. Reinisch W, Staun M, Tandon RK, et al. A randomized, open‐label, non‐inferiority study of intravenous iron isomaltoside 1,000 (Monofer) compared with oral iron for treatment of anemia in IBD (PROCEED). Am J Gastroenterol 2013;108:1877–88. [DOI] [PMC free article] [PubMed] [Google Scholar]
- 14. Reinisch W, Altorjay I, Zsigmond F, et al. A 1‐year trial of repeated high‐dose intravenous iron isomaltoside 1000 to maintain stable hemoglobin levels in inflammatory bowel disease. Scand J Gastroenterol 2015;50:1226–33. [DOI] [PMC free article] [PubMed] [Google Scholar]
- 15. Wikstrom B, Bhandari S, Barany P, et al. Iron isomaltoside 1000: a new intravenous iron for treating iron deficiency in chronic kidney disease. J Nephrol 2011;24:589–96. [DOI] [PubMed] [Google Scholar]
- 16. Ganzoni AM. Intravenous iron‐dextran: therapeutic and experimental possibilities. Schweiz Med Wochenschr 1970;100:301–3. [PubMed] [Google Scholar]
- 17. Yellen SB, Cella DF, Webster K, Blendowski C, Kaplan E. Measuring fatigue and other anemia‐related symptoms with the Functional Assessment of Cancer Therapy (FACT) measurement system. J Pain Symptom Manage 1997;13:63–74. [DOI] [PubMed] [Google Scholar]
- 18. Auerbach M, Ballard H, Trout JR, et al. Intravenous iron optimizes the response to recombinant human erythropoietin in cancer patients with chemotherapy‐related anemia: a multicenter, open‐label, randomized trial. J Clin Oncol 2004;22:1301–7. [DOI] [PubMed] [Google Scholar]
- 19. Auerbach M, Silberstein PT, Webb RT, et al. Darbepoetin alfa 300 or 500 mug once every 3 weeks with or without intravenous iron in patients with chemotherapy‐induced anemia. Am J Hematol 2010;85:655–63. [DOI] [PubMed] [Google Scholar]
- 20. Henry DH, Dahl NV, Auerbach M, Tchekmedyian S, Laufman LR. Intravenous ferric gluconate significantly improves response to epoetin alfa versus oral iron or no iron in anemic patients with cancer receiving chemotherapy. Oncologist 2007;12:231–42. [DOI] [PubMed] [Google Scholar]
- 21. Pedrazzoli P, Farris A, Del PS, et al. Randomized trial of intravenous iron supplementation in patients with chemotherapy‐related anemia without iron deficiency treated with darbepoetin alpha. J Clin Oncol 2008;26:1619–25. [DOI] [PubMed] [Google Scholar]
- 22. Bastit L, Vandebroek A, Altintas S, et al. Randomized, multicenter, controlled trial comparing the efficacy and safety of darbepoetin alpha administered every 3 weeks with or without intravenous iron in patients with chemotherapy‐induced anemia. J Clin Oncol 2008;26:1611–8. [DOI] [PubMed] [Google Scholar]
- 23. Hedenus M, Birgegard G, Nasman P, et al. Addition of intravenous iron to epoetin beta increases hemoglobin response and decreases epoetin dose requirement in anemic patients with lymphoproliferative malignancies: a randomized multicenter study. Leukemia 2007;21:627–32. [DOI] [PubMed] [Google Scholar]
- 24. Bohlius J, Schmidlin K, Brillant C, et al. Recombinant human erythropoiesis‐stimulating agents and mortality in patients with cancer: a meta‐analysis of randomised trials. Lancet 2009;373:1532–42. [DOI] [PubMed] [Google Scholar]
- 25. Bohlius J, Schmidlin K, Brillant C, et al. Erythropoietin or Darbepoetin for patients with cancer‐meta‐analysis based on individual patient data. Cochrane Database Syst Rev 2009;3:CD007303. [DOI] [PMC free article] [PubMed] [Google Scholar]
- 26. Hedenus M, Karlsson T, Ludwig H, et al. Intravenous iron alone resolves anemia in patients with functional iron deficiency and lymphoid malignancies undergoing chemotherapy. Med Oncol 2014;31:302. [DOI] [PMC free article] [PubMed] [Google Scholar]
- 27. Kim YT, Kim SW, Yoon BS, et al. Effect of intravenously administered iron sucrose on the prevention of anemia in the cervical cancer patients treated with concurrent chemoradiotherapy. Gynecol Oncol 2007;105:199–204. [DOI] [PubMed] [Google Scholar]
- 28. Dangsuwan P, Manchana T. Blood transfusion reduction with intravenous iron in gynecologic cancer patients receiving chemotherapy. Gynecol Oncol 2010;116:522–5. [DOI] [PubMed] [Google Scholar]
- 29. Steinmetz T, Tschechne B, Harlin O, et al. Clinical experience with ferric carboxymaltose in the treatment of cancer‐ and chemotherapy‐associated anaemia. Ann Oncol 2013;24:475–82. [DOI] [PMC free article] [PubMed] [Google Scholar]
- 30. Blanc C, Dujaric ME, Giard C, et al. Ferric carboxymaltose alone or combined with erythropoietin allows a modest increase in hemoglobin for the treatment of cancer‐related anemia in advanced cancer patients. Blood 2014;124:4884. [Google Scholar]
- 31. Qunibi WY, Martinez C, Smith M, Benjamin J, Mangione A, Roger SD. A randomized controlled trial comparing intravenous ferric carboxymaltose with oral iron for treatment of iron deficiency anaemia of non‐dialysis‐dependent chronic kidney disease patients. Nephrol Dial Transplant 2011;26:1599–607. [DOI] [PMC free article] [PubMed] [Google Scholar]
- 32. Van Wyck DB, Mangione A, Morrison J, Hadley PE, Jehle JA, Goodnough LT. Large‐dose intravenous ferric carboxymaltose injection for iron deficiency anemia in heavy uterine bleeding: a randomized, controlled trial. Transfusion 2009;49:2719–28. [DOI] [PubMed] [Google Scholar]
- 33. Johnson DW, Herzig KA, Gissane R, Campbell SB, Hawley CM, Isbel NM. A prospective crossover trial comparing intermittent intravenous and continuous oral iron supplements in peritoneal dialysis patients. Nephrol Dial Transplant 2001;16:1879–84. [DOI] [PubMed] [Google Scholar]
Associated Data
This section collects any data citations, data availability statements, or supplementary materials included in this article.
Supplementary Materials
Table S1. Inclusion and exclusion criteria.
Table S2. Change in hemoglobin and iron variables, iron isomaltoside infusion group versus oral iron group.
Table S3. Change in hemoglobin and iron variables, iron isomaltoside bolus injection group versus oral iron group.
Table S4. Quality of life measured by the FACIT‐Fatigue Scale: full analysis set.