

ABSTRACT
The unicellular green alga Haematococcus pluvialis has been exploited as a cell factory to produce the high‐value antioxidant astaxanthin for over two decades, due to its superior ability to synthesize astaxanthin under adverse culture conditions. However, slow vegetative growth under favorable culture conditions and cell deterioration or death under stress conditions (e.g., high light, nitrogen starvation) has limited the astaxanthin production. In this study, a new paradigm that integrated heterotrophic cultivation, acclimation of heterotrophically grown cells to specific light/nutrient regimes, followed by induction of astaxanthin accumulation under photoautotrophic conditions was developed. First, the environmental conditions such as pH, carbon source, nitrogen regime, and light intensity, were optimized to induce astaxanthin accumulation in the dark‐grown cells. Although moderate astaxanthin content (e.g., 1% of dry weight) and astaxanthin productivity (2.5 mg L−1 day−1) were obtained under the optimized conditions, a considerable number of cells died off when subjected to stress for astaxanthin induction. To minimize the susceptibility of dark‐grown cells to light stress, the algal cells were acclimated, prior to light induction of astaxanthin biosynthesis, under moderate illumination in the presence of nitrogen. Introduction of this strategy significantly reduced the cell mortality rate under high‐light and resulted in increased cellular astaxanthin content and astaxanthin productivity. The productivity of astaxanthin was further improved to 10.5 mg L−1 day−1 by implementation of such a strategy in a bubbling column photobioreactor. Biochemical and physiological analyses suggested that rebuilding of photosynthetic apparatus including D1 protein and PsbO, and recovery of PSII activities, are essential for acclimation of dark‐grown cells under photo‐induction conditions. Biotechnol. Bioeng. 2016;113: 2088–2099. © 2016 The Authors. Biotechnology and Bioengineering Published by Wiley Periodicals, Inc.
Keywords: astaxanthin, Haematococcus pluvialis, heterotrophy, acclimation
Introduction
Astaxanthin (3, 3′‐dihydroxy‐β‐β‐carotene‐4,4′‐dione), is a red ketocarotenoid used widely in aquaculture, pharmaceutical, nutraceutical, and cosmetic industries (Guerin et al., 2003; Lorenz and Cysewski, 2000; Olaizola, 2003), due to its superior antioxidant capacity, which is 38‐fold higher than that of β‐carotene and 500‐fold higher than vitamin E (Shimidzu et al., 1996). Astaxanthin can be obtained from natural sources like microalgae, yeast and crustacean byproducts, or chemically synthesized; however, the synthesized astaxanthin is different from the natural form in structural isomerism and bioactivity. Synthetic astaxanthin contains a mixture of three stereoisomers associated with two chiral centers, that is (3R,3′R), (3R,3′S) (meso), and (3S,3′S), in approximately 1:2:1 proportions. The natural astaxanthin is mainly in the form of (3S,3′S), which exhibited higher bioactivity as compared to the synthesized astaxanthin (Guerin et al., 2003; Higuera‐Ciapara et al., 2006; Yuan and Chen, 1997). Therefore, there has been growing interest in application of the natural astaxanthin as colorant and supplements for food and feed additives.
Haematococcus pluvialis, a freshwater unicellular alga, has been reported to accumulate the astaxanthin to as high as 4% of dry weight, which is the highest level among all known astaxanthin‐producing organisms, and thus has been recognized as a promising cell factory to produce natural astaxanthin (Lorenz and Cysewski, 2000).
H. pluvialis cells are green and vegetative under favorable environmental conditions (i.e., low light and replete nutrients), and once subjected to stress conditions like high light, cells begin to synthesize and accumulate astaxanthin, transforming green vegetative stage to red aplanospores. As such, a two‐stage cultivation mode is widely adopted for H. pluvialis mass culture, that is, producing green biomass under favorable conditions and inducing astaxanthin accumulation under stress (Aflalo et al., 2007; Fábregas et al., 2001). The limiting step of this culture mode is the supply of green biomass for astaxanthin production. In order to supply greater amounts of green vegetative cells, an approach of heterotrophic cultivation of this algae was explored (Chen et al., 1997; Kobayashi et al., 1992, 1997; Moya et al., 1997; Tripathi et al., 1999). Growing fermentable algae in fermenters, offers some advantages for biomass production, including better control of culture conditions and prevention of the culture from microbial contamination (Hata et al., 2001; Wan et al., 2015). It is noteworthy that astaxanthin accumulation is negligible under heterotrophic conditions, so the algal cells need to be subsequently induced under stress conditions such as high light intensity and/or nitrate deprivation (Imamoglu et al., 2009; Sarada et al., 2002). However, the primary challenges with this approach are the susceptibility of dark‐grown cells to strong light, which may lead to cell deterioration or death caused by photoinhibition or photooxidation (Hata et al., 2001). Indeed, dark‐grown H. pluvialias cells with a considerably lower chlorophyll content, indicative of weakened cellular photosynthetic machinery, were not capable of dealing with excess light (Fan et al., 2012; Ogbonna et al., 1997).
Based on the prior knowledge and our own experience, we hypothesized that after fermentation, incompetent photosynthetic machinery in the algal cells can be recovered by acclimating the cells to defined light and nitrogen regimes for a period of time, which are known to play a trigger role in the greening process for dark‐grown plant cells (Armstrong et al., 1995; Horton and Black, 1981; Suzuki and Bauer, 1995). To test the hypothesis, we conducted a series of experiments aiming at bridging heterotrophic cultivation and photo‐induction whereby introducing a process acclimating algal cells to various light and nitrogen regimes. We demonstrated that the optimized light and nitrogen regimes enabled dark‐grown H. pluvialis cells to rapidly rebuild competent photosynthetic machinery to better utilize strong light for astaxanthin production with minimum ill‐effect. As a result, a new culture mode was developed for mass culture of H. pluvialis for enhanced astaxanthin production.
Materials and Methods
Algal Strain and Medium Composition
H. pluvialis Flotow NIES‐144 was obtained from the National Institute for Environmental Studies (NIES, Tsukuba, Japan) and grown in the C medium that consisted of 1.6 g L−1 sodium acetate (Hata et al., 2001). The growth medium was adjusted to pH 7.5 with 3N hydrochloric acid prior to autoclaving at 121°C for 15 min.
Growth Conditions
H. pluvialis seeds cells were grown in 250 mL Erlenmeyer flasks each containing 100 mL C medium with an inoculum density of 4 × 10⁴ cells mL−1. The light intensity was 10 μmol m−2 s−1, and the culture temperature was 25°C. For heterotrophic cultivation, 100 mL of 4‐day culture was inoculated into a 2.8 L flask containing 1 L C medium and grown in dark for 10 days. After that, the algal suspensions were centrifuged at 3,000g for 10 min and re‐suspended into the fresh growth medium for light‐acclimation or high‐light induction experiments. To optimize the conditions for astaxanthin induction, four types of culture media with different C and N regimes, including C medium with 20 mM sodium acetate and 2 mM nitrate (+NaAc+N), N‐free C medium (+NaAc‐N), C medium with 40 mM sodium carbonate and 2 mM nitrate (+Na2CO3+N), and N‐free C medium with sodium carbonate (+Na2CO3−N) were compared. For light‐acclimation, the heterotrophically growing cells were transferred into the nitrogen (N)‐replete (2 mM) or N‐depleted C medium and exposed to different light intensities (25, 50, 100 µmol m−2 s−1). After 1‐day acclimation, the acclimated cells were directly subjected to high‐light conditions (400 µmol m−2 s−1) for astaxanthin induction. Forty millimolar HEPES was added to maintain pH at 7.0 ± 0.5 during the entire cultivation period. To test the productivity of astaxanthin in photobioreactor under photoautotrophic conditions, the cells were inoculated into a 1 L column photobioreactor (i.d. 50 mm) with 800 mL growth medium mixed with compressed air containing 1.5% (w/w) CO2 at a rate of 0.5 vvm. Cell growth was monitored by measuring optical density at 750 nm with a UV‐vis spectrophotometer (SPECTRAmax 340PC, Sunnyvale, CA.), and by counting cell numbers with a haemacytometer (Hausser Scientific, Horsham, PA). For the dry cell weight analysis, the culture liquor was filtered onto a fiberglass filter (Whatman International Ltd., Maidstone, UK) and dried at 80°C for 24 h.
Western Blot
Fresh algal cells were collected by centrifugation at 3,000g for 10 min. The supernatant were discarded and the cell pellets were suspended with Tris‐buffered saline solution (TBS, 50 mM Tris‐HCl, pH 7.4, 150 mM NaCl, pH 7.5). The extraction, seperation, and immunoblot analysis of membrane proteins (PsbA, PsbO, PetC) were performed as illustrated previously (Wang et al., 2014). The concentration of total membrane proteins in the supernatant was measured with a CB‐X protein assay kit (G‐Biosciences, St. Louis, MO). Samples with 10 μg protein (Protein Assay Kit; BioRad Laboratories, Hercules, CA) were separated on 6% Tris–glycine PAGE (Novex gels from Invitrogen, Waltham, MA), and then were transferred to nitrocellulose membranes (BioRad Laboratories). The membranes were blocked for 2 h in the TBS solution with 5% (w/v) fat‐free milk powder and then incubated in the primary antibody solution containing the antiserum of PsbA, PsbO, and PetC (rabbit polyclonal serum, Agrisera, Sweden) at the dilution rates of 1:1000, 1:500, 1:500, respectively. After overnight incubation at 4°C, the blots were washed in TBS with 0.1% (v/v) Tween 20, and then were incubated for 2 h with the horseradish peroxidase‐conjugated antibody against rabbit immunoglobulin G (BioRad) at a dilution of 1:1000. Antigen‐antibody complexes were visualized using an enhanced chemiluminescence substrate detection kit (Thermo Fisher Scientific, Waltham, MA).
Chlorophyll Fluorescence
Photosynthetic activities were measured by using a pulse amplitude modulated (PAM) fluorometer (Dual‐PAM 100, Walz, Effeltrich, Germany). Algal cells were dark‐adapted for 15 min to measure the minimum fluorescence (F0). After recording the signal for 5–10 s, a saturated pulse light (10,000 µmol photons m−2 s−1, lasting for 0.8 s) was applied to fully close the PSII reaction centers for the measurement of the maximum fluorescence Fm (Genty et al., 1989). Saturating flashes at intervals of 35 s were applied under different actinic light intensities (30–849 µmol m−2 s−1). From the saturation pulse analysis, the maximum fluorescence in the light (Fm′) and steady‐state value of fluorescence (F) were recorded. The maximum photochemical efficiency of PSII (Fv/Fm) was calculated as (Fm − F0)/Fm. The quantum yield of PSII (Y(II)) and nonphotochemical quenching (NPQ) were calculated as follows: Y(II) = (Fm′ − F0)/Fm′, NPQ = (Fm − Fm′)/Fm′ (Maxwell and Johnson, 2000).
Pigment Analysis
Astaxanthin contents were analyzed by using high performance liquid chromatography (Waters, Milford, MA) according to the method described previously (Yuan et al., 2002). The chlorophyll content was measured with a spectrophotometric method (Wellburn, 1994).
Statistical Analysis
Student's test was used to compare different treatments and if the test gives P‐value ≤0.05, the differences were interpreted as being significant. Quantitative analysis of astaxanthin content and cellular growth (O.D., cell number and dry weight) were obtained from triplicate experiments (n = 3).
Results
Optimization of the Photo‐Induction Conditions for the Heterotrophically Grown Cells
When the heterotrophically cultured cells were subjected to the induction conditions, the algae cells were rapidly bleached and died off within 1–2 days. Meanwhile, the pH of the cell culture exceeded 10.5 in 1 day (Fig. 1A and B). To eliminate the deleterious effect of high pH on the algal culture, three types of buffers including HEPES, Tris‐HCl and Tricine are selected to control the pH of cell culture. The results showed that the pH can be maintained in the range of 7–8 by adding 40–80 mM HEPES (Fig. 1A). With the addition of 20 and 40 mM HEPES, the cell numbers of the algal cultures substantially increased during the first day under high light (HL, 400 μmol photons m−2 s−1) conditions, whereas addition of 60 and 80 mM HEPES exerted tangible suppression effect on the cell growth during the first 2 days under stress as compared to the low‐concentration HEPES (Fig. 1B). After 4 days under stresses, when the cell growth gradually leveled off and reached a steady state, the biomass and astaxanthin content was analyzed. The results showed that the astaxanthin concentration after 4 days under HL conditions were increased by 10.1‐ to 11.8‐fold with the addition of HEPES, when compared to the cell cultures without pH control (Fig. 1C). In contrast to the effect of HEPES, neither the Tris‐HCl nor Tricine buffer can successfully maintain the pH below 8.5, although the astaxanthin accumulation was enhanced (Supplementary Figs. S1 and S2), while the cell number increased (20, 30 mM tricine) or slightly declined. Taken together, these results suggested 40 mM HEPES can facilitate the pH control, increase the cell survival, and stimulate astaxanthin accumulation under HL.
Figure 1.
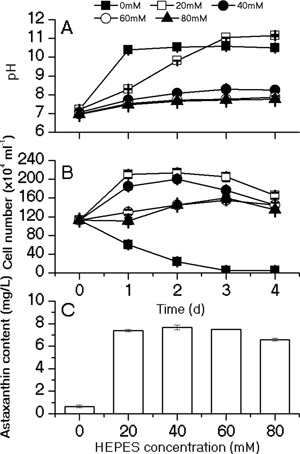
Effects of different concentrations of HEPES buffer on pH (A), cell number (B), and astaxanthin content (C). The pH and cell numbers were monitored on a daily basis during 4‐day induction; astaxanthin content were measured on day 4. Values represent the mean ± S.D (n = 3).
To optimize the conditions for astaxanthin induction, four types of culture media with different C and N regimes were compared. As shown in Figure 2, the pH for the above four cultures was successfully controlled in the range of 7–8.5 with the addition of 40 mM HEPES. The cell number of the culture with acetate and nitrate (+NaAc+N) underwent progressive increase during 4 days under HL, while under the other three conditions, the cell numbers were unchanged (Fig. 2B). After 4‐days induction, the algal culture of +NaAC‐N exhibited the highest astaxanthin content (0.86% of D.W., Fig. 2D). The other two groups with sodium bicarbonate as the carbon source showed lower biomass dry weight yield and astaxanthin content than those with organic carbon sources (Fig. 2C and D). Therefore, the N‐free C medium with acetate was selected for astaxanthin induction in this study.
Figure 2.
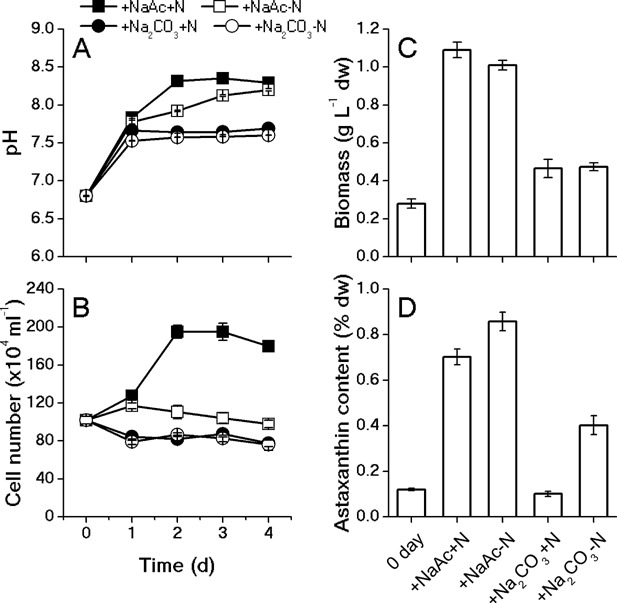
Effects of carbon source and nitrate on the pH (A), cell number (B) and biomass (C), astaxanthin content (D). The pH and cell number were monitored on a daily basis during 4‐day induction; biomass and astaxanthin content were measured on day 4.
In order to optimize the light intensities for inducing astaxanthin biosynthesis in the heterotrophically grown cells, cellular responses to a variety of light intensities were investigated. The near‐neutral pH were achieved through buffering with HEPES (Fig. 3A), and the optical densities of the algal cell cultures increased by 2‐fold after 4 days under all the conditions, consistent with the yield of biomass (Fig. 3B and D). With the increase of the light intensity, cell mortality showed a rising trend (Fig. 3C). About 2 × 10⁵ cells mL−1 were bleached when exposed for 1 day under HL, due to the photooxidative stress‐induced cell bleach. Although the algal cell number decrease by 51.2% after 4 days, the highest astaxatnhin content (0.97% of dw, initial content was 0.18%) and productivity (2.54 mg L−1 d−1) was achieved under 400 µmol photons m−2 s−1 (Fig. 3E and F). Taken together, the light intensity of 400 µmol photons m−2 s−1 were selected as induction condition.
Figure 3.
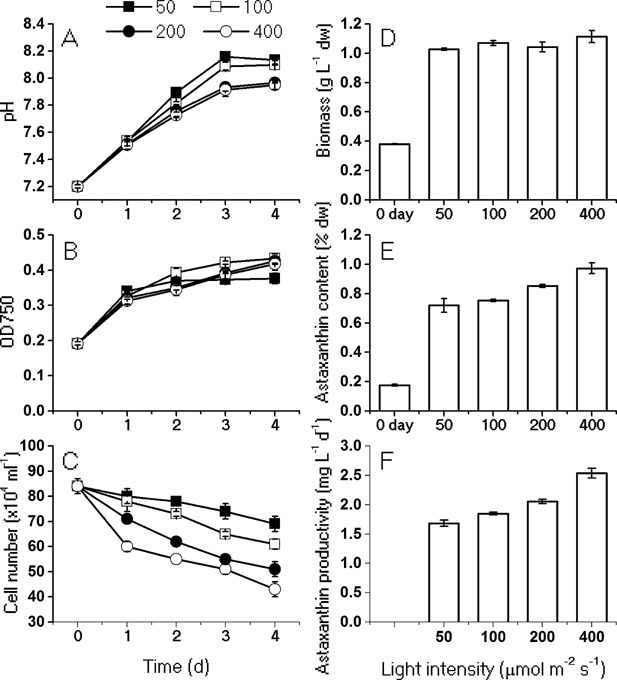
Effects of light intensities (50, 100, 200, 400 μmol photons m−2 s−1) on the pH (A), OD750 (B), cell number (C) and biomass (D), astaxanthin content (E) and astaxanthin productivity (F). The pH, OD, and cell numbers were monitored on a daily basis during 4‐day induction; biomass, astaxanthin content and productivity were measured on day 4.
Acclimating the Dark‐Grown Algal Cells Under Moderate Light (ML) and N‐Replete Autotrophic Conditions Increased the Cell Survival and Astaxanthin Accumulation Under HL Stress
As shown in Figure 3, the algal cells transferred from heterotrophic cultivation to the autotrophic conditions cannot effectively cope with the excessive light and therefore died off. We hypothesize that algal cells acclimated to the dark circumstances, and the photosynthetic apparatus, including those essential for protecting themselves from excess light, were impaired. It was assumed that acclimation under autotrophic conditions prior to high‐light induction may enhance the capability of algal cells to cope with excessive light and thereafter increase the astaxanthin productivity. To facilitate the recovery of photosynthetic complexes, cells were acclimated for 1 day under moderate illumination (25, 50, 100 µmol photons m−2 s−1) with or without the addition of 2 mM nitrate (N+ or N−), before being induced for 4 days under high‐light and N‐depleted conditions. The results showed that the cell concentration of the algal culture acclimated under 25 µmol photons m−2 s−1 with N (i.e., 25/N+) increased by 2.5‐fold by the end of acclimation, and then declined to the initial level during the induction process (Fig. 4B), and a similar trend was observed in 50/N+. It was observed that under such nutrient‐replete and low‐light conditions algal cells rapidly divided into motile cells but these cells are very susceptible to the excess light, and a part of cells died off under the stress conditions. For the other treatments, the cell number exhibited more or less decrease during the acclimation, and then leveled off under HL stress.
Figure 4.
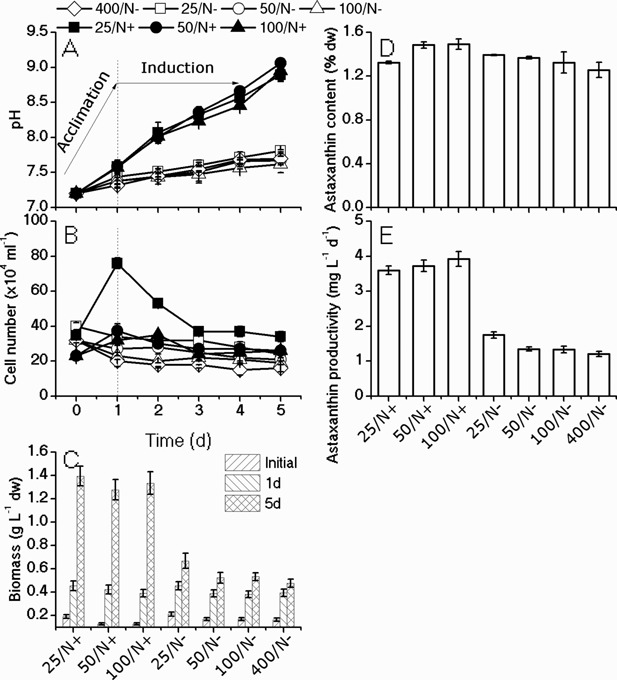
Effects of acclimation under moderate light intensity with/without nitrate on the pH (A), cell number changes (B) in the 4 days induction, and biomass (C), astaxanthin content (D) and astaxanthin productivity (E) at the end of the 5 days procession. Dark‐grown algal cells were acclimated for 1 day under moderate light (25, 50, 100 μmol photons m−2 s−1) and N‐replete (/N+) or N‐depleted (/N−) conditions, before being subjected to high‐light (400 μmol photons m−2 s−1) and N‐depleted induction for 4 days. The acclimated cells were compared to those subjected to induction without acclimation (400/N−).
After 1‐day acclimation, no significant difference in terms of the biomass was observed among various treatments (Fig. 4C). However, the cell cultures with the addition of N (25/N+, 50/N+, 100/N+), regardless of the light intensities, gave rise to significant higher biomass yield after 4 days under HL stress, as compared to those acclimated under the N‐depleted condition (25/N−, 50/N−, 100/N−) and the control (400/N−). In addition, the cells acclimated under the N‐replete and moderate light intensities (25/N+, 50/N+, 100/N+) accumulated slightly higher astaxanthin content (dw%) than the control (Fig. 4D). Therefore, the overall productivities of astaxanthin were increased by acclimating cells under N‐replete conditions. The highest productivity of astaxanthin (3.92 mg L−1 d−1) was achieved under 100 µmol photons m−2 s−1 (100/N+), which was 4‐fold increase as compared to the control without acclimation (400/N−) (Fig. 4E). These results suggested that N played a more important role in facilitating recovery of photosynthesis than light in that the treatments with the same illumination but without the addition of N exerted little stimulation on biomass and astaxanthin production as compared to the control (Fig. 4C–E).
Changes of Cell Morphology During Acclimation and Induction
Microscopic observation and flowcytometry (FCM) analysis were performed to detect the changes of cell morphology during the acclimation and induction process. It is shown in Figure 5 that after 1‐day acclimation under either ML or HL and N‐depleted condition cells developed into red aplanospores, accumulating substantial amounts of astaxanthin, whereas those acclimated under N‐replete conditions were arrested in the stage of greenish palmella cells. It was observed that the size of the acclimated cells is in the range of 8–10 μm, which is smaller than that before acclimation (10–15 μm). After 4 days under induction conditions, the cells acclimated under different conditions showed distinguishable size. Those acclimated under ML and N‐replete conditions, particularly for 100/N+, exhibited larger cell size (10–25 μm) and contained more large‐size red aplanospores than the control and those acclimated under N‐depleted conditions, of which the cell size are c.a. 10–20 μm. FCM analysis result is consistent with the microscopic observation, which indicated that the size of the cells acclimated under ML and N‐replete conditions are larger than that of the control and the other treatments (Fig. 5). Despite no difference with the cellular chlorophyll concentration (FL3) among the treatments, a fewer number of bleached cells were observed in the group under ML and N‐replete conditions, as compared to the control (400/N−) and those acclimated under ML and N‐depleted conditions (Fig. 5A).
Figure 5.
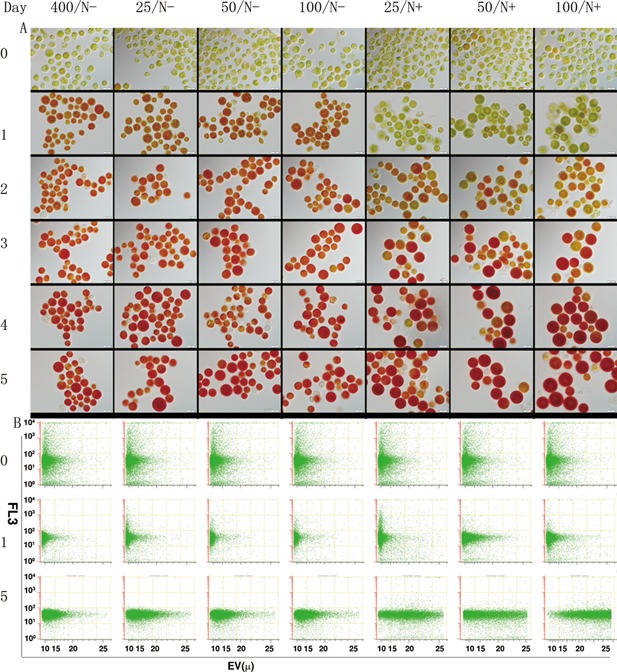
Microscopic observation (upper panel, A) and flow cytometry analysis (bottom panel, B) of cellular morphological changes during the acclimation and induction processes. Dark‐grown cells (day 0) were acclimated under moderate light (25, 50, 100 μmol photons m−2 s−1) and N‐replete (/N+) or N‐depleted (/N−) conditions for 1 day, and then subjected to HL and N‐depleted for 4 days (days 2–5) to induce astaxanthin accumulation. The cell size (EV, electronic volume) and chlorophyll fluorescence (FL3) measured from 10,000 cells by using a flow cytometer were displayed in the plots.
Increased Biomass Productivity After Acclimation Under ML and N‐Replete Conditions Is Attributable to the Enhanced PSII Efficiency
Cell morphological observation indicated that regeneration of photosystems under ML and N‐replete condition was coincident with the increase in the biomass productivity under induction conditions afterward. Thus, chlorophyll fluorometry was employed to analyze the photosynthetic activities for the cells with or without acclimation. As shown in the light‐response curves (Fig. 6), the algal cells acclimated under ML and N‐replete conditions (25, 50, 100/N+) exhibited a higher electron transport rate (ETR) and effective PS II quantum yield (Y(II)) under the actinic light in the range of 30–849 μmol photons m−2 s−1 than the cells without acclimation (i.e., heterotrophically grown cells, 400/N−), and those acclimated under ML and N‐depleted conditions (25, 50, 100/N−) (Fig. 6A and C). Among them, the highest ETR and Y (II) were attained in the group acclimated under the illumination of 25 μmol photons m−2 s−1 and N‐replete. Acclimation under N‐depleted conditions (i.e., 25, 50, 100, 400/N−) slightly increased the ETR and Y (II) of the heterotrophically grown cells.
Figure 6.
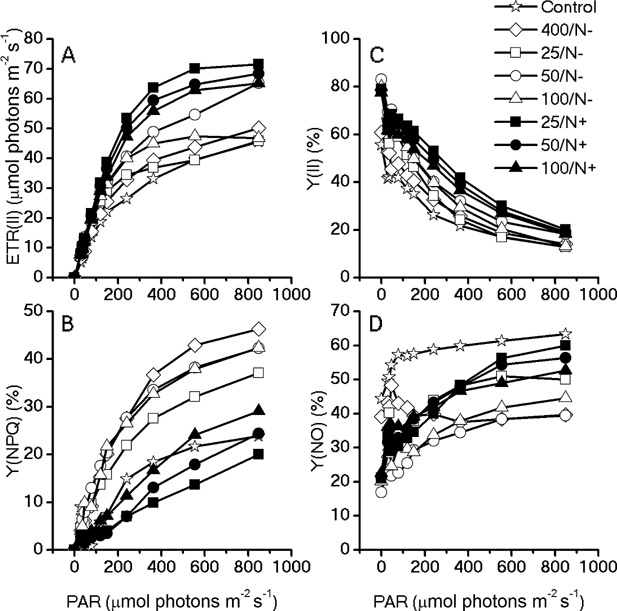
Light response curves of the chlorophyll fluorometry parameters for the acclimated algae cells. Chlorophyll fluorescence were obtained with a series of photosynthetically active radiances (0, 30, 37, 46, 77, 119, 150, 240, 363, 555, 849 μmol photons m−2 s−1) to calculate (A) electron transport rate, (B) Y(NPQ), (C) Y(II), and (D) Y(NO).
On the other hand, non‐photochemical quenching was greatly induced in the cells acclimated under N‐depleted conditions, and reached the highest level in those subjected to 400 µmol m−2 s−1. NPQ of the group acclimated under N‐replete conditions is similar with that of the heterophotically grown cells without any acclimation, except for 25/N+, of which the energy dissipated as heat was slightly down‐regulated during the acclimation process (Fig. 6B). The cells cultivated under heterotrophic conditions exhibited the highest Y(NO) among all the groups, which was indicative of severe damage caused by the non‐regulated energy dissipate at PSII (Fig. 6D). The acclimated cells showed a lower Y(NO) as compared to the control, especially under low actinic light ranged between 30 and 363 μmol photons m−2 s−1.
For the unstressed H. pluvialis cells grown under photoautotrophic conditions, the value of Fv/Fm is usually about 0.8 (Baker, 2008; Björkman and Demmig, 1987; Giersch and Krause, 1991; Johnson et al., 1993; Yoo et al., 2014). Decline of Fv/Fm to 0.6 in the heterotrophically grown cells as shown in Figure 7A indicated that the photosynthetic complexes were not well developed or impaired under heterotrophic conditions. During 1‐day acclimation under ML with or without N, Fv/Fm were greatly increased as compared to that subjected to HL directly (400/N−), while the presence of N further stimulated the recovery of photosystems. The Fv/Fm of the heterotrophically grown cells decreased sharply during the 12 h under 400/N− and gradually leveled off, whereas Fv/Fm of those acclimated cells, under either N− or N+ conditions, were down‐regulated under induction conditions. In contrast to Fv/Fm, energy dissipated as heat (NPQ) was increased in the cells without acclimation and slightly induced in the cells acclimated under ML/N− conditions, whereas was maintained at a relatively low level with the addition of N (Fig. 7B). The induced NPQ indicated down‐regulation of PS II as a protective mechanism against excess light intensity.
Figure 7.
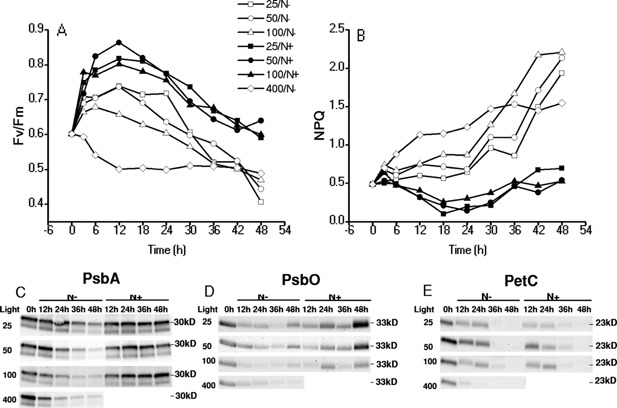
Changes in chlorophyll fluorometry parameters during the acclimation and induction processes (A and B) and western blot of protein PsbA, PsbO, and PetC (C, D, and E, respectively). The actinic lights for chlorophyll fluorometry analysis were set at 400 μmol photons m−2 s−1. The algae cells were collected and adapted in dark for 30 min before measurements. The samples for western blot were taken every 12 h during the 2‐day acclimation and induction.
Accordingly, the content of photosynthetic proteins were detected by western‐blotting. As shown in Figure 7, when exposed to high light and N depletion (400/N−), the contents of PsbA, PsbO, and PetC of the dark‐grown cells without any acclimation decrease dramatically. The psbA gene is located in the chloroplast genome and encodes for the D1 protein, a core component of Photosystem II. PsbO is a 33 kDa of the oxygen evolving complex (OEC) of PSII involved in driving highly oxidizing water splitting reaction. PetC (Rieske iron‐sulfur protein of Cyt b6/f complex, 23 kDa) is located in the chloroplast thylakoid membrane as a component of cytochrome b6‐f complex, which mediates electron transfer between photosystem II (PSII) and photosystem I (PSI), cyclic electron flow around PSI, and state transitions. Without nitrate added (25, 50, 100/N−), the contents of PsbA decreased as well, but at a slower rate than the control. For the groups with nitrate added during the acclimation (25, 50, 100/N+), the content of PsbA slightly decreased during the first 12 h, but increased during the latter 12 h in acclimation, and were stable under the induction conditions (Fig. 7C). Changes in the PsbO contents of 25, 50, 100/N+ showed the similar trend to that of PsbA during the acclimation and the first 12 h under the induction conditions. After 24 h under the induction conditions, it increased by 1.5‐ to 3‐fold, which are substantially higher than that of the groups acclimated under N‐depleted conditions and the control (Fig. 7D). Under the stress conditions, the contents of PetC were immediately declined to an undetectable level in the algal cells without acclimation, whereas it decayed gradually in the acclimated cells at a similar rate and became undetectable after 24 h (Fig. 7E),
Scaling‐Up the System for Astaxanthin Production
In order to further prove the concept and promote the astaxanthin production, the cell cultures were scaled up to 800 mL in a bubbling column photobioreactor with the supply of CO2 for the acclimation and induction experiments. Because the highest content and productivity of astaxanthin was achieved in the H. pluvialis cells that had been acclimated under the condition of 100/N+ (Fig. 4E), 100/N+ was selected for the acclimation in this experiment. For the control without acclimation, the dry weight was 1.41 g L−1 on day 12. The astaxanthin content achieved 1.98% (by DW) on day 14, while the highest astaxanthin productivity of 3.25 mg L−1 d−1 was achieved on day 4 (to which the corresponding dry weight is 1.11 g L−1, and the astaxanthin content was 1.18%). After being acclimated under 100/N+ conditions, the maximal dry weight, astaxanthin content and the highest astaxanthin productivity were 4.46 g L−1 (day 12), 2.37% (by DW, day 14) and 10.5 mg L−1 d−1, respectively (Fig. 8).
Figure 8.
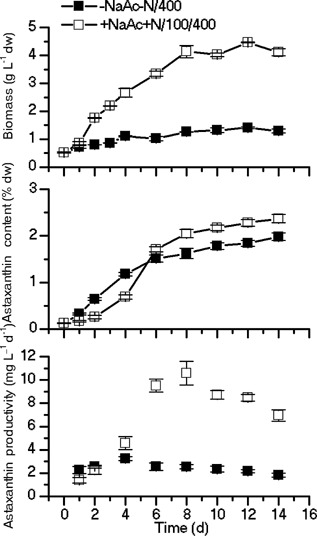
Biomass and astaxanthin content of H. pluvialis cultured in the 1 L bubbling column photobioreactor. —▪— dark‐grown cells were transferred to the N‐depleted growth medium and subjected to the illumination of 400 μmol photons m−2 s−1 for the astaxanthin induction, —□— cells were acclimated under N replete (2 mM) and 100 μmol photons m−2 s−1 conditions prior to the induction conditions under N deplete and 400 μmol photons m−2 s−1.
Discussion
Although photoautotrophy is obligate for most microalgae, many algal species such as H. pluvialis can be grown in dark by metabolizing organic compounds (e.g., sugars, acetate) as carbon source. Like angiosperms, some of these dark‐grown algae are etiolated during long period of culture time, due to the lack of the light‐independent chlorophyll biosynthesis pathway. In contrast, Chlamydomonas reinhardtii, a unicellular green alga, possesses a light‐independent protochlorophyllide oxidoreductase and thus is capable of synthesizing chlorophyll in dark. Consequently, the chloroplast of dark‐grown C. reinhardtii cells contains functional photosystems (Chen and Johns, 1996; Li et al., 2010; Zhang et al., 1999). It remains unclear whether H. pluvialis can synthesize chlorophyll in dark, but multiple lines of evidence obtained in this study suggested the photosynthesis of dark‐grown H. pluvialis cells are functional. These algal cells exhibited a yellow‐green color (Fig. 5), and the western blotting analysis indicated that the components of photosynthetic apparatus including PsbA (D1 protein), PsbO, and PetC are present in the cells (Fig. 7). Although the photosynthesis is active in the dark‐grown cells, photosynthesis was impaired, indicated by the decline of the maximum photosynthetic efficiency (Fv/Fm) to the level of 0.6. Moreover, photoinhibition occurred immediately when these cells were subjected to high‐light, in which Fv/Fm declined to 0.5 (Fig. 7A), and the content of D1 protein dramatically decreased (Fig. 7C).
Since the induction condition involves N‐depletion, the observed photoinhibition may be linked to the inactivate D1 turnover in that this process is dependent on de novo protein biosynthesis. This hypothesis can be supported by the fact that acclimating cells under moderate light and N‐repletion conditions led to the recovery of Fv/Fm to 0.8, which correlated with the accumulation of the de novo‐synthesized D1 protein (Fig. 7C). When no N was supplied during the acclimation process under moderate light, the Fv/Fm was recovered to 0.65–0.7, and neither D1 protein nor PsbO increased, indicating impairment of the PSII, which is mostly likely due to the lack of N source for the de novo protein biosynthesis. It was observed that during 1‐day acclimation process the protective mechanisms against photo‐oxidative stress were somehow induced in the cells acclimated under N‐depleted conditions, instead of in those acclimated under N‐replete conditions. In contrast, regeneration of the photosynthetic machineries and consequent recovery of photosynthetic efficiency were greater in the cells acclimated under N‐replete conditions (Fig. 7), which well explained the significantly enhanced biomass productivity as shown in Figure 4. In addition to the important role in the recovery of photosynthesis, low concentration of nitrogen has been suggested to be beneficial for astaxanthin accumulation, which is needed for the synthesis of astaxanthin biosynthetic enzymes to support the massive accumulation of the pigment (Boussiba and Vonshak, 1991; Choi et al., 2011)
Numerous studies suggested that while the dark‐grown photosynthetic cells are exposed to light, light govern many biological processes including chlorophyll synthesis, activation of the Calvin cycle, and up‐regulation of the photosynthetic genes (Armstrong et al., 1995; Horton and Black, 1981; Suzuki and Bauer, 1995). However, the results of this study indicated light played a less vital role than nitrogen in the process of acclimation, since there is slight difference in terms of photosynthesis efficiency and the content of photosynthetic components among the treatments with different light intensities under the same nitrogen regime, but the difference between N‐replete and N depletion under the same light regime is dramatic. H. pluvialis is likely capable of retaining its photosynthetic machinery in dark like its closely related organism C. reinhardtii (Lemieux et al., 2015). For better understanding the role of light in acclimation of dark‐grown H. pluvialis cells, it remains to be investigated how the photosynthetic apparatus and photosynthesis activities were reshaped during long‐term heterotrophic cultivation.
In this study, the heterotrophy‐grown H. pluvialis cells failed to utilize inorganic carbon efficiently, including both carbonate and CO2 as sole carbon source for astaxanthin biosynthesis. Capabilities in utilization of inorganic carbons cannot be restored by acclimating cells under moderate light and either with N or without N added. This conclusion differed from the previous findings that H. pluvialis cells prefer to assimilate CO2 for biomass and astaxanthin biosynthesis (Kang et al., 2005). The difference may arise from the distinguished genetic make‐up among different H. pluvialis strains, but also probably due to a metabolic shift caused by culture conditions. In the heterotrophic cultivation, the algae cells utilize the sodium acetate as the carbon and energy source, in which the ATP and NADPH are provided by the TCA cycle (Perez‐Garcia et al., 2011). As such, photophosphorylation and Calvin cycle are not obligate any more, and the cellular machineries involved may be disassembled or not fully developed. Acclimating cells under light and nitrogen seemed to have little effect on regeneration of cellular components involved in inorganic carbon assimilation. Therefore, in the future study the rebuilding of cellular capacities in utilization of inorganic carbons needs to be considered during the acclimation process. A variety of carbon sources or other co‐factors will be investigated when the growth medium used for acclimation is to be formulated.
In summary, a new culture strategy is developed in this study to mitigate the death of heterotrophy‐grown cells in the process of high‐light induction of astaxanthin accumulation, which significantly increased the astaxanthin productivity as a consequence. Along with a combination of heterotrophy and autotrophy cultivation modes for biomass and astaxanthin production, respectively, this strategy is promising for commercial‐scale astaxanthin production in the future.
This work is partially supproted by State Development & Investment Corporation (SDIC) of China, and National Science Foundation of Hubei Province (2015CFA022).
Supporting information
Additional supporting information may be found in the online version of this article at the publisher's web‐site.
Supporting Data S1.
Supporting Data S2.
Contributor Information
Yuanguang Li, Email: ygli@ecust.edu.cn, Phone: +86‐21‐64250964, FAX: +86‐21‐64250964.
Danxiang Han, Email: danxianghan@ihb.ac.cn, Phone: +86‐27‐68780160, FAX: +86‐27‐6878‐0839.
Reference
- Aflalo C, Meshulam Y, Zarka A, Boussiba S. 2007. On the relative efficiency of two‐vs. one‐stage production of astaxanthin by the green alga Haematococcus pluvialis . Biotechnol Bioeng 98(1):300–305. [DOI] [PubMed] [Google Scholar]
- Armstrong GA, Runge S, Frick G, Sperling U, Apel K. 1995. Identification of NADPH: protochlorophyllide oxidoreductases A and B: A branched pathway for light‐dependent chlorophyll biosynthesis in Arabidopsis thaliana . Plant Physiol 108(4):1505–1517. [DOI] [PMC free article] [PubMed] [Google Scholar]
- Baker NR. 2008. Chlorophyll fluorescence: A probe of photosynthesis in vivo. Annu Rev Plant Biol 59:89–113. [DOI] [PubMed] [Google Scholar]
- Björkman O, Demmig B. 1987. Photon yield of O2 evolution and chlorophyll fluorescence characteristics at 77K among vascular plants of diverse origins. Planta 170(4):489–504. [DOI] [PubMed] [Google Scholar]
- Boussiba S, Vonshak A. 1991. Astaxanthin accumulation in the green alga Haematococcus pluvialis . Plant Cell Physiol 32(7):1077–1082. [Google Scholar]
- Chen F, Johns MR. 1996. Heterotrophic growth of Chlamydomonas reinhardtii on acetate in chemostat culture. Process Biochem 31(6):601–604. [Google Scholar]
- Chen F, Chen H, Gong X. 1997. Mixotrophic and heterotrophic growth of Haematococcus lacustris and rheological behaviour of the cell suspensions. Bioresour Technol 62(1):19–24. [Google Scholar]
- Choi Y‐E, Yun Y‐S, Park JM, Yang J‐W. 2011. Determination of the time transferring cells for astaxanthin production considering two‐stage process of Haematococcus pluvialis cultivation. Bioresour Technol 102(24):11249–11253. [DOI] [PubMed] [Google Scholar]
- Fábregas J, Otero A, Maseda A, Domínguez A. 2001. Two‐stage cultures for the production of astaxanthin from Haematococcus pluvialis . J Biotechnol 89(1):65–71. [DOI] [PubMed] [Google Scholar]
- Fan J, Huang J, Li Y, Han F, Wang J, Li X, Wang W, Li S. 2012. Sequential heterotrophy‐dilution‐photoinduction cultivation for efficient microalgal biomass and lipid production. Bioresour Technol 112:206–211. [DOI] [PubMed] [Google Scholar]
- Genty B, Briantais J‐M, Baker NR. 1989. The relationship between the quantum yield of photosynthetic electron transport and quenching of chlorophyll fluorescence. Biochim Biophys Acta 990(1):87–92. [Google Scholar]
- Giersch C, Krause GH. 1991. A simple model relating photoinhibitory fluorescence quenching in chloroplasts to a population of altered photosystem II reaction centers. Photosynth Res 30(2–3):115–121. [DOI] [PubMed] [Google Scholar]
- Guerin M, Huntley ME, Olaizola M. 2003. Haematococcus astaxanthin: Applications for human health and nutrition. Trends Biotechnol 21(5):210–216. [DOI] [PubMed] [Google Scholar]
- Hata N, Ogbonna JC, Hasegawa Y, Taroda H, Tanaka H. 2001. Production of astaxanthin by Haematococcus pluvialis in a sequential heterotrophic‐photoautotrophic culture. J Appl Phycol 13(5):395–402. [Google Scholar]
- Higuera‐Ciapara I, Felix‐Valenzuela L, Goycoolea F. 2006. Astaxanthin: A review of its chemistry and applications. Crit Rev Food Sci Nutr 46(2):185–196. [DOI] [PubMed] [Google Scholar]
- Horton P, Black MT. 1981. Light‐dependent quenching of chlorophyll fluorescence in pea chloroplasts induced by adenosine 5′‐triphosphate. Biochim Biophys Acta 635(1):53–62. [DOI] [PubMed] [Google Scholar]
- Imamoglu E, Dalay MC, Sukan FV. 2009. Influences of different stress media and high light intensities on accumulation of astaxanthin in the green alga Haematococcus pluvialis . New Biotechnol 26(3):199–204. [DOI] [PubMed] [Google Scholar]
- Johnson G, Young A, Scholes J, Horton P. 1993. The dissipation of excess excitation energy in British plant species. Plant Cell Environ 16(6):673–679. [Google Scholar]
- Kang C, Lee J, Park T, Sim S. 2005. Comparison of heterotrophic and photoautotrophic induction on astaxanthin production by Haematococcus pluvialis . Appl Microbiol Biotechnol 68(2):237–241. [DOI] [PubMed] [Google Scholar]
- Kobayashi M, Kakizono T, Yamaguchi K, Nishio N, Nagai S. 1992. Growth and astaxanthin formation of Haematococcus pluvialis in heterotrophic and mixotrophic conditions. J Ferment Bioeng 74(1):17–20. [Google Scholar]
- Kobayashi M, Kurimura Y, Tsuji Y. 1997. Light‐independent, astaxanthin production by the green microalga Haematococcus pluvialis under salt stress. Biotechnol Lett 19(6):507–509. [Google Scholar]
- Lemieux C, Vincent AT, Labarre A, Otis C, Turmel M. 2015. Chloroplast phylogenomic analysis of chlorophyte green algae identifies a novel lineage sister to the Sphaeropleales (Chlorophyceae). BMC Evol Biol 15:264. [DOI] [PMC free article] [PubMed] [Google Scholar]
- Li Y, Han D, Hu G, Sommerfeld M, Hu Q. 2010. Inhibition of starch synthesis results in overproduction of lipids in Chlamydomonas reinhardtii . Biotechnol Bioen 107(2):258–268. [DOI] [PubMed] [Google Scholar]
- Lorenz RT, Cysewski GR. 2000. Commercial potential for Haematococcus microalgae as a natural source of astaxanthin. Trends Bbiotechnol 18(4):160–167. [DOI] [PubMed] [Google Scholar]
- Maxwell K, Johnson GN. 2000. Chlorophyll fluorescence—A practical guide. J Exp Bot 51(345):659–668. [DOI] [PubMed] [Google Scholar]
- Moya M, Sánchez‐Guardamino M, Vilavella A, Barbera E. 1997. Growth of Haematococcus lacustris: A contribution to kinetic modelling. J Chem Technol Biotechnol 68(3):303–309. [Google Scholar]
- Ogbonna JC, Masui H, Tanaka H. 1997. Sequential heterotrophic/autotrophic cultivation—An efficient method of producing Chlorella biomass for health food and animal feed. J Appl Phycol 9(4):359–366. [Google Scholar]
- Olaizola M. 2003. Commercial development of microalgal biotechnology: From the test tube to the marketplace. Biomol Eng 20(4):459–466. [DOI] [PubMed] [Google Scholar]
- Perez‐Garcia O, Escalante FM, de‐Bashan LE, Bashan Y. 2011. Heterotrophic cultures of microalgae: Metabolism and potential products. Water Res 45(1):11–36. [DOI] [PubMed] [Google Scholar]
- Sarada R, Tripathi U, Ravishankar G. 2002. Influence of stress on astaxanthin production in Haematococcus pluvialis grown under different culture conditions. Process Biochem 37(6):623–627. [Google Scholar]
- Shimidzu N, Goto M, Miki W. 1996. Carotenoids as singlet oxygen quenchers in marine organisms. Fisheries Sci 62(1):134–137. [Google Scholar]
- Suzuki JY, Bauer CE. 1995. A prokaryotic origin for light‐dependent chlorophyll biosynthesis of plants. Proc Natl Acad Sci 92(9):3749–3753. [DOI] [PMC free article] [PubMed] [Google Scholar]
- Tripathi U, Sarada R, Rao SR, Ravishankar G. 1999. Production of astaxanthin in Haematococcus pluvialis cultured in various media. Bioresour Technol 68(2):197–199. [Google Scholar]
- Wan M, Zhang Z, Wang J, Huang J, Fan J, Yu A, Wang W, Li Y. 2015. Sequential Heterotrophy‐Dilution‐Photoinduction Cultivation of Haematococcus pluvialis for efficient production of astaxanthin. Bioresour Technol 198:557–563. [DOI] [PubMed] [Google Scholar]
- Wang B, Zhang Z, Hu Q, Sommerfeld M, Lu Y, Han D. 2014. Cellular capacities for high‐light acclimation and changing lipid profiles across life cycle stages of the green alga Haematococcus pluvialis . PLoS ONE 9(9):e106679. [DOI] [PMC free article] [PubMed] [Google Scholar]
- Wellburn AR. 1994. The spectral determination of chlorophylls a and b, as well as total carotenoids, using various solvents with spectrophotometers of different resolution. J Plant Physiol 144(3):307–313. [Google Scholar]
- Yoo SY, Park JY, Lee DW, Woo S‐H, Ko TS, Kim TW. 2014. Chlorophyll a fluorescence imaging analysis in air‐drying stressed sorghum (Sorghum bicolor L.) leaf. Int J Adv Agri Sci Technol 3(1):58–66. [Google Scholar]
- Yuan J‐P, Chen F. 1997. Identification of astaxanthin isomers in Haematococcus lacustris by HPLC‐photodiode array detection. Biotechnol Tech 11(7):455–459. [Google Scholar]
- Yuan J‐P, Chen F, Liu X, Li X‐Z. 2002. Carotenoid composition in the green microalga Chlorococcum . Food Chemistry 76(3):319–325. [Google Scholar]
- Zhang X‐W, Chen F, Johns MR. 1999. Kinetic models for heterotrophic growth of Chlamydomonas reinhardtii in batch and fed‐batch cultures. Proc Biochem 35(3):385–389. [Google Scholar]
Associated Data
This section collects any data citations, data availability statements, or supplementary materials included in this article.
Supplementary Materials
Additional supporting information may be found in the online version of this article at the publisher's web‐site.
Supporting Data S1.
Supporting Data S2.