

Abstract
Cetuximab in combination with an irinotecan‐containing regimen is a standard treatment in patients with KRAS wild‐type (KRAS WT), metastatic colorectal cancer (mCRC). We investigated the addition of the oral MET inhibitor tivantinib to cetuximab + irinotecan (CETIRI) based on preclinical evidence that activation of the MET pathway may confer resistance to anti‐EGFR therapy. Previously treated patients with KRAS WT advanced or mCRC were enrolled. The phase 1, open‐label 3 + 3, dose‐escalation study evaluated the safety and maximally tolerated dose of tivantinib plus CETIRI. The phase 2, randomized, double‐blinded, placebo‐controlled study of biweekly CETIRI plus tivantinib or placebo was restricted to patients who had received only one prior line of chemotherapy. The phase 2 primary endpoint was progression‐free survival (PFS). The recommended phase 2 dose was tivantinib (360 mg/m2 twice daily) with biweekly cetuximab (500 mg/m2) and irinotecan (180 mg/m2). Among 117 patients evaluable for phase 2 analysis, no statistically significant PFS difference was observed: 8.3 months on tivantinib vs. 7.3 months on placebo (HR, 0.85; 95% confidence interval, 0.55–1.33; P = 0.38). Subgroup analyses trended in favor of tivantinib in patients with MET‐High tumors by immunohistochemistry, PTEN‐Low tumors, or those pretreated with oxaliplatin, but subgroups were too small to draw conclusions. Neutropenia, diarrhea, nausea and rash were the most frequent severe adverse events in tivantinib‐treated patients. The combination of tivantinib and CETIRI was well tolerated but did not significantly improve PFS in previously treated KRAS WT mCRC. Tivantinib may be more active in specific subgroups.
Keywords: irinotecan, KRAS wild‐type, MET inhibitor, metastatic colorectal cancer, tivantinib
Short abstract
What's new?
Is there a way to head off drug‐resistant colorectal cancer? A new study investigates whether a new drug, tivantinib, can improve survival by staving off tumor cells' resistance to chemotherapy. Previous results have shown that the MET signaling pathway contributes to the spread of cancer and the onset of resistance. The authors added the MET inhibitor tivantinib to the regimen of cetuximab and irinotecan. The tivantinib did not improve survival times, but the drug might yet prove effective among specific tumor subgroups.
Although management of advanced, unresectable or metastatic colorectal cancer (mCRC) has improved over the past decade, the prognosis for patients with mCRC remains poor, with an expected 5‐year overall survival (OS) rate of 13%, and median OS of <3 years.1, 2, 3 Chemotherapy commonly consists of 5‐fluorouracil (5‐FU) and leucovorin combined with oxaliplatin or irinotecan.2, 4 Monoclonal antibodies against the epidermal growth factor receptor (EGFR), cetuximab and panitumumab, improve OS in selected patients with mCRC, as either single agents or combination therapy.5, 6, 7 Both are approved in combination with chemotherapy for the first‐line treatment of patients with KRAS wild‐type mCRC.8, 9, 10
Possible mechanisms of resistance to EGFR‐targeted therapy in colorectal cancer (CRC) include activation and/or mutation of downstream effectors such as KRAS,11, 12 as shown by multiple studies.13, 14, 15, 16, 17 In addition, activation of parallel pathways such as those involving the MNNG HOS transforming gene (MET) receptor tyrosine kinase has been observed.18, 19, 20, 21 Hepatocyte growth factor (HGF) and MET are often co‐expressed in the CRC microenvironment, and high expression is associated with metastatic disease and poor prognosis.22, 23, 24, 25 Substantial activation of the HGF/MET pathway also leads to scattering and invasion of cancer cells and is inversely correlated with PTEN expression.25, 26, 27, 28 Inhibition of the MET pathway has been shown to reduce migration and invasion of human colorectal cancer cells in vitro, and this effect was associated with attenuated activation of the EGFR, MET and downstream MAPK and PI3K/AKT/mTOR signaling pathways.29 In patients with solid tumors being treated with tivantinib (n = 15), inhibition of MET signaling was observed at all tested doses, and serial biopsies before and during treatment showed a significant association between treatment with tivantinib and a decrease in total MET and phosphorylated MET (P=0.041).30
Tivantinib (ARQ 197), a selective, oral inhibitor of MET, has been evaluated as a single agent and in combinations in solid tumors, including mCRC.31 The recommended phase 2 dose of tivantinib in combination with cetuximab plus irinotecan (CETIRI) was evaluated, and the randomized phase 2 portion evaluated the clinical benefit of adding tivantinib (360 mg twice daily [BID]) to CETIRI as second‐line therapy in patients with KRAS wild‐type mCRC.
Methods
Patients
Eligible patients were required to have histologically confirmed, unresectable, locally advanced or metastatic, KRAS wild‐type CRC. Unlimited prior therapies were allowed in the phase 1 portion; in phase 2, patients were only allowed to receive one prior line of chemotherapy, including an irinotecan‐based regimen but not an EGFR inhibitor. Adjuvant chemotherapy was allowed to be counted as a line of therapy if disease progression/recurrence had occurred ≤6 months after completing treatment.
Patients were required to be ≥18 years of age, have measurable disease by Response Evaluation Criteria In Solid Tumors (RECIST) version 1.1, adequate organ and bone marrow function, resolution of any toxic effects of prior therapy (except alopecia) and Eastern Cooperative Oncology Group (ECOG) performance status of 0–1. All institutional review boards approved the protocol (Clinical Trials.gov identifier, NCT01075048), and all participants provided written informed consent.
Study design and treatment
This phase 1/2 study accrued patients from January 2010 to January 2012. The phase 1 portion was an open‐label, classic 3 + 3 dose‐escalation study to evaluate the safety of BID tivantinib in combination with CETIRI (biweekly schedule). The recommended phase 2 dose (RP2D) of tivantinib was determined based on protocol‐specified dose‐limiting toxicities (DLT). Dose escalation would occur if none of three treated patients experienced a tivantinib‐related DLT by Day 29.
The phase 2 portion was a randomized, double‐blinded, placebo‐controlled study to assess the efficacy and safety of tivantinib in combination with CETIRI. Patients were stratified according to best tumor response to first‐line therapy and ECOG performance status and were randomly assigned 1:1 (Interactive Web Response System, code generated by independent biostatistician) to receive either CETIRI plus tivantinib or CETIRI plus placebo (Interactive Voice Response System for study drug). Oral BID tivantinib (360 mg, capsule formulation) or placebo was taken with meals. Every 14 days of a 28‐day cycle, cetuximab (500 mg/m2) was administered intravenously (IV) followed by oral tivantinib or placebo and IV irinotecan (180 mg/m2).
Endpoints and assessments
The primary efficacy endpoint for the phase 2 study was investigator‐assessed progression‐free survival (PFS). Secondary endpoints included OS, best overall response and objective response rate (ORR). Tumor assessments per RECIST version 1.1 with computed tomography (CT) of the chest and CT and/or magnetic resonance imaging (MRI) of the abdomen/pelvis were performed every two treatment cycles (every 8 weeks, ±3 days) and at the end of the treatment visit (EOT; 30 days after last dose, ±7 days).
Safety analyses in patients who received at least one dose of study drug included extent of exposure, adverse events (AEs), laboratory tests, vital signs and physical examination. AEs were coded using the Medical Dictionary for Regulatory Activities (MedDRA) version 13.0 and assigned grades based on National Cancer Institute (NCI) Common Toxicity Criteria for Adverse Events (CTCAE), version 4.0.
Additional exploratory analyses included health‐related quality of life (HRQOL), pharmacokinetics (PK) and biomarkers. Patients' HRQOL was assessed using the Functional Assessment of Cancer Therapy‐Colorectal (FACT‐C) questionnaire. Patients completed the questionnaire at screening and Day 1 of every other cycle, at the EOT visit and the follow‐up visit.
Archival tumor tissue samples, fresh core‐needle biopsy, or fine‐needle aspirates were collected at screening for biomarker assessments. Collected formalin‐fixed, paraffin‐embedded samples were evaluated for total MET and PTEN expression by immunohistochemistry (IHC). Expression of MET was evaluated by a CLIA‐certified central laboratory using the CONFIRM™ anti‐total MET (SP44) antibody (Ventana; Roche) and adjudicated by three pathologists. MET‐High samples were defined as a ≥2+ score in ≥50% of tumor tissue. Plasma samples were collected on Day 1 of each cycle until Cycle 12, on first documentation of response, and at EOT. Samples were analyzed by a central laboratory for changes in HGF (Quantikine Human HGF assay; high levels were defined by median, 1,415.9 pg/mL), vascular endothelial growth factor (VEGF; enzyme immunoassay), soluble MET (enzyme immunoassay) and soluble VEGF receptor (enzyme immunoassay).
Statistical analysis
PFS was analyzed in all evaluable patients who were randomized in phase 2, received at least one dose of study drug, and had at least one efficacy assessment. As a sensitivity analysis, PFS was also analyzed in the per‐protocol analysis set, which excluded patients with major protocol deviations. Between‐group comparisons of PFS were based on the stratified log‐rank test. Median PFS, OS and hazard ratios (HR) between the treatment groups were estimated by the Kaplan–Meier method along with 95% confidence intervals (CIs).
Assessment of HRQOL permitted imputation of missing responses. Discrete variables were compared using Fisher's exact test, and continuous and ordinal categorical variables were compared using the Wilcoxon rank‐sum test.
The phase 2 study had a planned sample size of 150 patients, with 134 evaluable patients (assuming a 10% dropout rate). Assumptions included a median PFS of 4.1 months in the placebo group (based on historical data from the BOND trial in previously treated patients who received irinotecan plus anti‐EGFR therapy)7 and a 50% improvement (i.e., HR of 0.667) in PFS with tivantinib, thus requiring 110 events to yield ≥80% power to detect a 50% improvement in median PFS at a significance level of 0.10 (one‐sided) by the log‐rank test. The phase 2 study was amended to an enrollment of 122 patients because of a slow enrollment rate. Eighty events were then required to yield 70% power to detect a 50% improvement in median PFS at a significance level of 0.10 (one‐sided). The final analysis was to be conducted when the required number of events was observed. All reported P values are two‐sided.
Results
Overall, 131 patients were enrolled in the phase 1 (n = 9) and phase 2 (n = 122) portions of the study. In the phase 1 portion, each of the three tivantinib doses (120, 240 or 360 mg BID) was received by three patients. No DLTs were observed, and the RP2D of tivantinib in this combination was 360 mg BID. During the phase 2 portion, 122 patients were randomly assigned to CETIRI plus tivantinib or CETIRI plus placebo (Fig. 1): 62 received tivantinib and 59 received placebo (one patient randomized to placebo did not receive study medication). A total of 117 (96%) patients (tivantinib, n = 60 and placebo, n = 57) were evaluable for efficacy. Median follow‐up was 15.9 months for the PFS analysis and 21.5 months for the OS analysis. Treatment groups were well balanced for baseline characteristics (Table 1). Approximately 18% of patients had received prior irinotecan treatment, and 81% had received prior oxaliplatin.
Figure 1.
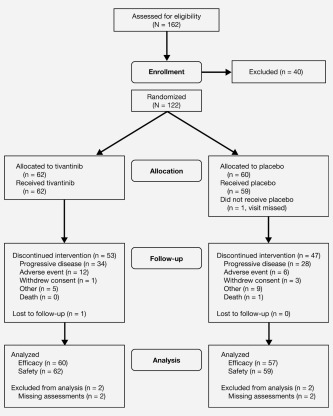
Patient disposition in phase 2. Other reasons for discontinuing treatment were clinical progression, investigator discretion, patient decision and patient relocation.
Table 1.
Patient demographics and baseline characteristics
| Tivantinib (N = 60) | Placebo (N = 57) | Total (N = 117) | ||||
|---|---|---|---|---|---|---|
| n | % | n | % | n | % | |
| Age, years | ||||||
| Mean | 57 | 57 | 57 | |||
| Range | 29–79 | 27–79 | 27–79 | |||
| Male | 26 | 43 | 32 | 56 | 58 | 50 |
| Race | ||||||
| Caucasian | 57 | 95 | 54 | 95 | 111 | 95 |
| Black | 2 | 3 | 1 | 2 | 3 | 3 |
| Asian | 1 | 2 | 2 | 3 | 3 | 3 |
| Weight, kg | ||||||
| Mean | 82.9 | 77.5 | 80.3 | |||
| Standard deviation | 19.06 | 16.61 | 18.03 | |||
| Range | 49.5–134.2 | 39.6–131.0 | 39.6–134.2 | |||
| ECOG | ||||||
| 0 | 35 | 58 | 28 | 49 | 63 | 54 |
| 1 | 24 | 40 | 29 | 51 | 53 | 45 |
| Missing | 1 | 2 | 0 | 0 | 1 | 1 |
| Disease stage | ||||||
| Locally advanced | 7 | 12 | 8 | 14 | 15 | 13 |
| Metastatic | 53 | 88 | 49 | 86 | 102 | 87 |
| Prior cancer therapy | ||||||
| Bevacizumab | 33 | 55 | 25 | 44 | 58 | 50 |
| Irinotecan | 10 | 17 | 11 | 19 | 21 | 18 |
| FLP | 60 | 100 | 55 | 96 | 115 | 98 |
| Oxaliplatin | 47 | 78 | 48 | 84 | 95 | 81 |
| Radiation | 9 | 15 | 10 | 18 | 19 | 16 |
| Othera | 50 | 83 | 46 | 81 | 96 | 82 |
| Time from PD to study entry, days | ||||||
| <30 | 28 | 47 | 27 | 47 | 55 | 47 |
| 30–120 | 19 | 32 | 22 | 39 | 41 | 35 |
| >120 | 9 | 15 | 2 | 4 | 11 | 9 |
| Missing | 4 | 7 | 6 | 11 | 10 | 6 |
| Total MET status b | ||||||
| Positive | 24 | 40 | 20 | 35 | 44 | 38 |
| Negative | 11 | 18 | 12 | 21 | 23 | 20 |
| Unknown | 25 | 42 | 25 | 44 | 50 | 43 |
| HGF levels, pg/mL | ||||||
| ≤1,415.9 | 30 | 50 | 28 | 49 | 58 | 50 |
| >1,415.9 | 29 | 48 | 28 | 49 | 57 | 49 |
| Missing | 1 | 2 | 1 | 2 | 2 | 2 |
Percentages may not total 100% due to rounding, unless otherwise identified.
Includes capecitabine (Xeloda and Xelox), cisplatin, sorafenib, FOLFOX, FOLFIRI, erbitux, interferon, mitomycin C, autologous tumor vaccine, levoleucovorin, novel VEGFR‐2 inhibitor, dexamethasone, everolimus, radiochemotherapy, hyperthermic cytoreduction, GDC‐0449, imatinib, cetuximab, sorafenib, 5‐fluorouracil, and folic acid.
Determined by immunohistochemistry.
Abbreviations: ECOG: Eastern Cooperative Oncology Group; FLP: 5‐fluorouracil, leucovorin, and cisplatin; HGF: hepatocyte growth factor; MET: MNNG HOS transforming gene; PD: progressive disease; SD: standard deviation.
Efficacy
Progression‐free survival
The median PFS was 8.3 months (95% CI, 5.6–10.8) in the tivantinib group and 7.3 months (95% CI, 5.3–9.0) in the placebo group (Fig. 2 a), with no statistically significant difference (HR, 0.85; 95% CI, 0.55–1.33; P = 0.38). In the prespecified subgroup analyses (based on age, sex, or ECOG performance status at baseline), no statistically significant PFS benefit was observed with the addition of tivantinib to CETIRI. Results were similar for the per‐protocol analysis set.
Figure 2.
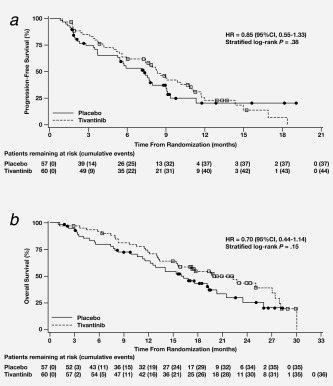
(a) Progression‐free survival and (b) overall survival, by treatment group (full analysis set). Censored observations are indicated by a circle or square. Abbreviations: CI: confidence interval; HR: hazard ratio.
Overall survival
There was a nonsignificant trend toward improved OS in the tivantinib group (19.8 months; 95% CI, 13.4–27.0) compared with the placebo group (16.9 months; 95% CI, 12.2–20.4; HR, 0.70; P = 0.15) (Fig. 2 b). Subsequent anticancer therapies were received by 58.3% of patients in the tivantinib group (mean, 1.17 treatment regimens) and by 42.9% of patients in the placebo group (mean, 1.20 treatment regimens).
Objective response rate
During the phase 1 portion, the ORR (complete and partial responses) was 44% (n = 4). One patient had a complete response, and among the three patients with a partial response, one patient, who had previously progressed on irinotecan and cetuximab, had a long‐lasting partial response (401 days). In phase 2, the ORR was 45% in the tivantinib group compared with 33% in the placebo group (P = 0.14) (Table 2); no complete responses were reported. Mean duration of response was similar in the tivantinib and placebo groups (28.8 and 29.4 weeks, respectively). Mean duration of stable disease was 29.8 weeks in the tivantinib group and 24.5 weeks in the placebo group.
Table 2.
Tumor response in phase 2 study portion by treatment group (FAS)
| Tivantinib (N = 60) | Placebo (N = 57) | |||
|---|---|---|---|---|
| n | % | n | % | |
| Complete response | 0 | 0 | 0 | 0 |
| Partial response | 27 | 45 | 19 | 33 |
| 95% CIa | 33.1–57.5 | 22.5–46.3 | ||
| Stable disease | 22 | 37 | 22 | 39 |
| 95% CI | 25.6–49.3 | 27.1–51.6 | ||
| Progressive disease | 9 | 15 | 13 | 23 |
| 95% CI | 8.1–26.1 | 13.8–35.2 | ||
| Not evaluable | 2 | 3 | 3 | 5 |
| Objective response b | 27 | 45 | 19 | 33 |
| 95% CI | 33.1–57.5 | 22.5–46.3 | ||
| Best overall response (SD or better) | 49 | 82 | 41 | 72 |
| 95% CI | 70.1–89.4 | 59.2–81.9 | ||
The exact 95% CIs for tumor response were calculated using the Wilson method.
Objective response includes complete and partial responses.
Abbreviations: CI: confidence interval; FAS: full analysis set; SD: stable disease.
Exploratory subgroup analyses
Baseline tissue biomarker samples were collected from 82 patients in phase 2 (tivantinib, n = 46; placebo, n = 36) to categorize tumors for high or low levels of MET and PTEN. Available archival samples (n = 89) were largely from metastatic tumors (72%), and adequate tissue for evaluation of MET expression was available from 67 patients. Biomarker analysis showed that 44 patients had MET‐High tumors, 23 had MET‐Low tumors, and 36 each were PTEN‐High and PTEN‐Low. Among 44 patients with MET‐High tumors, trends favoring tivantinib were observed in ORR (54 vs. 30%), PFS (7.9 vs. 5.8 months; HR, 0.74; 95% CI, 0.36–1.52; P = 0.41) and OS (22.3 vs. 17.6 months; HR, 0.58; 95% CI, 0.25–1.36; P = 0.20) (Table 3). Among 23 patients with MET‐Low tumors, tivantinib did not significantly improve ORR or OS, but did improve PFS (HR, 0.22; P = 0.01) compared with placebo. Among 36 patients with PTEN‐Low tumors, an advantage was observed for tivantinib in ORR (58 vs. 18%), PFS (HR, 0.28; 95% CI, 0.11–0.73; P = 0.006) and OS (HR, 0.19; 95% CI, 0.07–0.54; P < 0.001). Similar trends were observed in patients with baseline circulating HGF values higher than the median, although differences were not significant. Results in PTEN‐High and HGF‐Low subgroups were not significant (Table 3).
Table 3.
Efficacy by tumor MET, PTEN and circulating HGF baseline status
| ORR (CR + PR), % | PFS | OS | ||||||||||
|---|---|---|---|---|---|---|---|---|---|---|---|---|
| Subset | Patients T/P, n | T | P | p values | Events, T/P | PFS T/P, months | HR | p values | Events, T/P | OS T/P, months | HR | p values |
| MET‐High | 24/20 | 54 | 30 | 0.11 | 19/14 | 7.9/5.8 | 0.74 | 0.41 | 14/11 | 22.3/17.6 | 0.58 | 0.20 |
| MET‐Low | 11/12 | 36 | 42 | 0.79 | 7/10 | 11.0/6.2 | 0.22 | 0.01 | 5/7 | NE/16.9 | 0.78 | 0.67 |
| PTEN‐Higha | 18/18 | 33 | 44 | 0.49 | 15/13 | 7.4/7.2 | 0.97 | 0.92 | 11/8 | 13.2/17.6 | 1.39 | 0.48 |
| PTEN‐Lowa | 19/17 | 58 | 18 | 0.01 | 12/12 | 11.1/5.3 | 0.28 | 0.006 | 11/5 | 25.1/8.3 | 0.19 | <0.001 |
| HGF‐Highb | 29/28 | 45 | 25 | 0.12 | 22/19 | 7.9/7.3 | 0.70 | 0.27 | 18/17 | 19.6/11.6 | 0.61 | 0.16 |
| HGF‐Lowb | 30/28 | 47 | 39 | 0.57 | 21/17 | 8.6/7.6 | 0.94 | 0.86 | 12/13 | 30.1/20.4 | 0.70 | 0.38 |
PTEN‐High/low cutoff based on median values (≤ vs. >35).
HGF‐High/low cutoff based on median values (≤ vs. >1,415.9 pg/mL).
Abbreviations: CETIRI, cetuximab plus irinotecan; CR, complete response; HGF, hepatocyte growth factor; NE, not evaluated; P, CETIRI plus placebo; PFS, progression‐free survival; ORR, objective response rate; OS, overall survival; T, CETIRI plus tivantinib.
In a post hoc exploratory analysis of patients who received first‐line oxaliplatin‐based chemotherapy, tivantinib (n = 47) was associated with improvements in both PFS (Supporting Information Fig. 1A) and OS (Supporting Information Fig. 1B) compared with placebo (n = 48). In this subgroup, ORR was 42.6 vs. 27.1%, respectively, and median OS was 22.3 vs. 14.1 months, respectively (HR, 0.58; P = 0.06).
Safety
In the phase 1 portion, there were no DLTs. In the phase 2 portion, the most common reasons for treatment discontinuation (Fig. 1) were disease progression (54.8% tivantinib vs. 46.7% placebo) and AEs (19.4% tivantinib vs. 10.0% placebo). Discontinuation because of a drug‐related AE was reported in two patients (3.2%) in the tivantinib group and four patients (6.8%) in the placebo group. The average total daily tivantinib exposure was approximately 690 mg (mean duration, 29.7 weeks or 7.4 cycles) compared with placebo exposure of approximately 643 mg (mean duration, 25.4 weeks or 6.4 cycles). The median duration and treatment intensity of CETIRI were similar in the tivantinib and placebo groups.
In the phase 2 portion of the study, the most common AEs (all grades) were rash and diarrhea, and the incidence was similar in the two treatment groups (Table 4). Infections occurred more frequently in the tivantinib group (50%) than in the placebo group (37%). Likewise, cardiac disorders, such as atrial fibrillation and bradycardia, (mostly grade 1/2) occurred more frequently in the tivantinib group (16 vs. 7%); one grade 3 event was reported in each treatment group. The most common grade 3/4 AEs in the tivantinib and placebo groups were neutropenia (19 and 10%, respectively), diarrhea (13 and 9%, respectively), nausea (10 and 7%, respectively) and rash (8% in each group).
Table 4.
Adverse events ≥5% by treatment groupa
| All grades | Grade ≥3 | |||||||
|---|---|---|---|---|---|---|---|---|
| Tivantinib (N = 62) | Placebo (N = 59) | Tivantinib (N = 62) | Placebo (N = 59) | |||||
| n | % | n | % | n | % | n | % | |
| Any adverse event | 62 | 100 | 59 | 100 | 40 | 65 | 34 | 58 |
| Rash | 36 | 58 | 34 | 58 | 5 | 8 | 5 | 8 |
| Diarrhea | 33 | 53 | 30 | 51 | 8 | 13 | 5 | 9 |
| Infections/infestations (SOC) | 31 | 50 | 22 | 37 | 8 | 13 | 3 | 5 |
| Nausea | 27 | 44 | 27 | 46 | 6 | 10 | 4 | 7 |
| Fatigue | 24 | 39 | 20 | 34 | 3 | 5 | 2 | 3 |
| Vomiting | 20 | 32 | 18 | 30 | 3 | 5 | 3 | 5 |
| Neutropenia | 18 | 29 | 12 | 20 | 12 | 19 | 6 | 10 |
| Alopecia | 16 | 26 | 14 | 24 | NA | NA | NA | NA |
| Abdominal pain | 12 | 19 | 15 | 25 | 0 | 0 | 4 | 7 |
| Dry skin | 11 | 18 | 10 | 17 | 0 | 0 | 0 | 0 |
| Decreased appetite | 11 | 18 | 7 | 12 | 1 | 2 | 1 | 2 |
| Dermatitis acneiform | 8 | 13 | 9 | 15 | 1 | 2 | 1 | 2 |
| Constipation | 10 | 16 | 11 | 19 | 0 | 0 | 0 | 0 |
| Cardiac disorders (SOC) | 10 | 16 | 4 | 7 | 1 | 2 | 1 | 2 |
| Cough | 6 | 10 | 6 | 10 | 0 | 0 | 0 | 0 |
| Anemia | 7 | 11 | 18 | 30 | 3 | 5 | 2 | 3 |
| Headache | 7 | 11 | 4 | 7 | 2 | 3 | 0 | 0 |
| Dehydration | 7 | 11 | 6 | 10 | 2 | 3 | 0 | 0 |
| Hypomagnesemia | 6 | 10 | 6 | 10 | 0 | 0 | 0 | 0 |
| Stomatitis | 7 | 11 | 4 | 7 | 4 | 6 | 0 | 0 |
| Insomnia | 7 | 11 | 4 | 7 | 0 | 0 | 0 | 0 |
| Asthenia | 8 | 13 | 6 | 10 | 1 | 2 | 3 | 5 |
| Peripheral edema | 6 | 10 | 5 | 8 | 0 | 0 | 2 | 3 |
| Leukopenia | 5 | 8 | 3 | 5 | 2 | 3 | 1 | 2 |
| Palmar–plantar erythrodysesthesia syndrome | 4 | 6 | 0 | 0 | 2 | 3 | 0 | 0 |
| Hyperglycemia | 4 | 6 | 6 | 10 | 3 | 5 | 1 | 2 |
| Hypokalemia | 2 | 3 | 5 | 8 | 0 | 0 | 3 | 5 |
| Small intestinal obstruction | 2 | 3 | 4 | 7 | 2 | 3 | 4 | 7 |
Patients may have had more than one event.
≥10% for adverse events and two or more patients for grade 3/4 adverse events.
Abbreviations: NA: not applicable; SOC: Medical Dictionary for Regulatory Activities (MedDRA) system organ class.
A similar proportion of patients in the tivantinib and placebo groups had drug‐related AEs: 45 patients (72.6%) and 41 patients (69.5%), respectively. The most frequently reported drug‐related AEs (all grades) were fatigue, nausea (44% each); and neutropenia, vomiting, rash (22% each). Drug‐related grade 4 AEs were reported for one patient (1.6%) on tivantinib and three patients (5.1%) on placebo. Serious AEs (SAEs) were reported in three patients (4.8%) on tivantinib, including dehydration and neutropenia, nail disorder/onychalgia and febrile neutropenia and vomiting. Two patients experienced SAEs related only to irinotecan (neutropenia and anemia). In the placebo group, one patient (1.7%) experienced a drug‐related SAE (urinary tract infection). A similar proportion of patients had treatment‐emergent AEs leading to death in the tivantinib (6.5%; n = 4) and placebo groups (5.1%; n = 3). No death was considered study‐drug related.
Health‐related quality of life
A summary of baseline FACT‐C scores and change from baseline to Cycle 3 or EOT by treatment group is shown in Supporting Information Table 1. Similar changes in mean FACT‐C scores from baseline to Cycle 3 Day 1 and EOT were observed in both treatment groups.
Exploratory biomarker analysis
Mean decreases from baseline in serum MET and HGF and mean increases from baseline in serum VEGF were observed at the EOT assessment in both treatment groups.
Discussion
Recent evidence indicates the MET signaling pathway may play an important role in CRC growth and metastasis,26, 32, 33 is associated with more advanced metastatic disease and tumor stage,34, 35 and may mediate resistance to EGFR inhibitors.36, 37 Dual MET and EGFR blockade could potentially provide more durable clinical benefit in mCRC, which led to the investigation of new MET‐targeting agents, including tivantinib. Preclinical findings suggest that tivantinib may also affect the cytoskeleton, and recent studies show this may happen via MET and paxillin inhibition.38, 39, 40, 41 However, tivantinib is being developed as a MET inhibitor based on crystallographic binding data.
Enrollment in the randomized, phase 2 portion of this study was reduced from the originally planned 150 patients to 122 patients, and the PFS primary endpoint was not met. Nevertheless, tivantinib in combination with CETIRI did demonstrate potential clinical activity in subgroups of patients. All of these subgroup analyses are exploratory and the subgroups are small; therefore, the results should be interpreted with caution. These exploratory subgroup analyses indicated a potential benefit associated with tivantinib in patients whose tumor was MET‐High or PTEN‐Low or in patients who received prior oxaliplatin‐based chemotherapy. Among patients with MET‐High tumors, tivantinib was associated with a trend toward improved ORR, PFS and OS. The observation of improved PFS in patients with MET‐Low tumors, despite no improvement in ORR or OS and no other clinical evidence to support these results, suggests that the sample size may be too small to provide definitive information. In contrast, the observed outcomes among patients with MET‐High tumors are consistent with data from two multicenter, double‐blinded, randomized, placebo‐controlled studies in patients with advanced hepatocellular carcinoma (HCC) and nonsquamous nonsmall cell lung cancer (NSCLC) that demonstrated significant PFS and OS benefits associated with tivantinib in patients with MET‐High tumors but no benefit in those with MET‐Low tumors.42, 43 Moreover, in a randomized, double‐blinded, placebo‐controlled study in metastatic castration‐resistant prostate cancer (expressing high MET levels), tivantinib conferred a statistically significant PFS benefit compared with placebo.44 These data suggest that MET expression may be predictive of benefit across tumor types. The implications of the results in patients with PTEN‐Low tumors are unclear because recent studies in patients with colorectal cancer receiving cetuximab‐based therapy have yielded conflicting results regarding the influence of PTEN status on PFS or OS.45, 46, 47 However, a recent meta‐analysis suggested that nonfunctional PTEN predicts resistance to anti‐EGFR therapies such as cetixumab48; theoretically, a MET inhibitor may overcome that resistance.18, 19, 49 Indeed, clinical evidence from a phase 2 study in nonsmall cell lung cancer suggests that patients who progressed on erlotinib can achieve an objective response to subsequent treatment with erlotinib plus tivantinib.50
The safety profile of tivantinib in combination with CETIRI in patients with mCRC was consistent with previous studies of tivantinib monotherapy and combination regimens in other tumor types.31, 50, 51, 52, 53, 54 Similar to the current study, the most common AEs reported with the combination of tivantinib and another EGFR inhibitor were rash, fatigue, nausea and diarrhea, while no peripheral neurotoxicity was observed.50, 52 Severe AEs included neutropenia, and although the literature indicates a critical role of MET in the maturation of bone marrow progenitors, the mechanism for tivantinib‐associated neutropenia has not been studied.
Limitations of this study should be addressed in future clinical trials. The study was not powered to detect OS differences. Consequently, the estimated 30% reduction in risk of death with addition of tivantinib did not reach statistical significance. Additional RAS testing should be conducted in these tumors; the presence of rare RAS mutations can confer resistance to EGFR inhibitors.55, 56 Finally, adequate tissue samples for evaluation of MET expression were only available from 67 patients (55%) in phase 2. Evidence suggests that MET overexpression is a later event in tumor growth/metastasis; therefore, MET may be a predictive biomarker in advanced disease.36, 57 A repeat biopsy at disease progression would identify changes in the pathways of interest and provide information on the pathophysiologic effects of treatment and eventual drug resistance. Thus, interpretation of the biomarker data in the current study is limited by the small sample size in the subgroups, limited tissue availability and use of tissue from different sources. Consistent collection of uniform tissue and blood from all patients would provide more robust correlative outcome assessments. Internal data show MET expression by IHC becomes less visible in slides cut over 6 months from the analysis. In addition, a centralized, strict and uniform interpretation of IHC results and the use of validated antibodies, as done in this study, is critical for this technique to be of practical use. The encouraging results observed in patients with MET‐High tumors who were treated with tivantinib in this and previous trials42, 43, 44 support patient selection and suggest that future studies should require tumor tissue as an enrollment criterion. Two ongoing phase 3 studies are following this approach in patients with advanced HCC: the METIV‐HCC (NCT01755767) and JET‐HCC (NCT02029157) studies.
Additional data are necessary to define the clinical benefit of MET inhibition in patients with mCRC and may be provided by ongoing studies. A phase 1/2 study is currently evaluating tivantinib in combination with FOLFOX in patients with advanced solid tumors (NCT01611857).58 A phase 2 study of tivantinib monotherapy is currently enrolling patients with MET‐High, KRAS wild‐type mCRC previously treated with cetuximab or panitumumab (NCT01892527).59 Fresh tumor biopsy tissue for biomarker analysis will be collected to study pathophysiologic changes after treatment.
In conclusion, adding tivantinib to CETIRI did not significantly improve PFS or OS in patients with previously treated, KRAS wild‐type mCRC. Nevertheless, given the promising results observed in the exploratory subgroup analyses, especially in the MET‐High subgroup, and supporting data from other studies, MET inhibitors warrant further study in selected patients with mCRC.
Abbreviations
- 5‐FU
5‐fluorouracil
- AEs
adverse events
- AKT
protein kinase B
- ARQ 197
tivantinib
- BID
twice daily
- CETIRI
cetuximab plus irinotecan
- CI
confidence interval
- CLIA
Clinical Laboratory Improvement Amendments
- CRC
colorectal cancer
- CT
computed tomography
- CTCAE
Common Toxicity Criteria for Adverse Events
- DLT
dose‐limiting toxicities
- ECOG
Eastern Cooperative Oncology Group
- EGFR
epidermal growth factor receptor
- EOT
end of the treatment visit
- FACT‐C
Functional Assessment of Cancer Therapy‐Colorectal
- FLP
5‐fluorouracil: leucovorin: and cisplatin
- HCC
hepatocellular carcinoma
- HGF
hepatocyte growth factor
- HR
hazard ratios
- HRQOL
health‐related quality of life
- IHC
immunohistochemistry
- IV
intravenously
- KRAS WT
KRAS wild‐type
- MAP
MAP kinase
- mCRC
metastatic colorectal cancer
- MedDRA
Medical Dictionary for Regulatory Activities
- MET
MNNG HOS transforming gene
- MRI
magnetic resonance imaging
- mTOR
mammalian target of rapamycin
- NCI
National Cancer Institute
- NSCLC
non‐small cell lung cancer
- ORR
objective response rate
- OS
overall survival
- PFS
progression‐free survival
- PI3K
phosphatidylinositol 3‐kinase
- PK
pharmacokinetics
- RECIST
Response Evaluation Criteria In Solid Tumors
- RP2D
recommended phase 2 dose
- SAEs
serious adverse events
- VEGF
vascular endothelial growth factor
Supporting information
Supporting Information
Acknowledgements
The corresponding author had full access to all the data and analyses. C.E. declares research institution received funding from Pfizer; L.L.H. declares receiving honoraria and speakers' bureau from Genentech, Novartis, Onyx, research institution received funding from Sarah Cannon Research Institute; O.G. declares receiving research funding from Daiichi Sankyo, Inc.; M.V.K. declares receiving honoraria from F. Hoffmann‐La Roche Ltd, Amgen, Eisai, received research funding from F. Hoffmann‐La Roche Ltd, Amgen, Alchemia and received travel, accommodations and expenses from F. Hoffmann‐La Roche Ltd and Pierre Fabre; R.L. declares research institution received funding from Lexicon, Incyte, Pharmacyclics, Genentech, Sanofi Aventis; C.H. declares employment with Daiichi Sankyo, Inc.; E.B. declares employment and stock or other ownership interests with Bayer HealthCare, and was employed at Daiichi Sankyo, Inc. at the time of the study; R.v.R. declares employment with Daiichi Sankyo, Inc.; Brian Schwartz declares employment, leadership role and stock or other ownership interests with ArQule. A.B., A.S., L.M., V.V., B.K., S.B. and J.C.B. have declared no conflicts of interest. All authors approve the final decision to submit for publication.
This study was sponsored by Daiichi Sankyo, Inc., a member of the Daiichi Sankyo Group and ArQule, Inc. Financial support for medical editorial assistance was provided by Daiichi Sankyo, Inc., and ArQule, Inc. The authors thank Giovanni Abbadessa, MD, PhD, Vice President (Clinical Development, Translational Medicine, Medical Affairs), ArQule, Inc., for critical review, and Tamalette Loh, PhD, Accuverus, Inc., for medical editorial assistance with this manuscript.
References
- 1. Benson AB, III. Epidemiology, disease progression, and economic burden of colorectal cancer. J Manag Care Pharm 2007; 13(suppl c):S5–18. [DOI] [PMC free article] [PubMed] [Google Scholar]
- 2. Van Cutsem E, Nordlinger B, Cervantes A, et al. Advanced colorectal cancer: ESMO clinical practice guidelines for treatment. Ann Oncol: 2010;21(suppl5):v93–7. [DOI] [PubMed] [Google Scholar]
- 3. National Cancer Institute . Surveillance, Epidemiology, and End Results Stat Fact sheets: Colon and Rectum Cancer. http://seer.cancer.gov/statfacts/html/colorect.html.
- 4. Benson AB, III , Bekaii‐Saab T, Chan E, et al. Metastatic colon cancer, version 3.2013: featured updates to the NCCN Guidelines. J Natl Compr Canc Netw 2013; 11:141–52. quiz 52. [DOI] [PubMed] [Google Scholar]
- 5. Pfeiffer P, Nielsen D, Bjerregaard J, et al. Biweekly cetuximab and irinotecan as third‐line therapy in patients with advanced colorectal cancer after failure to irinotecan, oxaliplatin and 5‐fluorouracil. Ann Oncol 2008; 19:1141–5. [DOI] [PubMed] [Google Scholar]
- 6. Douillard JY, Siena S, Cassidy J, et al. Final results from PRIME: randomized phase III study of panitumumab with FOLFOX4 for first‐line treatment of metastatic colorectal cancer. Ann Oncol 2014; 25:1346–55. [DOI] [PubMed] [Google Scholar]
- 7. Cunningham D, Humblet Y, Siena S, et al. Cetuximab monotherapy and cetuximab plus irinotecan in irinotecan‐refractory metastatic colorectal cancer. N Engl J Med 2004; 351:337–45. [DOI] [PubMed] [Google Scholar]
- 8. Bristol‐Myers Squibb, Eli Lilly, ImClone . Erbitux (cetuximab) prescribing information 2013. Available at: http://www.drugs.com/pro/erbitux.html.
- 9. Van Cutsem E, Kohne CH, Hitre E, et al. Cetuximab and chemotherapy as initial treatment for metastatic colorectal cancer. N Engl J Med 2009; 360:1408–17. [DOI] [PubMed] [Google Scholar]
- 10. Van Cutsem E, Kohne CH, Lang I, et al. Cetuximab plus irinotecan, fluorouracil, and leucovorin as first‐line treatment for metastatic colorectal cancer: updated analysis of overall survival according to tumor KRAS and BRAF mutation status. J Clin Oncol 2011; 29:2011–9. [DOI] [PubMed] [Google Scholar]
- 11. Chong CR, Janne PA. The quest to overcome resistance to EGFR‐targeted therapies in cancer. Nat Med 2013; 19:1389–400. [DOI] [PMC free article] [PubMed] [Google Scholar]
- 12. Misale S, Yaeger R, Hobor S, et al. Emergence of KRAS mutations and acquired resistance to anti‐EGFR therapy in colorectal cancer. Nature 2012; 486:532–6. [DOI] [PMC free article] [PubMed] [Google Scholar]
- 13. Chang DZ, Kumar V, Ma Y, et al. Individualized therapies in colorectal cancer: KRAS as a marker for response to EGFR‐targeted therapy. J Hematol Oncol 2009; 2:18 [DOI] [PMC free article] [PubMed] [Google Scholar]
- 14. De Roock W, Piessevaux H, De Schutter J, et al. KRAS wild‐type state predicts survival and is associated to early radiological response in metastatic colorectal cancer treated with cetuximab. Ann Oncol 2008; 19:508–15. [DOI] [PubMed] [Google Scholar]
- 15. Lievre A, Bachet JB, Boige V, et al. KRAS mutations as an independent prognostic factor in patients with advanced colorectal cancer treated with cetuximab. J Clin Oncol 2008; 26:374–9. [DOI] [PubMed] [Google Scholar]
- 16. Walther A, Johnstone E, Swanton C, et al. Genetic prognostic and predictive markers in colorectal cancer. Nat Rev Cancer 2009; 9:489–99. [DOI] [PubMed] [Google Scholar]
- 17. Karapetis CS, Khambata‐Ford S, Jonker DJ, et al. K‐ras mutations and benefit from cetuximab in advanced colorectal cancer. N Engl J Med 2008; 359:1757–65. [DOI] [PubMed] [Google Scholar]
- 18. Bardelli A, Corso S, Bertotti A, et al. Amplification of the MET receptor drives resistance to anti‐EGFR therapies in colorectal cancer. Cancer Discov 2013; 3:658–73. [DOI] [PMC free article] [PubMed] [Google Scholar]
- 19. Inno A, Di Salvatore M, Cenci T, et al. Is there a role for IGF1R and c‐MET pathways in resistance to cetuximab in metastatic colorectal cancer? Clin Colorectal Cancer 2011; 10:325–32. [DOI] [PubMed] [Google Scholar]
- 20. Liska D, Chen CT, Bachleitner‐Hofmann T, et al. HGF rescues colorectal cancer cells from EGFR inhibition via MET activation. Clin Cancer Res 2011; 17:472–82. [DOI] [PMC free article] [PubMed] [Google Scholar]
- 21. Luraghi P, Reato G, Cipriano E, et al. MET signaling in colon cancer stem‐like cells blunts the therapeutic response to EGFR inhibitors. Cancer Res 2014; 74:1857–69. [DOI] [PubMed] [Google Scholar]
- 22. De Oliveira AT, Matos D, Logullo AF, et al. MET is highly expressed in advanced stages of colorectal cancer and indicates worse prognosis and mortality. Anticancer Res 2009; 29:4807–11. [PubMed] [Google Scholar]
- 23. Garouniatis A, Zizi‐Sermpetzoglou A, Rizos S, et al. FAK, CD44v6, c‐Met and EGFR in colorectal cancer parameters: tumour progression, metastasis, patient survival and receptor crosstalk. Int J Colorectal Dis 2013; 28:9–18. [DOI] [PubMed] [Google Scholar]
- 24. Liu Y, Li Q, Zhu L. Expression of the hepatocyte growth factor and c‐Met in colon cancer: correlation with clinicopathological features and overall survival. Tumori 2012; 98:105–12. [DOI] [PubMed] [Google Scholar]
- 25. Voutsina A, Tzardi M, Kalikaki A, et al. Combined analysis of KRAS and PIK3CA mutations, MET and PTEN expression in primary tumors and corresponding metastases in colorectal cancer. Mod Pathol 2013; 26:302–13. [DOI] [PubMed] [Google Scholar]
- 26. Abou‐Bakr AA, Elbasmi A. c‐MET overexpression as a prognostic biomarker in colorectal adenocarcinoma. Gulf J Oncol 2013; 1:28–34. [PubMed] [Google Scholar]
- 27. Chang HY, Kao MC, Way TD, et al. Diosgenin suppresses hepatocyte growth factor (HGF)‐induced epithelial‐mesenchymal transition by down‐regulation of Mdm2 and vimentin. J Agric Food Chem 2011; 59:5357–63. [DOI] [PubMed] [Google Scholar]
- 28. Yao YL, Shao J, Zhang C, et al. Proliferation of colorectal cancer is promoted by two signaling transduction expression patterns: ErbB2/ErbB3/AKT and MET/ErbB3/MAPK. PLoS One 2013; 8:e78086 [DOI] [PMC free article] [PubMed] [Google Scholar]
- 29. Chen HJ, Jiang YL, Lin CM, et al. Dual inhibition of EGFR and c‐Met kinase activation by MJ‐56 reduces metastasis of HT29 human colorectal cancer cells. Int J Oncol 2013; 43:141–50. [DOI] [PubMed] [Google Scholar]
- 30. Yap TA, Olmos D, Brunetto AT, et al. Phase I trial of a selective c‐MET inhibitor ARQ 197 incorporating proof of mechanism pharmacodynamic studies. J Clin Oncol 2011; 29:1271–9. [DOI] [PubMed] [Google Scholar]
- 31. Adjei AA, Schwartz B, Garmey E. Early clinical development of ARQ 197, a selective, non‐ATP‐competitive inhibitor targeting MET tyrosine kinase for the treatment of advanced cancers. Oncologist 2011; 16:788–99. [DOI] [PMC free article] [PubMed] [Google Scholar]
- 32. Munshi N, Jeay S, Li Y, et al. ARQ 197, a novel and selective inhibitor of the human c‐Met receptor tyrosine kinase with antitumor activity. Mol Cancer Ther 2010; 9:1544–53. [DOI] [PubMed] [Google Scholar]
- 33. Scagliotti GV, Novello S, von Pawel J. The emerging role of MET/HGF inhibitors in oncology. Cancer Treat Rev 2013; 39:793–801. [DOI] [PubMed] [Google Scholar]
- 34. Kammula US, Kuntz EJ, Francone TD, et al. Molecular co‐expression of the c‐Met oncogene and hepatocyte growth factor in primary colon cancer predicts tumor stage and clinical outcome. Cancer Lett 2007; 248:219–28. [DOI] [PubMed] [Google Scholar]
- 35. Zeng ZS, Weiser MR, Kuntz E, et al. c‐Met gene amplification is associated with advanced stage colorectal cancer and liver metastases. Cancer Lett 2008; 265:258–69. [DOI] [PMC free article] [PubMed] [Google Scholar]
- 36. Samame Perez‐Vargas JC, Biondani P, Maggi C, et al. Role of cMET in the development and progression of colorectal cancer. Int J Mol Sci 2013; 14:18056–77. [DOI] [PMC free article] [PubMed] [Google Scholar]
- 37. Song N, Liu S, Zhang J, et al. Cetuximab‐induced MET activation acts as a novel resistance mechanism in colon cancer cells. Int J Mol Sci 2014; 15:5838–51. [DOI] [PMC free article] [PubMed] [Google Scholar]
- 38. Aoyama A, Katayama R, Oh‐Hara T, et al. Tivantinib (ARQ 197) exhibits antitumor activity by directly interacting with tubulin and overcomes ABC transporter‐mediated drug resistance. Mol Cancer Ther 2014; 13:2978–90. [DOI] [PubMed] [Google Scholar]
- 39. Kanteti R, Dhanasingh I, Kawada I, et al. MET and PI3K/mTOR as a potential combinatorial therapeutic target in malignant pleural mesothelioma. PLoS One 2014; 9:e105919 [DOI] [PMC free article] [PubMed] [Google Scholar]
- 40. Katayama R, Aoyama A, Yamori T, et al. Cytotoxic activity of tivantinib (ARQ 197) is not due solely to c‐MET inhibition. Cancer Res 2013; 73:3087–96. [DOI] [PMC free article] [PubMed] [Google Scholar]
- 41. Kumar KS, Tripolitsioti D, Ma M, et al. The Ser/Thr kinase MAP4K4 drives c‐Met‐induced motility and invasiveness in a cell‐based model of SHH medulloblastoma. SpringerPlus 2015; 4:19 [DOI] [PMC free article] [PubMed] [Google Scholar]
- 42. Santoro A, Rimassa L, Borbath I, et al. Tivantinib for second‐line treatment of advanced hepatocellular carcinoma: a randomised, placebo‐controlled phase 2 study. Lancet Oncol 2013; 14:55–63. [DOI] [PubMed] [Google Scholar]
- 43. Scagliotti G, von Pawel J, Novello S, et al. Phase III multinational, randomized, double‐blind, placebo‐controlled study of tivantinib (ARQ 197) plus erlotinib versus erlotinib alone in previously treated patients with locally advanced or metastatic nonsquamous non‐small‐cell lung cancer. J Clin Oncol 2015; 33:2667–74. [DOI] [PubMed] [Google Scholar]
- 44. Monk P, Liu G, Stadler WM, et al. Phase II randomized, double‐blind, placebo‐controlled study of tivantinib in men with asymptomatic or minimally symptomatic metastatic castrate‐resistant prostate cancer (mCRPC). J Clin Oncol 2015; 33: Abstract 146. [Google Scholar]
- 45. Personeni N, Rimassa L, Verusio C, et al. FOLFIRI and cetuximab every second week for first‐line treatment of KRAS wild‐type metastatic colorectal cancer according to phosphatase and tensin homolog expression: a phase II study. Clin Colorectal Cancer 2015; 14:162–9. [DOI] [PubMed] [Google Scholar]
- 46. Tural D, Batur S, Erdamar S, et al. Analysis of PTEN, BRAF and PI3K status for determination of benefit from cetuximab therapy in metastatic colorectal cancer patients refractory to chemotherapy with wild‐type KRAS. Tumour Biol 2014; 35:1041–9. [DOI] [PubMed] [Google Scholar]
- 47. Loupakis F, Pollina L, Stasi I, et al. PTEN expression and KRAS mutations on primary tumors and metastases in the prediction of benefit from cetuximab plus irinotecan for patients with metastatic colorectal cancer. J Clin Oncol 2009; 27:2622–9. [DOI] [PubMed] [Google Scholar]
- 48. Therkildsen C, Bergmann TK, Henrichsen‐Schnack T, et al. The predictive value of KRAS, NRAS, BRAF, PIK3CA and PTEN for anti‐EGFR treatment in metastatic colorectal cancer: a systematic review and meta‐analysis. Acta Oncol 2014; 53:852–64. [DOI] [PubMed] [Google Scholar]
- 49. Engelman JA, Zejnullahu K, Mitsudomi T, et al. MET amplification leads to gefitinib resistance in lung cancer by activating ERBB3 signaling. Science 2007; 316:1039–43. [DOI] [PubMed] [Google Scholar]
- 50. Sequist LV, von Pawel J, Garmey EG, et al. Randomized phase II study of erlotinib plus tivantinib versus erlotinib plus placebo in previously treated non‐small‐cell lung cancer. J Clin Oncol 2011; 29:3307–15. [DOI] [PubMed] [Google Scholar]
- 51. Feldman DR, Einhorn LH, Quinn DI, et al. A phase 2 multicenter study of tivantinib (ARQ 197) monotherapy in patients with relapsed or refractory germ cell tumors. Invest New Drugs 2013; 31:1016–22. [DOI] [PubMed] [Google Scholar]
- 52. Goldman JW, Laux I, Chai F, et al. Phase 1 dose‐escalation trial evaluating the combination of the selective MET (mesenchymal‐epithelial transition factor) inhibitor tivantinib (ARQ 197) plus erlotinib. Cancer 2012; 118:5903–11. [DOI] [PubMed] [Google Scholar]
- 53. Kang YK, Muro K, Ryu MH, et al. A phase II trial of a selective c‐Met inhibitor tivantinib (ARQ 197) monotherapy as a second‐ or third‐line therapy in the patients with metastatic gastric cancer. Invest New Drugs 2014; 32:355–61. [DOI] [PubMed] [Google Scholar]
- 54. Trojan J, Zeuzem S. Tivantinib in hepatocellular carcinoma. Expert Opin Investig Drugs 2013; 22:141–7. [DOI] [PubMed] [Google Scholar]
- 55. de Macedo MP, de Lima LG, Begnami MD, et al. KRAS insertions in colorectal cancer: what do we know about unusual KRAS mutations? Exp Mol Pathol 2014; 96:257–60. [DOI] [PubMed] [Google Scholar]
- 56. Tong JH, Lung RW, Sin FM, et al. Characterization of rare transforming mutations in sporadic colorectal cancer. Cancer Biol Ther 2014; 15:768–76. [DOI] [PMC free article] [PubMed] [Google Scholar]
- 57. Zorzetto M, Ferrari S, Saracino L, et al. MET genetic lesions in non‐small‐cell lung cancer: pharmacological and clinical implications. Transl Lung Cancer Res 2012; 1:194–207. [DOI] [PMC free article] [PubMed] [Google Scholar]
- 58. SCRI Development Innovations LLC, Daiichi Sankyo Inc. A phase I/II trial of the c‐Met inhibitor, tivantinib, in combination with FOLFOX for the treatment of patients with advanced solid tumors (phase I) and previously untreated metastatic adenocarcinoma of the distal esophagus, gastroesophageal (GE) junction, or stomach (phase II). http://www.clinicaltrials.gov/ct2/show/NCT01611857?term=NCT01611857&rank=1. [DOI] [PubMed]
- 59. Santoro A, Rimassa L. A single‐arm phase II study of tivantinib (ARQ 197) plus cetuximab in EGFR inhibitor‐resistant MET high subjects with locally advanced or metastatic colorectal cancer with wild‐type KRAS http://www.clinicaltrials.gov/ct2/show/NCT01892527?term=tivantinib&cond=colorectal&rank=2.
Associated Data
This section collects any data citations, data availability statements, or supplementary materials included in this article.
Supplementary Materials
Supporting Information