Abstract
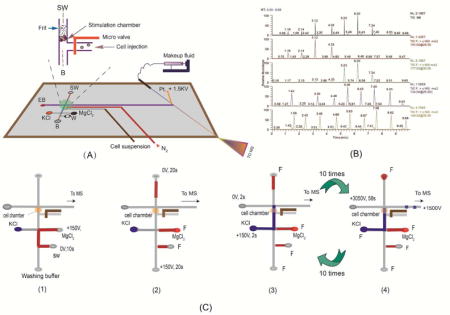
Chemical stimulus-induced neurotransmitter release from neuronal cells is well documented. However, the dynamic changes in neurochemical release remain to be fully explored. In this work, a three-layered microfluidic chip was fabricated and evaluated for studying the dynamics of neurotransmitter release from PC-12 cells. The chip features integration of a nanoliter sized chamber for cell perfusion, pneumatic pressure valves for fluidic control, a microfluidic channel for electrophoretic separation, and a nanoelectrospray emitter for ionization in MS detection. Deploying this platform, a microchip electrophoresismass spectrometric method (MCE-MS) was developed to simultaneously quantify important neurotransmitters, including dopamine (DA), serotonin (5-HT), aspartic acid (Asp), and glutamic acid (Glu) without need for labeling or enrichment. Monitoring neurotransmitter release from PC-12 cells exposed to KCl (or alcohol) revealed that all the four neurotransmitters investigated were released. Two release patterns were observed, one for the two monoamine neurotransmitters (i.e. DA and 5-HT), and another for the two amino acid neurotransmitters. Release dynamics for the two monoamine neurotransmitters was significantly different. The cells released DA most quickly and heavily in response to the stimulation. After exposure to the chemical stimulus for 4 min, DA level in the perfusate from the cells was 86% lower than that at the beginning. Very interestingly, the cells started to release 5-HT in large quantities when they stopped releasing DA. These results suggest that DA and 5-HT are packaged into different vesicle pools and they are mobilized differently in response to chemical stimuli. The microfluidic platform proposed is proven useful for monitoring cellular release in biological studies.
Keywords: Microfluidic chip, Electrophoresis, Mass Spectrometry, Neurotransmitter Release, Serotonin, dopamine, PC-12 cells
Graphical abstract
1. Introduction
Neurotransmitters are involved in a variety of physiological processes, including memory, learning, and response to diseases.1 Exocytotic release of neurotransmitters into the extracellular environment is one of the defining mechanisms of intercellular communication.2,3 When an appropriate chemical signal is received, a nerve cell may release neurotransmitters. Therefore, understanding the fundamental characteristics and dynamic behavior of neurotransmitter release from cells is highly significant.4 Study of nerve cell signaling release can be a challenge because only a fraction of the mass-limited neurotransmitter content within a cell is released upon stimulation, i.e. the sample amounts can be so small that hard to be detected.5 A considerable attention has been given to analysis of neurotransmitters released from cells.6 Analytical methods based on cell imaging,7,8 fluorescence9 and electrochemical10 techniques were developed. Electrochemical sensors implanted into the brain provide chemical information from a specific location, and are especially useful for in vivo monitoring of neurotransmitter release.11 Scan cyclic voltammetry can be used to monitor changes in release and uptake rates in real time.12 Mass spectrometry (MS) is a powerful tool for cell release assay due to its high selectivity and ability to perform label-free detection.13 Electrospray ionization mass spectrometry (ESI-MS) was previously applied to neurotransmitter release study.14,15 ESI-MS analysis of neurotransmitter release offers another major advantage, i.e. by using multiple reaction monitoring (MRM) detection mode multiple targeted molecules can be detected at the same time.16
Microfluidic devices have unique advantages when applied in bioassays, including ultrafast separation,17 automation18,19 and functional integration.20,21 They have been used in studying nerve cell release.22–24 Because the channel scale in a microfluidic chip is fitted to the size of most cells, effective time-resolved analysis of cell release can be achieved. With the technical advancement in microvalving and chemical gradients, these devices become enabling platforms for investigating cellular environments and for identifying key signaling molecules. Microchip electrophoresis (MCE), a miniaturized version of capillary electrophoresis, is a powerful separation technique with many advantages of microfluidic devices. Coupling MCE with electrospray ionization mass spectrometry (MCE-MS) has been receiving increasing research attention.25–27
The aim of this work was to develop a microfluidic platform with in-chip MCE-MS analytical capability for studying neurochemical release from neuronal systems. A three layered microfluidic chip was designed and fabricated to integrate the needed experimental operations, including cell injection /loading, cell nano-perfusion, MCE separation of the perfusate, and nano-electrospay ionization for MS detection of the separated neurochemicals into one platform. Test conditions and computerized automation of all the procedural operations were investigated. With the proposed microfluidic platform a large number of data were collected from studying PC-12 neuronal cells under stimulation of stimuli such as KCl and alcohol. Pheochromocytoma-derived PC-12 cell line is a well-established in vitro model for studies of regulated secretion in neuronal cells.28 Release of four major neurotransmitters from the cells, i.e. dopamine (DA), serotonin (5-HT), aspartic acid (Asp) and glutamic acid (Glu) was quantified for stimulation duration of 10 min to elucidate the release dynamics.
2. Experimental
2.1. Reagents and materials
5-HT, DA, Glu, and Asp were purchased from Sigma-Aldrich (St. Louis, MO). Polydimethylsiloxane (PDMS) pre-polymer kit (Sylgard 184) was purchased from Dow Corning (Midland, MI). The fused silica capillaries (254 um ID, 360 um OD) were obtained from Polymicro Technologies (Tucson, AZ). Glass slides were obtained from Silicon Valley Microelectronics (Santa Clara, CA). Negative photoresist SU-8 2010 and developer were obtained from MicroChem Corp. (Newtown, MA). Hexamethyldisilazane (HMDS) was purchased from Ultra Pure Solutions (Castroville, CA). Two types of PBS were used in the experiments. Type one of PBS (PBS1) contained 0.14M NaCl, 2.08mM KCl, 9.25mM Na2HPO4, and 1.76 mM KH2PO4. Type two of PBS (PBS2) contained 0.14M NaCl, 35mM (or 15mM) KCl, 3.25mM Na2HPO4, and 1.76mM KH2PO4. PBS1 was used to dilute and wash cells, and PBS2 was used to stimulate the PC-12 cells. The pH of all those solutions was adjusted to 7.4 by using 1M NaOH. Milli-Q water was used throughout the work. All solutions were filtered through a nylon 0.22 μm syringe filter before use unless otherwise described.
2.2. Cell culture and cellular sample pretreatment
Rat PC-12 cells were cultured in complete RPMI-1640 media supplemented with 10% heat inactivated horse serum, 5% fetal bovine serum(FBS) and 1% penicillin streptomycin solution in a 5% CO2,100% humidity atmosphere at 37°C. The cells were routinely sub-cultured every 4–5 days. The monolayers of single PC-12 cells gradually organized themselves into clusters in which cells retained their individual round shape indicative of a non–differentiated phenotype. The medium was replaced every 2 days throughout the lifetime for all cultures. The density of cells was maintained at 5×10⁵ cells mL−1 using a hemocytometer under an inverted microscope. The cell viability was determined using 0.25% trypan blue. For a stimulation test, 250μL of cell suspension was diluted to 1.5mL with PBS1, centrifuged for 1000 rpm for 3 minutes and repeat this operation for three times. To attain clarify transparent cells, cell shape and the status of the reunion was observed under a microscope. Sample was diluted step by step to make the cell density 104 cells /mL prior to MCE-MS analysis.
2.3. Fabrication of microchip
Design of the microfluidic chip is shown in Figure 1A. The microchip is composed of a glass base and a two layered PDMS substrate bearing the channels. The first layer contains cell transport channel, separation channel and the electrical spray emitter channel. The second layer bears pneumatic pressure valve channel, which prevents the cell suspension sample from flowing into stimulation chamber so as to interfere with the tests. The method used to create channels in PDMS substrate was described previously.29 Briefly, to create masters for PDMS substrate construction, HMDS was transferred onto a silicon wafer with a pipette. The wafer was pinned at 2000 rpm till complete dryness. The wafer was then coated with SU-8 2010 negative photoresist using a spin coater operating at 2500 rpm for 80s. After a pre-exposure bake at 65°C for 30 min, the coated wafer was exposed to a near-UV light source (UVA-10, Ultra. Lum, Claremont, CA) through a negative chrome mask that contained the desired channel features. Following a post exposure bake at 95 °C for 10 min, the wafer was developed with SU-8 developer. PDMS monopolymer solution prepared by mixing the PDMS prepolymer and curing agent in a 10:1 ratio, which had been degassed under vacuum, was poured onto the master at 1800rpm for 50s (~100μm final thickness). After kept at 50 °C for about 2 hours, the PDMS was removed from the mold to form a pattern of negatively relieved channels in the PDMS sheet (~100μm thick) and ESI spray membrane at the top channel. A thin glass tip (~100μm thick) was ground with gravel in glass base (1 mm thick). A gold electrode for nano-electrospray operation was fabricated on the glass base using a 108 auto sputter coater (Ted Pella, Inc.) under a vacuum pressure of 50 mTorr. The resultant electrode was about 50 nm thick and 100 μm wide. Holes as with the same size (diameter is 2mm) were cut out on PDMS with a punch. It was then treated in an air plasma cleaner (PDC-32G, Harrick Plasma, Ithaca, NY) for 5 min (10.5 W and 500mTorr). Tailored pipet tips were attached to each of the holes, forming reservoirs in the microchip. Pressure valve channels were connected to an in-house built pneumatic solenoid valve system that was controlled by a computer.
Figure 1.
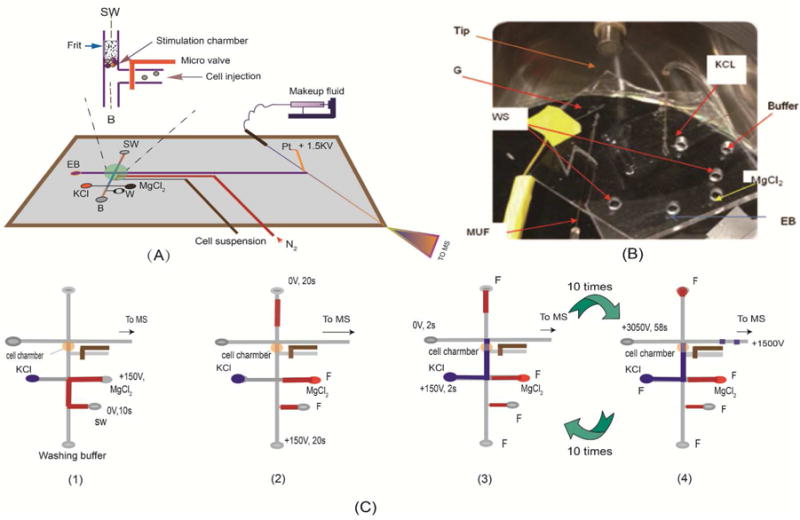
(A) A schematic diagram of the proposed microfluidic platform (separation channel is 3.5cm long × 60μm wide × 25 μm deep). The nano-liter sized chamber for cell perfusion is shown in the inset; (B) a photographic image of the set-up for studying neurochemical release from neuronal cells. G is the nano-electrospray gold electrode. Other components are labeled and indicated with an arrow); (C) A schematic diagram showing the procedural operations after cells are loaded into the nano-perfusion chamber: 1) loading an inhibitor (MgCl2) solution; 2) perfusing the cells with the inhibitor solution; 3) perfusing the cells with the stimulus solution; and 4) MCE-MS analysis of the perfusate.
2.4. Pretreatment of microfluidic channels
Microfluidic channels were treated with a mixture of H2O/HCl/H2O2 at a volume ratio of 5:1:1 for 5min. After purging the channels with deionized (DI) water and drying with N2, the hydrophilic silanol-covered PDMS surfaces were obtained.30 Prior to each experiment, all channels were treated with 0.5% hydrogen peroxide by vacuum suction for 5 minutes, then washed with deionized water, 0.1 M hydrochloric acid and 0.1 M NaOH for 3 minutes, 5 minutes and 3 minutes, respectively. The channels were then dried by applying vacuum to waste sample reservoir for two minutes. The chip was flushed with fresh buffer for 3 minutes. The liquid reservoir voltage were tested to obtain stable electrical spray, further experiments were then be conducted.
2.5. MCE-MS analysis
The system consisted of an ion trap mass spectrometer with an ESI source (LCQ Deca, ThermoFinnigan, San Jose, CA) and one Hamilton syringe (Hamilton, Las Vegas, NV), which was used for delivering make-up fluid to the nanoelectrospray source. Xcalibur software (ThermoFinnigan) was used to control the system. The nanoelectrospray performance of the monolithic emitter was evaluated at different flow rates and electrospray potentials.31 The operating conditions were optimized in positive mode as follows: ion source voltage, 0V; a relative collision energy of 20–30% was used for MS/MS experiments with an isolation width of 1.0 u. and the activation time of 30ms. MS detector was operated in selected-reaction monitoring mode (SRM) for precursor-to-product ion transitions: m/z 154➔137 (DA), m/z 177➔160 (5-HT), m/z 148➔130 (Glu), and m/z 134➔115 (Asp). Electrospray potential was applied by a multi-channel high voltage power supply (Shandong Normal University, Jinan, China) which supplied voltages for cell injection, perfusion, and MCE separation. Figure 1B shows a photographic picture of the experimental set-up.
2.6. Monitoring neurotransmitter release
Prior to experiment, the microchip was mounted on the X–Y translational stage and so positioned that the nanoESI emitter tip was about ~1.0 mm away from the MS orifice. Pt-electrodes were placed into the corresponding reservoirs, as shown in Fig. 1B. Reservoirs B, SW and EB were filled with 100μL electrophoresis buffers, a sample vial with 100μL cell suspensions (5 × 10⁵ cells /mL), and reservoir KCl with KCl solution. A voltage of 100V was applied at the sample vial to inject cells into the nano-perfusion chamber for 25s (under these conditions 8–15 cells were loaded up in the chamber). After loading up cells, the pneumatic microvalve was activated by supplying N2 gas at 15 psi to the pneumatic channel that could be deformed under pressure to pinch off liquid flow in the cell injection microchannel. A flow of KCl solution was generated passing through the chamber by applying 150V at reservoir KCl for 10s. At the end of cell perfusion, a set of electric potentials were applied as follows: reservoir KCl at 150V, SW floating, EB at 0 V for 2s to inject a sample plug of the cell perfusate into the separation channel, and then an MCE-MS separation was immediately carried out by applying 3050 V at EB, and 1500 V at MUF for 58s. At the end of MCE-MS separation, another round of perfusate injection (2s) and MCE-MS separation (58s) automatically started in sequence till a pre-set number of rounds was achieved.
2.7. Determination of cell viability
To study whether the electric field and stimulating solutions containing K+ or alcohol used affect the cell viability, a standard staining method was adapted by using trypan blue. To stain with trypan blue, suitable volumes of 0.4% trypan blue solution were added directly to three samples (i.e., the original cell suspension after trypsinization (without the electrical field), the cells sampled in cell sampling step and the cells loaded in cells loading and stimulating step), respectively. The original cell suspension after trypsinization was used as the control. All the cells were stained for 5 min at room temperature. The survival rate and cell viability were determined under a microscope.
2.8. Safety considerations
All high voltage connections were carefully shielded and Instrument and electrically conductive parts were grounded to protect from exposure. Standard safety protocols were feasible when handling solvents and samples.
3. Results and discussion
3.1. Design and fabrication of the microfluidic chip
The microfluidic chip was constructed by three layers: the glass base, PDMS substrate bearing microfluidic channels, and the pneumatic pressure valve PDMS layer by using PDMS-based multilayer soft lithography.33,34 Its photographic image is shown in Figure 1B. The PDMS substrate was made very thin to ensure a proper function of the pneumatic pressure valve. To create a small-volume chamber for cell perfusion, a polymer frit was prepared by means of UV light induced polymerization of glycidyl methaxrylate and trimethylolpropane trimethacrylate near the intersection of the cell introduction channel and the separation channel following a procedure described previously32 (the cell nano-perfusion chamber in the microchip is illustrated by the inset of Fig. 1A). Before preparing the frit, the microchannel was chemically treated with HCl /H2O2 to make the PDMS channel wall be covered by silanol groups,30 which enhanced the bonding between channel walls and the frit formed from glycidyl methaxrylate and trimethylolpropane trimethacrylate. This increased the durability of the frit in the microchip. The microfluidic platform proposed herein has several significant advantages. Firstly, monitoring of neurotransmitter release from cells can be done under stimulations with different parameters, and these parameters can be changed readily. Secondly, the analytical process is fully automated so that a large data set can be readily acquired during the monitoring. Thirdly, due to the utilization of the makeup fluid technique, nanoESI-MS detection can be started at any desired time easily and stability of the electrospray can be maintained for a long run time, facilitating the detection of chemicals in cell perfusate. The basic operations in a neurotransmitter release study by using the proposed microfluidic chip is schematically described in details by Fig. 1C: (1) loading up the chemical stimulus by applying +150V at MgCl2 (or KCl) reservoir, and 0V at SW for 10 s; (2) cell perfusion (stimulation) by applying +150V at B reservoir and 0V at SW for 20 s; (3) injection of cell perfusate by applying +150V at KCl reservoir and 0V at EB for 2 s; and (4) MCEMC analysis of the perfusate by applying +3050V at B reservoir, and 1500V at G reservoir for 58 s. Steps 3 and 4 were repeated 10 times. These operations were fully automated by switching voltages among these electrodes in a computerized manner.
3.2. Performance evaluation of the MCE-nanoESI-MS platform
A mixture of 4 neurotransmitters, including DA, 5-HT, Asp and Glu were analyzed. Under the selected conditions, the four neurotransmitters were separated into three peaks, i.e. DA and 5-HT were co-eluted. However, since MS detector is structure specific, the four compounds can be quantified simultaneously. MS2 spectra of (a) 5-HT, (b) Asp, (c) Glu, and (d) DA are showed in Figure 2. Transitions m/z 154→130, m/z177→122, m/z 134 → 88 and m/z 148 → 102 were used for quantification of DA, 5-HT, Asp and Glu, respectively. Table 1 summarizes the analytic parameters of the MCE-MS/MS analysis. The detection limits (S/N =3) were estimated to be 42 nM for DA, 49 nM for 5-HT, 38 nM for Asp, and 32 nM for Glu. Assay repeatability was determined by repeatedly analyzing four standard mixtures of DA, 5-HT, Asp and Glu (0.5 and 5.0 μM each, respectively) for six times. Relative standard deviations (RSD) were 5.2%, 4.7, 4.3% and 4.6% for DA, 5-HT, Asp and Glu at 5.0 μM, respectively. Reproducibility of the migration times (RSD, n=6) was <2.5% in all cases. To further evaluate the system, perfusate samples from cell perfusion with 0.7% ethanol were analyzed. To load up cells into the nano-perfusion chamber, voltages were applied at cell suspension reservoir (+100V) and SW (0V). It was confirmed by analyzing the solution flowing out of the chamber during cell load up that at this low voltage, cell integrity was maintained, and no neurotransmitter release was elicited. After perfusion of the cells with the chemical stimulus solution, all cells in the chamber were continuously exposed to it. In each MCE-MS analysis a little portion of the perfusate was assayed to quantify neurotransmitters. In this stimulation test of 10 min the perfusate was analyzed 9 times by MCE-MS. The TIC and extracted electropherograms obtained are shown in Figure 3. The neurotransmitters, i.e. DA, 5 – HT, Asp, and Glu can be quantified from the peak heights. As can be seen, the electrophoretic peaks are very narrow, indicating high separation efficiency and assay sensitivity. Theoretical plate numbers (N=16 (tR/wb)2) were estimated to be >7500 for all the neurotransmitters tested. Based on the peak heights levels of neurotransmitters varied with exposure time in different patterns, which showed that the cells were alive and responded to the chemical stimulation during the process. These results indicate that the proposed MCE-MS platform is well suited for studying neurotransmitter release from cells. It should pointed out that since the data acquisition sampling rate was limited by the MS instrument used in this work the separation efficiency may be compromised, and quantification based on peak heights might be affected. Therefore, replicate measurements for each stimulation test were performed in order to obtain valid trends of neurotransmitter levels versus exposure time.
Figure 2.
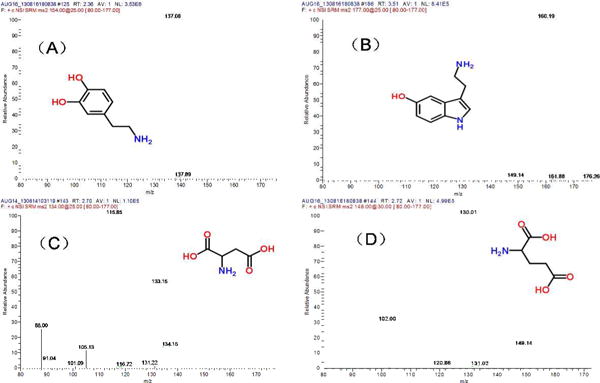
MS2 spectra of (A) dopamine (DA), (B) serotonin (5-HT), (C) Asp, and (D) Glu, verifying the MCE peak identifications.
Figure 3.
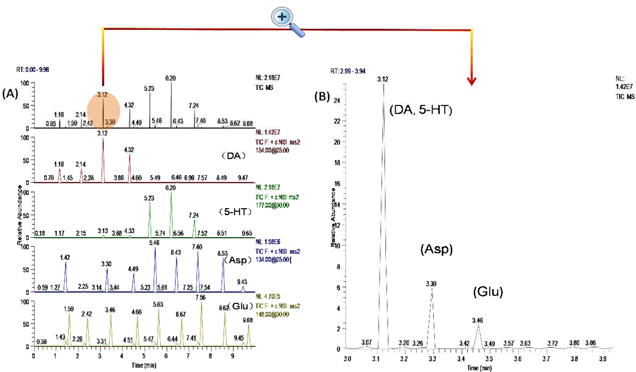
Typical electrophoregrams obtained from 10 MCE-MS analyses of the cellular perfusate with an enlarged electropherogram from one analysis shown in the inset. The PC12 cells were perfused with 0.7% (v/v) alcohol. DA, 5-HT, Asp and Glu in the perfusate were quantified by MCE-MS with a sampling rate of once per min. MCE conditions: MCE separation channel, 3.5cm long × 60 μm wide × 25 μm deep; separation voltage and electrospray voltage, +3050 V and +1500 V, respectively; MCE running buffer, 15mM ammonium acetate /acetic acid buffer at pH 5.1 /methanol (1:1) and contain 0.1% (w/v) triton-100; MUF, the MCE running buffer at a flow rate of 100nL/min.
3.3. Study of neurochemical release caused by chemical stimuli
Potassium chloride (KCl) is well known as a chemical stimulant to neuronal cells. An elevated extracellular K+ level causes cells to depolarize that leads to the subsequent opening of Ca2+ channels in cell membrane, triggering exocytosis. PC-12 neuronal cells are widely used as a cellular model for studying exocytotic release caused by chemical stimuli. These cells synthesize catecholamine such as dopamine, and they store, release, and take up neurotransmitters. Four neurotransmitters, i.e. DA, 5-HT, Asp, and Glu were studied in this work. Previous studies have shown that DA is widely implicated in a variety of neuronal functions such as evaluation of environmental stimuli and neurological conditions (e.g. Parkinson’s disease). 5-HT is a close molecular relative of dopamine and well known as a mood regulator. Glutamate and aspartate are excitatory amino acids in the mammalian brain. Fast transmission mediated by these neurotransmitters is responsible for synaptic excitation of brain neurons.35 To monitor neurotransmitter release from PC-12 neuronal cells caused by K+ depolarization, cells were injected into the nano-perfusion chamber and then perfused with a 35 mM KCl solution. For each group of cells loaded, 10 consecutive analyses of the perfusate were performed at a time interval of 1 min. Levels of DA, 5-HT, Asp, and Glu in the perfusate were simultaneously quantified, and their trends versus time are shown in Figure 4. From these results, all the four neurotransmitters investigated are released from PC-12 cells in response to KCl depolarization with two different release patterns: one for the two monoamine neurotransmitters (i.e. DA and 5-HT) and another for the two amino acid neurotransmitters (i.e. Glu and Asp). However, the release dynamics is different for the two monoamines. In the first min of stimulation, PC-12 cells release DA, Asp and Glu. 5-HT level in the perfusate is relatively low. After 3 min release of DA is diminished while release of Asp and Glu remains nearly constant till 8 min. At 4 min of exposure time, DA level in the perfusate from the cells was 86% lower than that at the beginning. Very interestingly, the cells start to release 5-HT in large quantities at this time point. It’s well documented that release of neurotransmitters is mediated by calcium-dependent exocytosis of synaptic vesicles.35–36 Synaptic vesicles are uniform organelles of ∼40 nm diameter that are filled with neurotransmitters. The results from the present study suggest that the two monoamine neurotransmitters, DA and 5-HT, are packaged into different vesicle pools as they are not released at the same time by vesicle exocytosis. In response to KCl stimulation, these vesicle pools are mobilized differently,37 which causes DA be released before 5-HT. Although monitoring DA release from PC-12 cells has been reported previously,38–41 to our knowledge simultaneous monitoring of both DA and 5-HT and the release dynamic difference are reported here for the first time.
Figure 4.
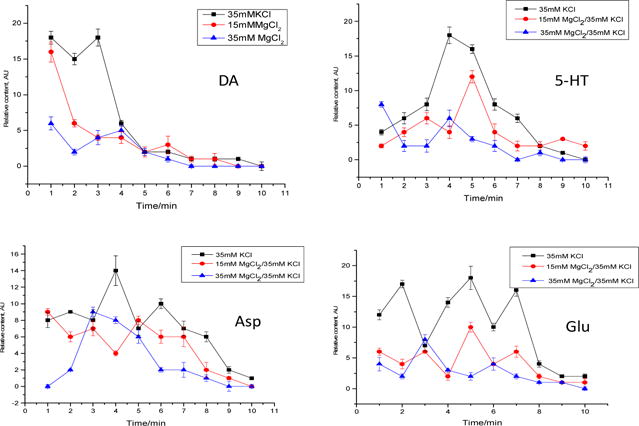
Release profiles of the four neurotransmitters from PC-12 cells caused by KCl stimulation with or without MgCl2 pre-perfusion for inhibition. Data shown are mean ± SD (n=3).
To confirm that the neurotransmitter release observed was due to chemical stimulation instead of electroporation or lysis of cells, the cells were perfused with an MgCl2 solution prior to KCl stimulation. Extracellular Mg2+ ions block the NMDA receptor-associated ion channel, and thus prevent calcium influx.35,40 By comparing the levels of neurotransmitters in the perfusate obtained from tests with or without pre-perfusion with MgCl2 (Fig. 4), extracellular levels of all neurotransmitters decrease significantly after MgCl2 treatment at all time points during the monitoring. In addition, as the concentration of MgCl2 increases from 15 mM to 35 mM, the levels decrease further, showing a dose dependent property. These results firmly indicate that PC-12 cells release DA, 5-HT, Asp, and Glu in response to KCl depolarization and the release is inhibited by MgCl2.
Ethanol (alcohol) interacts with multiple neurotransmitter systems, including dopaminergic and serotonergic transmission.43,44 Study has shown that chronic alcohol exposure results in an increase in NMDA receptor number and function.45 In this work, we investigated the effects of alcohol on cellular release of DA, 5-HT, Asp, and Glu from PC-12 cells. Two ethanol solutions (0.1% and 0.7% v/v) were tested. The study showed that an acute exposure to ethanol caused PC-12 cells to release DA, 5-HT, Asp, and Glu. Further, the amounts of neurotransmitters released from the cells were proportional to ethanol concentration. Figure 5 shows the extracellular levels of these neurotransmitters versus time of exposure to 0.7% ethanol (v/v). It is worth noting that the release dynamics is very similar to that of the release caused by KCl depolarization, suggesting these chemical stimuli may cause neurochemical release from PC-12 cells by the same mechanism. It should be mentioned that although only four neurotransmitters are included in this study, other compounds of interest can also be studied by using the present method.
Figure 5.
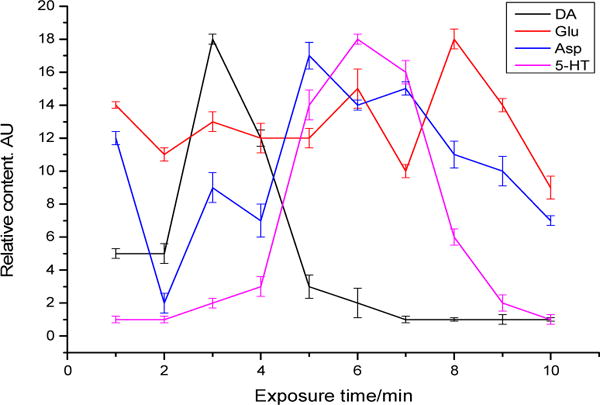
Neurochemical release profiles from PC-12 cells caused by 0.7% (v/v) ethanol acute stimulation. Data shown are mean ± SD (n=3).
4. Conclusion
A three layered microfluidic chip has been developed as a lab on chip for monitoring neurochemical release from neuronal cells. Cell loading, nano-perfusion of the cells with a stimulus or inhibitor solution, and chemical analysis of the perfusate by microchip electrophoresis with mass spectrometric detection (MCE-MS) are integrated into the same platform and fully automated. The proposed microfluidic platform enabled simultaneous monitoring of multiple neurochemicals from cellular release with specificity and sensitivity. Studying of chemical stimulus-induced release from PC-12 cells revealed that the cells released dopamine (DA), serotonin (5-HT), aspartic acid (Asp), and glutamic acid (Glu) in response to KCl or ethanol stimulation. To our knowledge, this is the first time to investigate release of these four important neurotransmitters from the same cellular sample and in a parallel manner. The results from the present study indicate that the release pattern for monoamine neurotransmitters (i.e. DA and 5-HT) is different from that for amino acid neurotransmitters (i.e. Glu and Asp). Further, the release dynamics is significantly different for the two monoamine neurotransmitters tested, suggesting they are packaged into different vesicle pools that are mobilized differently in response to chemical stimuli.
Acknowledgments
Financial support from US National Institutes of Health (GM089557) is gratefully acknowledged.
Footnotes
Notes
The authors declare no competing financial interest.
References
- 1.Birren SJ, Marder E. Science. 2013;340:436–437. doi: 10.1126/science.1238518. [DOI] [PubMed] [Google Scholar]
- 2.Kozminski KD, Gutman DA, Davila V, Sulzer D, Ewing AG. Anal chem. 1998;70:3123–3130. doi: 10.1021/ac980129f. [DOI] [PubMed] [Google Scholar]
- 3.Jiang H, Yi J, Boavida LC, Chen Y, Becker JD, Köhler C, McCormick S. Proc Natl Acad Sci. 2015;112:13378–13383. doi: 10.1073/pnas.1510854112. [DOI] [PMC free article] [PubMed] [Google Scholar]
- 4.Ji RR, Strichartz G. Sci Signal. 2004;2004:re14. doi: 10.1126/stke.2522004re14. [DOI] [PubMed] [Google Scholar]
- 5.Graham ME, O’Callaghan DW, McMahon HT, Burgoyne RD. Proc Natl Acad Sci. 2002;99:7124–7129. doi: 10.1073/pnas.102645099. [DOI] [PMC free article] [PubMed] [Google Scholar]
- 6.Gubernator NG, Zhang H, Staal RG, Mosharov EV, Pereira DB, Yue M, Balsanek V, Vadola PA, Mukherjee B, Edwards RH. Science. 2009;324:1441–1444. doi: 10.1126/science.1172278. [DOI] [PMC free article] [PubMed] [Google Scholar]
- 7.Tan W, Parpura V, Haydon PG, Yeung ES. Anal Chem. 1995;67:2575–2579. doi: 10.1021/ac00111a013. [DOI] [PubMed] [Google Scholar]
- 8.Caicedo A, Jafri MS, Roper SD. J Neurosci. 2000;20:7978–7985. doi: 10.1523/JNEUROSCI.20-21-07978.2000. [DOI] [PMC free article] [PubMed] [Google Scholar]
- 9.Nemani VM, Lu W, Berge V, Nakamura K, Onoa B, Lee MK, Chaudhry FA, Nicoll RA, Edwards RH. Neuron. 2010;65:66–79. doi: 10.1016/j.neuron.2009.12.023. [DOI] [PMC free article] [PubMed] [Google Scholar]
- 10.Auerbach SB, Minzenberg MJ, Wilkinson LO. Brain Res. 1989;499:281–290. doi: 10.1016/0006-8993(89)90776-2. [DOI] [PubMed] [Google Scholar]
- 11.Berg T, Jensen J. Front Neurosci. 2013;4 [Google Scholar]
- 12.Heien ML, Johnson MA, Wightman RM. Anal Chem. 2004;76:5697–5704. doi: 10.1021/ac0491509. [DOI] [PubMed] [Google Scholar]
- 13.Jo K, Heien ML, Thompson LB, Zhong M, Nuzzo RG, Sweedler JV. Lab Chip. 2007;7:1454–1460. doi: 10.1039/b706940e. [DOI] [PubMed] [Google Scholar]
- 14.Emmett MR, Andrén PE, Caprioli RM. J Neurosci Methods. 1995;62:141–147. doi: 10.1016/0165-0270(95)00070-4. [DOI] [PubMed] [Google Scholar]
- 15.Buck K, Voehringer P, Ferger B. J Neurosci Methods. 2009;182:78–84. doi: 10.1016/j.jneumeth.2009.05.018. [DOI] [PubMed] [Google Scholar]
- 16.Maury JJP, Ng D, Bi X, Bardor M, Choo AB-H. Anal Chem. 2013;86:395–402. doi: 10.1021/ac401821d. [DOI] [PubMed] [Google Scholar]
- 17.Fan R, Vermesh O, Srivastava A, Yen BK, Qin L, Ahmad H, Kwong GA, Liu C-C, Gould J, Hood L. Nat Biotechnol. 2008;26:1373–1378. doi: 10.1038/nbt.1507. [DOI] [PMC free article] [PubMed] [Google Scholar]
- 18.Lee J, Musyimi HK, Soper SA, Murray KK. J Am Soc Mass Spectrom. 2008;19:964–972. doi: 10.1016/j.jasms.2008.03.015. [DOI] [PubMed] [Google Scholar]
- 19.Chung K, Crane MM, Lu H. Nat Methods. 2008;5:637–643. doi: 10.1038/nmeth.1227. [DOI] [PubMed] [Google Scholar]
- 20.Thorsen T, Maerkl SJ, Quake SR. Science. 2002;298:580–584. doi: 10.1126/science.1076996. [DOI] [PubMed] [Google Scholar]
- 21.Nge PN, Rogers CI, Woolley AT. Chem Rev. 2013;113:2550–2583. doi: 10.1021/cr300337x. [DOI] [PMC free article] [PubMed] [Google Scholar]
- 22.Gao Y, Bhattacharya S, Chen X, Barizuddin S, Gangopadhyay S, Gillis KD. Lab Chip. 2009;9:3442–3446. doi: 10.1039/b913216c. [DOI] [PubMed] [Google Scholar]
- 23.Huang W-H, Cheng W, Zhang Z, Pang D-W, Wang Z-L, Cheng J-K, Cui D-F. Anal Chem. 2004;76:483–488. doi: 10.1021/ac035026y. [DOI] [PubMed] [Google Scholar]
- 24.Croushore CA, Sweedler JV. Lab Chip. 2013;13:1666–1676. doi: 10.1039/c3lc41334a. [DOI] [PMC free article] [PubMed] [Google Scholar]
- 25.Mellors J, Gorbounov V, Ramsey R, Ramsey J. Anal Chem. 2008;80:6881–6887. doi: 10.1021/ac800428w. [DOI] [PMC free article] [PubMed] [Google Scholar]
- 26.Zamfir AD. J Chromatogr A. 2007;1159:2–13. doi: 10.1016/j.chroma.2007.03.115. [DOI] [PubMed] [Google Scholar]
- 27.Mellors JS, Jorabchi K, Smith LM, Ramsey JM. Anal Chem. 2010;82:967–973. doi: 10.1021/ac902218y. [DOI] [PMC free article] [PubMed] [Google Scholar]
- 28.Martin TFJ, Grishanin RN. Methods in Cell Biol. 2003;71:267–286. doi: 10.1016/s0091-679x(03)01012-4. [DOI] [PubMed] [Google Scholar]
- 29.Li X, Xiao D, Ou XM, McCullm C, Liu YM. J Chromatogr A. 2013;1318:251–256. doi: 10.1016/j.chroma.2013.10.020. [DOI] [PMC free article] [PubMed] [Google Scholar]
- 30.Sui G, Wang J, Lee C-C, Lu W, Lee SP, Leyton JV, Wu AM, Tseng H-R. Anal Chem. 2006;78:5543–5551. doi: 10.1021/ac060605z. [DOI] [PubMed] [Google Scholar]
- 31.Li X, Zhao S, Liu YM. J Chromatogr A. 2013;1285:159–164. doi: 10.1016/j.chroma.2013.02.031. [DOI] [PMC free article] [PubMed] [Google Scholar]
- 32.Chen JR, Dulay MT, Zare RN. Anal Chem. 2000;72:1224–1227. doi: 10.1021/ac9911793. [DOI] [PubMed] [Google Scholar]
- 33.Unger MA, Chou H-P, Thorsen T, Scherer A, Quake SR. Science. 2000;288:113–116. doi: 10.1126/science.288.5463.113. [DOI] [PubMed] [Google Scholar]
- 34.Whitesides GM, Ostuni E, Takayama S, Jiang X, Ingber DE. Annu Rev Microbiol. 2001;3:335–373. doi: 10.1146/annurev.bioeng.3.1.335. [DOI] [PubMed] [Google Scholar]
- 35.Kandel ER, Schwartz JH, Jessell TM. Principles of neural science. Vol. 4 McGraw-Hill; New York: 2000. [Google Scholar]
- 36.Stevens CF. Neuron. 2003;40:381–388. doi: 10.1016/s0896-6273(03)00643-3. [DOI] [PubMed] [Google Scholar]
- 37.Rizzoli SO, Betz WJ. Science. 2004;303:2037–2039. doi: 10.1126/science.1094682. [DOI] [PubMed] [Google Scholar]
- 38.Robinson DL, Zitzman DL, Smith KJ, Spear LP. Neuroscience. 2011;176:296–307. doi: 10.1016/j.neuroscience.2010.12.016. [DOI] [PMC free article] [PubMed] [Google Scholar]
- 39.Mir TA, Akhtar MH, Gurudatt N, Kim J-I, Choi CS, Shim Y-B. Biosens Bioelectron. 2015;68:421–428. doi: 10.1016/j.bios.2015.01.024. [DOI] [PubMed] [Google Scholar]
- 40.Ges IA, Currie KP, Baudenbacher F. Biosens Bioelectron. 2012;34:30–36. doi: 10.1016/j.bios.2011.11.050. [DOI] [PMC free article] [PubMed] [Google Scholar]
- 41.Shi B-X, Wang Y, Zhang K, Lam T-L, Chan HL-W. Biosens Bioelectron. 2011;26:2917–2921. doi: 10.1016/j.bios.2010.11.037. [DOI] [PubMed] [Google Scholar]
- 42.Sutoo De, Akiyama K. Neurosci Lett. 2000;294:5–8. doi: 10.1016/s0304-3940(00)01537-8. [DOI] [PubMed] [Google Scholar]
- 43.Gonzales RA, Job MO, Doyon WM. Pharmacol Ther. 2004;103:121–146. doi: 10.1016/j.pharmthera.2004.06.002. [DOI] [PubMed] [Google Scholar]
- 44.Wong DF, Maini A, Rousset O, Brasic JR. Alcohol Research & Health. 2003;27:161–273. [PMC free article] [PubMed] [Google Scholar]
- 45.Lovinger DM. Alcohol Health & Research World. 1997;21:114–119. [PMC free article] [PubMed] [Google Scholar]


