

Bacteria can exhibit various types of motility. It is known that different types of motilities can be associated with virulence. In this work, we compare gene expression levels in bacteria that were grown under conditions that promoted three different types of E. coli motility. Better understanding of the mechanisms of how bacteria can cause an infection is an important first step to better diagnostics and therapeutics.
KEYWORDS: motility, pathogenesis, virulence
ABSTRACT
Bacterial motility is thought to play an important role in virulence. We have previously shown that proficient bacterial swimming and swarming in vitro is correlated with the persistent intramammary infection phenotype observed in cattle. However, little is known about the gene regulation differences important for different motility phenotypes in Escherichia coli. In this work, three E. coli strains that cause persistent bovine mastitis infections were grown in three media that promote different types of motility (planktonic, swimming, and swarming). Using whole-transcriptome RNA sequencing, we identified a total of 935 genes (~21% of the total genome) that were differentially expressed in comparisons of the various motility-promoting conditions. We found that approximately 7% of the differentially expressed genes were associated with iron regulation. We show that motility assays using iron or iron chelators confirmed the importance of iron regulation to the observed motility phenotypes. Because of the observation that E. coli strains that cause persistent infections are more motile, we contend that better understanding of the genes that are differentially expressed due to the type of motility will yield important information about how bacteria can become established within a host. Elucidating the mechanisms that regulate bacterial motility may provide new approaches in the development of intervention strategies as well as facilitate the discovery of novel diagnostics and therapeutics.
IMPORTANCE Bacteria can exhibit various types of motility. It is known that different types of motilities can be associated with virulence. In this work, we compare gene expression levels in bacteria that were grown under conditions that promoted three different types of E. coli motility. Better understanding of the mechanisms of how bacteria can cause an infection is an important first step to better diagnostics and therapeutics.
INTRODUCTION
The manners in which bacteria can move are diverse (1, 2). Two of the best-described types of bacterial motility are swimming and swarming. Swimming motility is defined as that exhibited by individual bacteria propelled by rotating flagella in liquid or semisolid media. Swimming bacteria use chemotaxis to find nutrients and avoid toxic environments. Swarming represents the coordinated motility of a dense group of bacteria (2, 3) and, like swimming, is mediated by flagella. However, chemotaxis is suppressed during swarming. Interestingly, swarming bacteria can demonstrate increased resistance to antibiotics (3). The type of bacterial motility is thought to correlate with the induction of various virulence determinants, chemotaxis signaling pathways, and surfactant synthesis and the acquisition of required nutrients such as iron (4).
Mammary-pathogenic Escherichia coli (MPEC) is a leading cause of acute mastitis in dairy animals (5). Coliform mastitis is considered to occur in an ascending manner, meaning that motility is thought to contribute to virulence by enabling MPEC to disseminate from the site of infection (teat canal) into the milk ducts and alveolar system of the mammary gland. Mastitis caused by E. coli is typically transient in duration, but persistent intramammary infections can occur (6). Strains of MPEC that cause persistent intramammary infections have been shown to invade cultured mammary epithelial cells more effectively than strains that cause transient infections (7). In addition, MPEC strains that cause persistent infections have been shown to have greater motility in vitro as demonstrated by increased rates of swimming and swarming compared to MPEC strains that cause transient mastitis and displayed little to no motility (8). Other pathogenic bacteria that exhibit greater motility in various assays are thought to have enhanced virulence compared to less-motile strains (4, 9). Therefore, understanding motility is an important part of understanding bacterial virulence.
In this work, we studied the changes in gene expression in MPEC strains isolated from media that promote different bacterial motility. The goal of this study was to determine the gene expression changes in highly motile MPEC strains under planktonic, swimming, and swarming growth conditions. Based on the finding of a large number of differentially expressed genes associated with the ferric uptake regulator (Fur), we explored the effects of iron on motility. Since motility has been long associated with virulence, we anticipate that this increased understanding of motility will lead to greater insight into the processes of pathogenicity of mammary-pathogenic E. coli (4, 9).
RESULTS
Three MPEC strains were grown separately in liquid media (Luria-Bertani [LB]), on semisolid agar plates that promote the swimming phenotype, and on semisolid agar plates that promote the swarming phenotype. Bacteria were harvested from each of the growth media, and RNA was isolated and sequenced. Sequence read information was mapped to 4,435 genes in E. coli reference strain MG1655 and plasmid CP009167, a plasmid from previous described mastitis-causing E. coli strain 727. A heat map was generated through hierarchical clustering of gene expression pattern similarities for the three MPEC strains under each of the three motility conditions for all the genes identified in the study (Fig. 1). Clustering by similar gene expression profiles showed that the samples all grouped by motility phenotype.
FIG 1 .
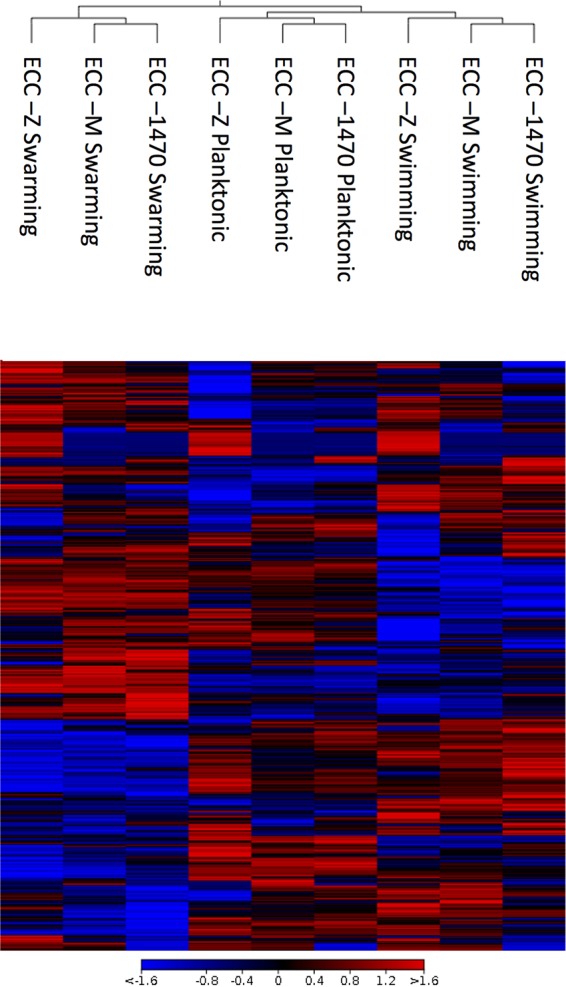
Heat map of gene expression. Comparisons of gene expression patterns of the whole transcriptome of the 3 MPEC strains in the 3 motility groups are shown. The gradient is representative of the expression differences between the samples. Gene expression clusters are categorized by motility, as denoted by the separation of the groups in the tree (see top of figure).
The three MPEC strains were used as the biological replicates under each growth condition to determine significant gene expression changes between the three motility phenotypes. We found 935 genes that showed significant expression differences (false-discovery rate [FDR], P ≤ 0.05) in comparisons of gene expression levels of any two of the three growth conditions (see Table S1 in the supplemental material). Figure 2 is a Venn diagram that indicates the numbers of genes with significant expression changes associated with growth under the three different motility conditions. Similarly, Table 1 shows the number of significant differentially expressed genes divided by numbers corresponding to the comparison groups (LB versus swim, LB versus swarm, or swim versus swarm) and the direction of the expression change. Of the 935 total differentially expressed genes, 231 genes were found in the comparison of bacterial motility in liquid LB versus swimming, 618 in the comparison of LB versus swarming, and 691 in the comparison of swimming versus swarming (Table 1).
FIG 2 .
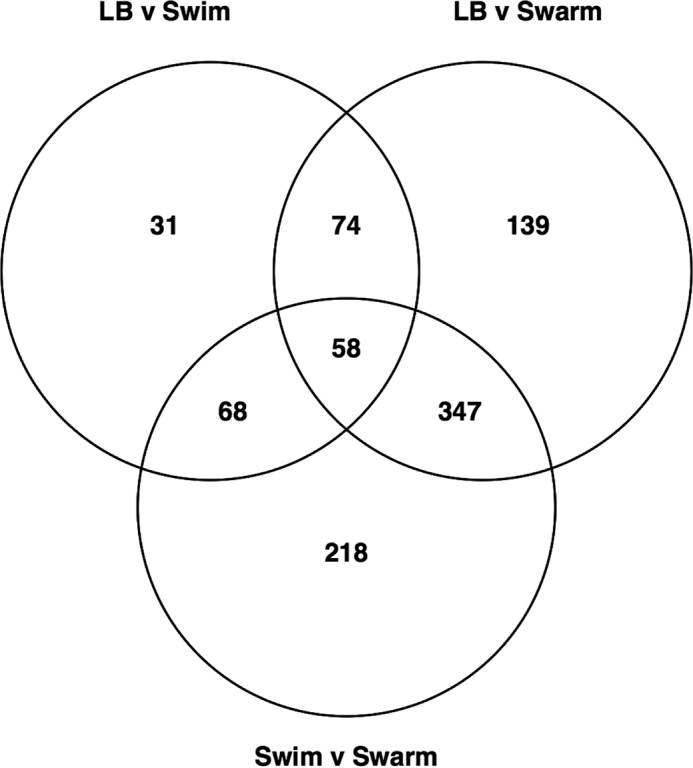
Venn diagram of differentially expressed genes. The Venn diagram shows the 935 genes differentially expressed (FDR P ≤ 0.05) among our three comparison groups (LB versus swim, LB versus swarm, and swim versus swarm).
TABLE 1 .
Number of differentially expressed genes and their direction of regulation for LB versus swim, LB versus swarm, and swim versus swarma
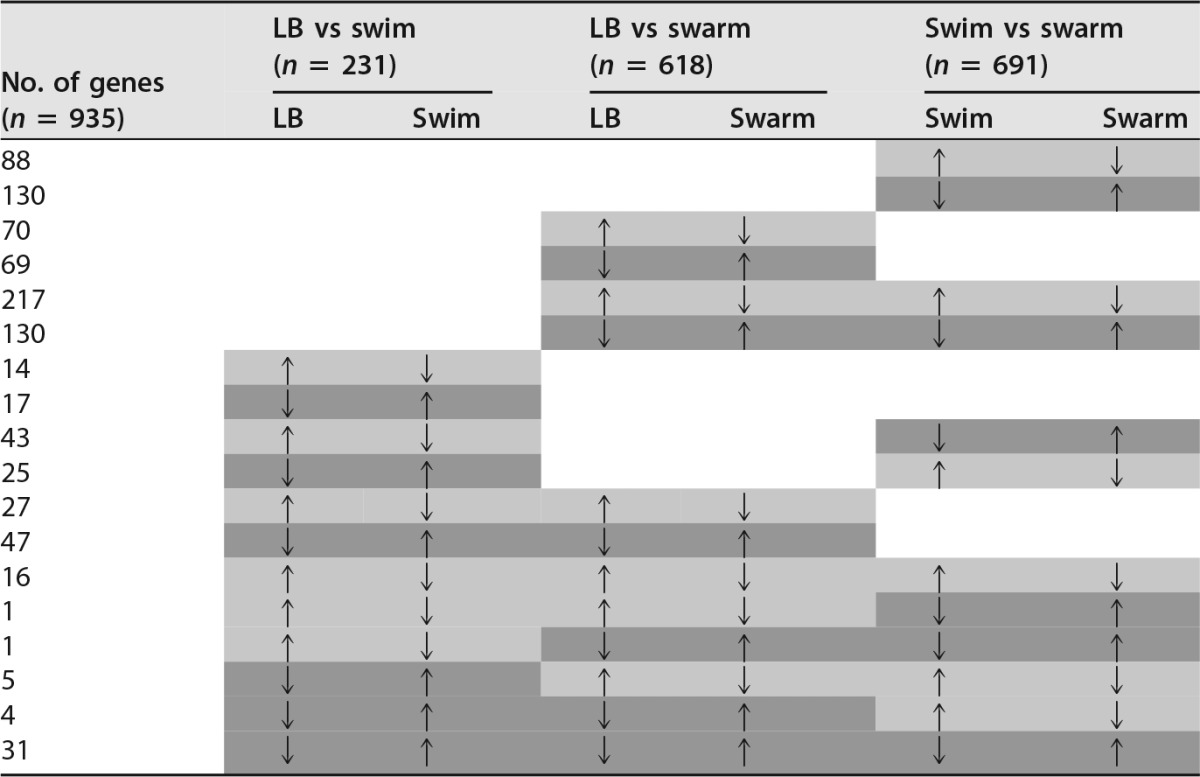
Light gray boxes indicate upregulation for the first parameter in the comparison and downregulation for the second parameter; dark gray boxes indicate downregulation for the first parameter in the comparison and upregulation for the second parameter.
Complete list of all genes aligned with RNA-Seq data. Gene identifier (ID), genome (E. coli strain MG1655 or plasmid CP009167), and start (chromosome start location) data are presented under the first three column headings. Those are followed by the data for the three comparison groups in two columns each corresponding to FC (fold change) and FDR (false-discovery rate) as indicated. The data under the column headings Type, Function, and Description are from an EcoCyc database. Download Table S1, XLSX file, 0.7 MB (766.7KB, xlsx) .
Copyright © 2016 Lippolis et al.
This content is distributed under the terms of the Creative Commons Attribution 4.0 International license.
We analyzed our data set using David Bioinformatics Resource to compare functional groups identified using enriched Gene Ontology (GO) terms (10, 11). The positive and negative expression changes from each of the three comparison groups were analyzed independently and are summarized in Tables 2 and 3. Table 2 shows only the highly significant (FDR P ≤ 0.001) molecular function GO terms. The majority of enriched molecular function GO terms found in Table 2 are related to ion binding, particularly that of iron. Table 3 shows the top 20 biological process GO terms that were differentially expressed. Included in the list of enriched biological process GO terms are anaerobic and aerobic respiration, carbohydrate catabolic process, tricarboxylic acid (TCA) cycle, and iron transport.
TABLE 2 .
Gene expression changes categorized by molecular-function GO termsa
| GO term | Expression change in comparison of: |
|||||||||||
|---|---|---|---|---|---|---|---|---|---|---|---|---|
| LB versus swim |
LB versus swarm |
Swim versus swarm |
||||||||||
| Negative |
Positive |
Negative |
Positive |
Negative |
Positive |
|||||||
| Count | FDR | Count | FDR | Count | FDR | Count | FDR | Count | FDR | Count | FDR | |
| Iron ion binding | 23 | 7.19E-06 | 37 | 7.32E-08 | 59 | 1.02E-22 | 35 | 1.98E-05 | 52 | 1.71E-14 | ||
| Metal ion binding | 67 | 4.66E-06 | 85 | 1.70E-12 | 67 | 4.34E-04 | 101 | 6.31E-17 | ||||
| Cation binding | 70 | 8.70E-07 | 85 | 1.02E-11 | 71 | 4.85E-05 | 101 | 5.24E-16 | ||||
| Ion binding | 70 | 1.09E-06 | 85 | 1.39E-11 | 71 | 5.99E-05 | 101 | 7.60E-16 | ||||
| Transition metal ion binding | 56 | 2.88E-06 | 74 | 6.29E-14 | 54 | 9.03E-04 | 81 | 2.54E-14 | ||||
| Ligase activity, forming carbon-nitrogen bonds | 13 | 1.95E-04 | 16 | 1.40E-06 | ||||||||
| 4 Iron, 4 sulfur cluster binding | 25 | 4.70E-06 | 21 | 6.93E-03 | 24 | 1.63E-04 | ||||||
| Nucleotide binding | 82 | 6.20E-05 | ||||||||||
| Cofactor binding | 48 | 1.09E-04 | ||||||||||
| Iron-sulfur cluster binding | 29 | 1.10E-04 | 26 | 2.05E-02 | 27 | 9.94E-03 | ||||||
| Metal cluster binding | 29 | 1.10E-04 | 26 | 2.05E-02 | 27 | 9.94E-03 | ||||||
| 2,3-Bisphosphoglycerate-dependent phosphoglycerate mutase activity | 5 | 1.68E-04 | 5 | 2.92E-04 | ||||||||
| Magnesium ion binding | 27 | 1.90E-04 | ||||||||||
| Inorganic cation transmembrane transporter activity | 17 | 4.93E-04 | ||||||||||
| Calcium ion binding | 8 | 9.42E-04 | ||||||||||
| Carbohydrate-importing ATPase activity | 8 | 1.85E-03 | ||||||||||
| Metal ion transmembrane transporter activity | 14 | 1.95E-03 | 14 | 8.38E-03 | ||||||||
| Carbohydrate-transporting ATPase activity | 8 | 3.41E-03 | ||||||||||
Negative, higher transcript amount under the first growth condition; positive, higher transcript amount under the second growth condition. Count data represent the number of genes from each GO term. All categories showed significant enrichment (FDR P, ≤0.001).
TABLE 3 .
Gene expression changes categorized by biological-process GO termsa
| GO term | Expression change in comparison of: |
|||||||||||
|---|---|---|---|---|---|---|---|---|---|---|---|---|
| LB versus swim |
LB versus swarm |
Swim versus swarm |
||||||||||
| Negative |
Positive |
Negative |
Positive |
Negative |
Positive |
|||||||
| Count | FDR | Count | FDR | Count | FDR | Count | FDR | Count | FDR | Count | FDR | |
| Carbohydrate catabolic process | 15 | 4.15E-02 | 55 | 9.27E-27 | 69 | 2.88E-38 | ||||||
| Nitrogen compound biosynthetic process | 74 | 2.20E-25 | 72 | 2.65E-20 | ||||||||
| Amine biosynthetic process | 15 | 2.79E-02 | 48 | 6.76E-19 | 41 | 2.76E-11 | ||||||
| Anaerobic respiration | 8 | 2.63E-03 | 27 | 2.24E-18 | 25 | 6.47E-15 | 18 | 1.15E-06 | ||||
| Iron ion transport | 10 | 2.63E-04 | 26 | 1.27E-17 | 26 | 2.62E-16 | ||||||
| Di- and trivalent inorganic cation transport | 10 | 1.08E-03 | 26 | 8.61E-16 | 26 | 1.69E-14 | ||||||
| Carboxylic acid biosynthetic process | 47 | 9.50E-16 | 48 | 2.70E-14 | ||||||||
| Organic acid biosynthetic process | 47 | 1.13E-15 | 48 | 3.20E-14 | ||||||||
| Aerobic respiration | 16 | 5.86E-12 | 24 | 1.71E-15 | 19 | 7.55E-09 | ||||||
| Cellular amino acid biosynthetic process | 41 | 1.57E-14 | 40 | 8.12E-12 | ||||||||
| Transition metal ion transport | 10 | 7.47E-03 | 27 | 2.38E-14 | 28 | 4.93E-14 | ||||||
| Energy derivation by oxidation of organic compounds | 10 | 2.96E-02 | 19 | 1.28E-07 | 34 | 6.18E-14 | 26 | 2.16E-06 | 34 | 1.58E-12 | 28 | 1.33E-06 |
| Peptidyl-aspartic acid modification | 10 | 3.22E-13 | ||||||||||
| Peptidyl-cysteine modification | 10 | 3.22E-13 | ||||||||||
| Peptidyl-l-beta-methylthioaspartic acid biosynthetic process from peptidyl-aspartic acid | 10 | 3.22E-13 | ||||||||||
| Generation of precursor metabolites and energy | 21 | 3.86E-05 | 42 | 2.82E-12 | 37 | 1.77E-07 | 38 | 4.25E-08 | 40 | 1.12E-07 | ||
| Cellular respiration | 18 | 1.72E-07 | 30 | 8.45E-12 | 26 | 1.78E-07 | 29 | 8.17E-10 | 26 | 2.42E-06 | ||
| Sulfur metabolic process | 26 | 1.06E-10 | 28 | 3.20E-11 | ||||||||
| Metal ion transport | 32 | 1.25E-09 | 31 | 1.58E-07 | ||||||||
| Tricarboxylic acid cycle | 9 | 7.52E-05 | 15 | 2.14E-08 | ||||||||
Negative, higher transcript amount under the first growth condition; positive, higher transcript amount under the second growth condition. Count data represent the number of genes from each GO term. All categories showed significant enrichment (FDR P, ≤0.001).
Due to the importance of iron regulation in pathogenic bacteria and the prevalence of differentially expressed iron binding and transport genes in our data set, we compared our data to a data set of genome-wide ferric uptake regulator (Fur) binding sites. In work reported by Seo and coworkers, 81 genes were identified as being a part of the Fur transcriptional regulatory network (12); we found 80 of those genes present in our data set (see Table S2 in the supplemental material). Of the 80 genes from the Fur regulatory network for which we have gene expression data, 63 showed significant expression change, and all of those changes were associated with swarming (either LB versus swarm or swim versus swarm). In the LB-versus-swimming comparison, 22 Fur-associated genes were differentially expressed.
List of genes that have been associated with the Fur regulon (12). Gene ID, genome (E. coli strain MG1655), and start (chromosome start location) data are presented under the first three column headings. Those are followed by the data for the three comparison groups in two columns each corresponding to FC (fold change) and FDR (false-discovery rate) as indicated. Data with an FDR P of ≤0.05 are highlighted. Negative, higher transcript amount under the first growth condition; positive, higher transcript amount under the second growth condition. Download Table S2, XLSX file, 0.1 MB (62.6KB, xlsx) .
Copyright © 2016 Lippolis et al.
This content is distributed under the terms of the Creative Commons Attribution 4.0 International license.
In Table S3, we compared our data with the data set of Inoue and coauthors (13). They identified genes important for swimming and/or swarming using a comprehensive collection of gene-disrupted E. coli K-12 mutants. Our data set contained 677 genes that were also contained in the Inoue data set; 138 of those genes were differentially expressed in one of our comparison groups. Inoue and coworkers divided their gene list into three groups: disrupted nonessential genes (n = 510) that led to a moderate repression of swarming with no effect on swimming, those nonessential genes (n = 216) that led to a strong repression of swarming with no effect on swimming, and those nonessential genes (n = 78) that led to a strong repression of both swimming and swarming (13). In our gene expression data, we found 85, 51, and 2 genes that matched those categories, respectively.
List of genes that have been associated with the Inoue data set (13). Gene ID, genome (E. coli strain MG1655 or plasmid CP009167), and start (chromosome start location) data are presented under the first three column headings. Those are followed by the data for the three comparison groups in two columns each corresponding to FC (fold change) and FDR (false-discovery rate) as indicated. Data with an FDR P of ≤0.05 are highlighted. The classifications used in the Inoue paper are indicated in the next column. There are three classifications: moderately repressed swarming, strongly repressed swarming and swimming, and strongly repressed swarming and no-effect swimming. Negative, higher transcript amount under the first growth condition; positive, higher transcript amount under the second growth condition. Download Table S3, XLSX file, 0.1 MB (146.7KB, xlsx) .
Copyright © 2016 Lippolis et al.
This content is distributed under the terms of the Creative Commons Attribution 4.0 International license.
Given the number of iron-related genes that showed significant expression changes (63 genes), we wanted to better understand the effect of iron on motility. To do so, we added iron in the form of FeCl3 to swimming and swarming plates at concentrations of 0, 10, 100, and 1,000 µM and measured changes in the motility phenotype for the three MPEC strains. There was no significant change in the swimming results for any of the bacterial strains at the highest concentration of added FeCl3 of 1,000 µM (Fig. 3A). In contrast, all three MPEC strains had significantly reduced swarming areas at the 1,000 µM FeCl3 concentration and ECC-M was significantly inhibited at a FeCl3 concentration of 100 µM (Fig. 3B). Figures 4 and 5 show the effect of adding deferoxamine (iron chelator) at concentrations of 0, 10, 100, and 1,000 µM to swimming and swarming plates, respectively. Bacterial swimming plates are known to have multiple concentric circles of growth. We measured the diameters of the outer and inner (second) rings on plates that contained various concentrations of deferoxamine. Generally, when these three MPEC strains were grown on swimming plates, increasing concentrations of deferoxamine resulted in a larger outer ring and a smaller inner ring. Representative data are shown in Fig. 5. The outer rings showed a significant treatment effect of deferoxamine (P ≤ 0.05) for MPEC strains ECC-M and ECC-1470. The outer ring for strain ECC-Z did not show a significant treatment effect (P = 0.09). The inner ring showed a significant deferoxamine treatment effect for strains ECC-Z and ECC-M, whereas there was no treatment effect seen with ECC-1470. Figure 6 shows the effect of deferoxamine on the swarming of our three MPEC strains. Strains ECC-Z and ECC-1470 exhibited no change in swarming with the addition of deferoxamine. In contrast, strain ECC-M showed a significant increase in the swarming area.
FIG 3 .
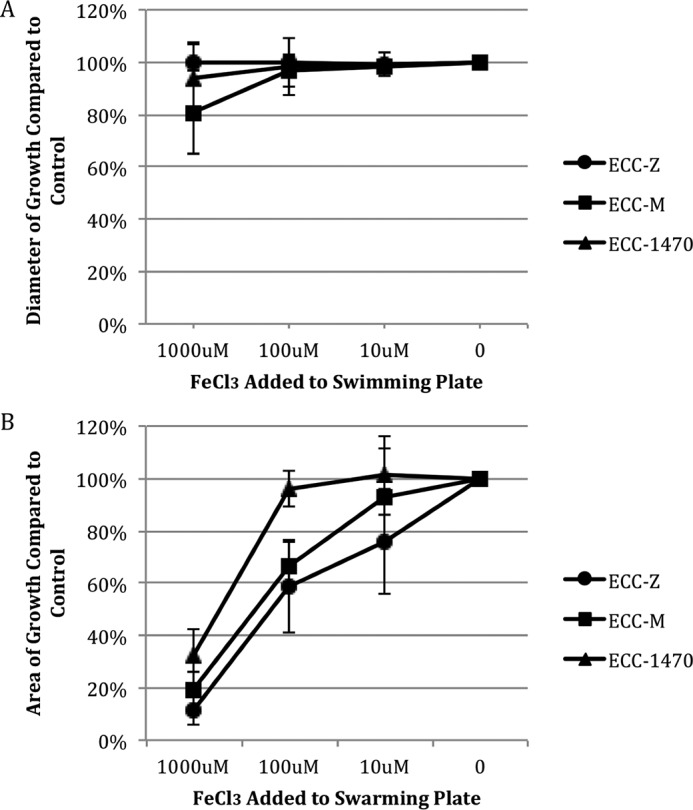
Effect of FeCl3 treatment on swimming and swarming of three MPEC strains. MPEC strains ECC-Z, ECC-M, and ECC-1470 were grown on swimming (A) and swarming (B) plates with 1,000 µM, 100 µM, 10 µM, or no added FeCl3. There were no significant FeCl3 treatment effects seen for any of the bacterial strains on the swimming plates shown in panel A. All three bacterial strains showed a significant (P ≤ 0.05) FeCl3 treatment effect on the swarming plates shown in panel B.
FIG 4 .
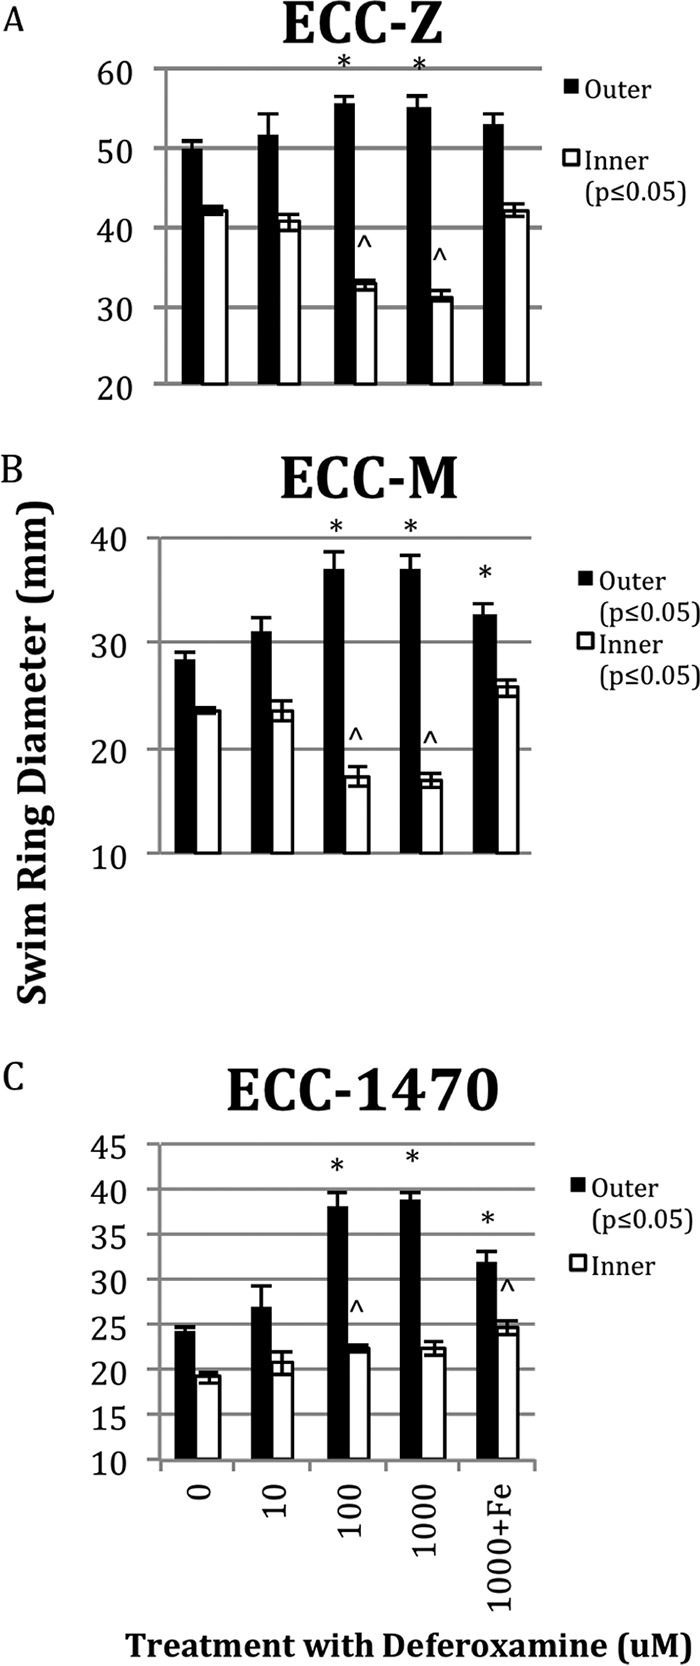
Effect of deferoxamine on swimming of three MPEC strains. MPEC strains ECC-Z (A), ECC-M (B), and ECC-1470 (C) were grown on swimming plates with 1,000 µM, 100 µM, or 10 µM deferoxamine, no added deferoxamine, or 1,000 µM deferoxamine plus 1,000 µM FeCl3. Significant treatment effects are indicated in the legend. Significant differences between the control (0) and other treatments are indicated with an asterisk (*) for the outer rings and a caret (^) for the inner ring.
FIG 5 .
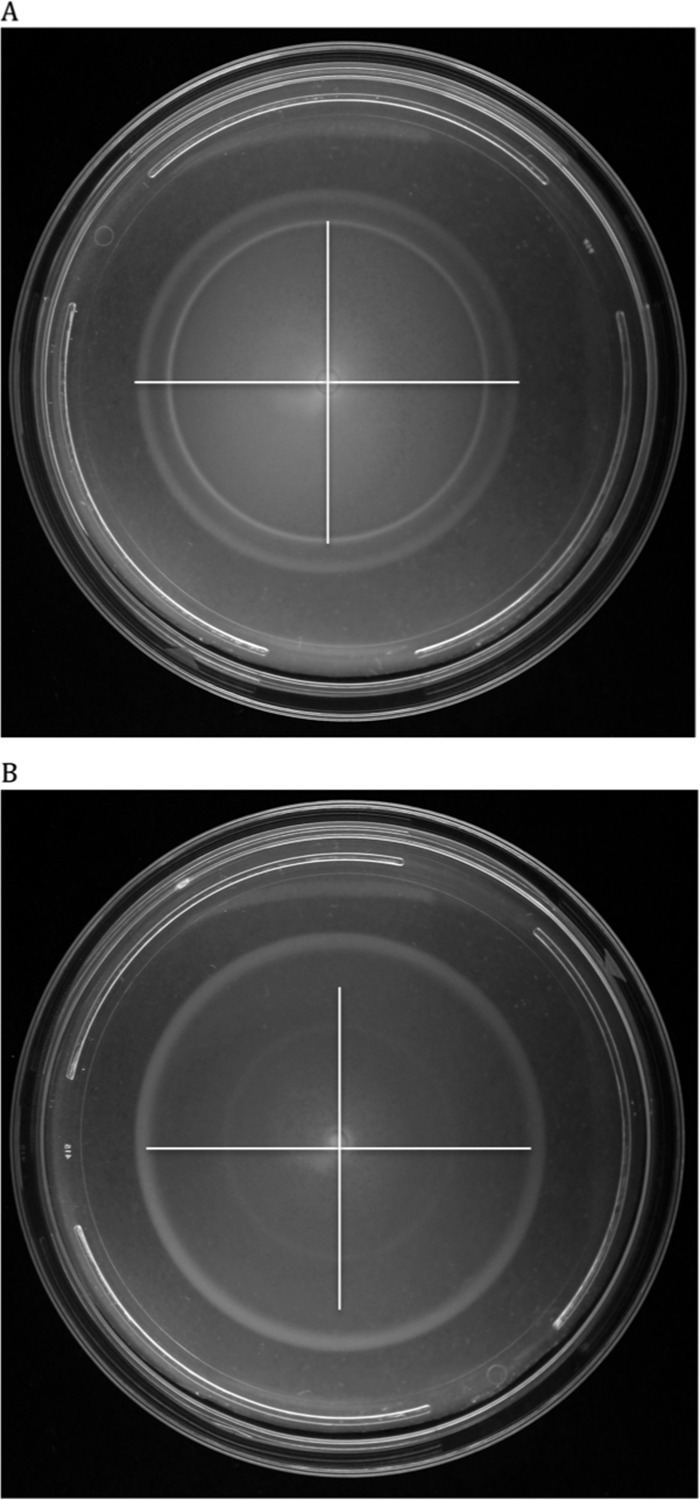
Differences in swimming motility due to iron chelation. Representative data are shown for strain ECC-Z grown on normal swim media (A) and on swim media with 1,000 µM deferoxamine (B). The horizontal and vertical lines in panel A show the sizes of the inner and outer rings. These same lines were copied into panel B to illustrate the size changes of both rings in the treated plate.
FIG 6 .
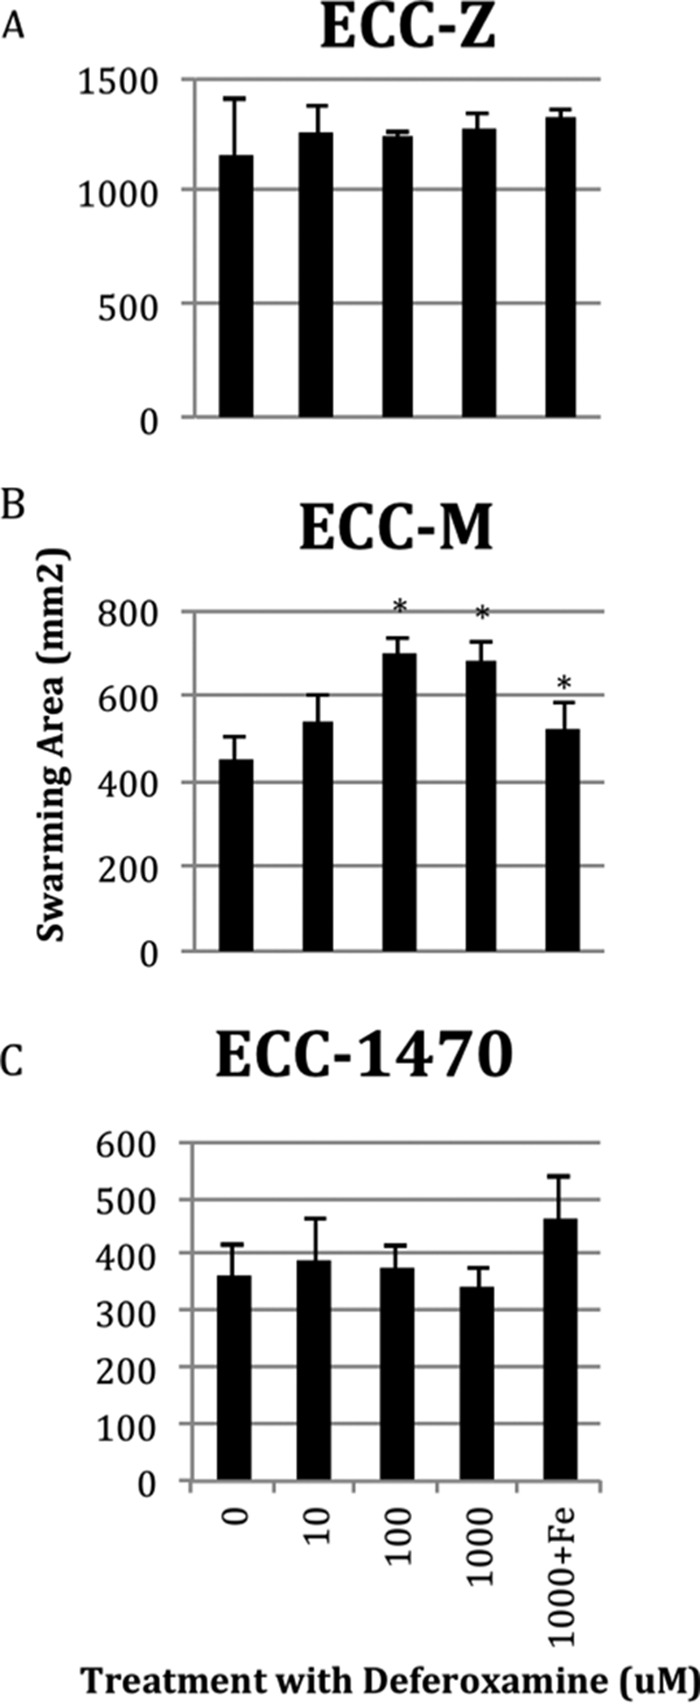
Effect of deferoxamine on swarming of three MPEC strains. MPEC strains ECC-Z (A), ECC-M (B), and ECC-1470 (C) were grown on swarming plates with 1,000 µM, 100 µM, or 10 µM deferoxamine, no added deferoxamine, or 1,000 µM deferoxamine plus 1,000 µM FeCl3. A treatment effect was significant (P ≤ 0.05) only for ECC-M (B). Significant differences between the control (0) and other treatments are indicated with an asterisk (*).
Using the data from EcoCyc, we identified a data set of 43 small regulatory RNAs or antisense RNAs (14). These RNAs are thought to modulate gene expression. Table S4 in the supplemental material contains expression data for these RNAs. Eight of these genes had a significant expression difference in at least one of our comparison groups. Of particular interest was the upregulation of ryhB in the LB-versus-swarm comparison due to this gene’s function in mediating positive Fur regulon responses. Data corresponding to additional potential antisense transcripts are included in Table S5. There were 183 genes in the antisense orientation that showed a significant expression difference in our comparison groups.
List of genes that have been associated with the small regulatory RNA or known antisense RNA. Gene ID, genome (E. coli strain MG1655), and start (chromosome start location) data are presented under the first three column headings. Those are followed by the data for the three comparison groups in two columns each corresponding to FC (fold change) and FDR (false-discovery rate) as indicated. Data with an FDR P of ≤0.05 are highlighted. Description data are from the EcoCyc database. Small regulatory RNAs were identified by searching the EcoCyc database for the term “small regulatory RNA” and by searching our database for the term “antisense” and manually curating the data. Download Table S4, XLSX file, 0.01 MB (15.3KB, xlsx) .
Copyright © 2016 Lippolis et al.
This content is distributed under the terms of the Creative Commons Attribution 4.0 International license.
List of both sense and antisense matches to genes. Gene ID, genome (E. coli strain MG1655), and start (chromosome start location) data are presented under the first column headings. Those are followed by the data for the three comparison groups presented in four columns. FC indicates fold change, FDR indicates false-discovery rate, and A- indicates antisense data. Starting in column P is the read information for the three bacterial strains ECC-Z (1), ECC-M (2), and ECC-1470 (3) grown in LB or on swimming or swarming plates. All antisense data are highlighted in gray. Download Table S5, XLSX file, 0.1 MB (96.3KB, xlsx) .
Copyright © 2016 Lippolis et al.
This content is distributed under the terms of the Creative Commons Attribution 4.0 International license.
DISCUSSION
Bacteria can employ several different mechanisms for motility, such as swimming, swarming, twitching, gliding, and sliding, that may be important for host colonization (2). Swimming is an individual motility behavior and is seen in liquid or plates with a very low (0.3%) agar concentration. Swarming is a group motility behavior where bacteria move in side-by-side groups called rafts (2). Swarming bacteria move along the surface of the agar dish, whereas swimming bacteria move within the agar. Both swimming and swarming motilities are driven by flagella. The ability to swim or swarm is thought to be associated with increased pathogenicity (4). Swarming bacteria have also exhibited resistance to multiple antibiotics (15). Our previous work demonstrated that strains of mastitis-causing E. coli showed different swimming and swarming abilities that correlated with persistent versus transient infections; interestingly, the transient-infection isolates displayed little to no ability to swim or swarm (8). In this work, we explore the gene expression changes due to growth on different motility-promoting media in three MPEC strains that cause persistent mammary gland infections.
As demonstrated in Table 2, iron utilization genes comprised one of the most affected groups of differentially regulated genes in comparisons of MPEC strains performed under planktonic, swimming, and swarming growth conditions. Previous work reported that upregulation of iron acquisition genes was observed when Salmonella enterica serovar Typhimurium was grown under swarming conditions compared to nonswarming conditions (16). The Fur regulator is thought to be a key element that regulates nutritional and virulence factors to control the bacterium’s adaptation to various environments, especially those inside a host (17). In this work, we have determined expression data on 80 of the 81 genes shown to be part of the Fur regulon (see Table S2 in the supplemental material), and 63 (79%) of these genes were differentially regulated in comparisons of swarming to the other motility growth conditions. We demonstrate that approximately 7% of all differentially regulated genes observed in this study are associated with the iron regulatory system. We also show that 22 Fur-regulated genes were differentially expressed in comparisons of planktonic-growth conditions with swimming conditions. All of the genes differentially regulated in the LB-versus-swim group were also differentially regulated in the LB-versus-swarm group. Most were expressed significantly (FDR P ≤ 0.05) more highly under swarming conditions than under swimming conditions. A few genes were upregulated equally under swimming and swarming conditions, and among those were three genes (ariR, ycgZ, and ymgA) that encode connector proteins for RcsB regulation of biofilm and acid resistance (18, 19). Based on the Fur regulon gene expression data, it would appear that swimming is an intermediate motility type between planktonic and swarming motilities.
RyhB is a small antisense RNA that, together with Fur, regulates a set of target genes that have been shown to play an important role in pathogenesis (17). Under iron-rich conditions, Fur acts as a negative regulator of ryhB. Table S4 in the supplemental material contains a list of 43 small antisense or other identified regulatory antisense RNAs, 8 of which were significantly differentially expressed under at least one motility condition. The functions of some of these small regulatory RNAs include regulation of the rpoS global regulator, activation of genes that detoxify oxidative damage, and regulation of the toxic proteins encoded by lbsAB. There is currently no data available regarding the potential role of small antisense RNAs in mastitis. Additionally, we have made available our complete antisense data set (Table S5).
To further understand the role of iron in swimming and swarming, we grew our three MPEC strains on plates with added iron (FeCl3) or with an iron chelator. The iron chelator we used was deferoxamine, a bacterial siderophore produced by Streptomyces pilosus that also has a medical application as a chelating agent to treat acute iron poisoning. Addition of FeCl3 to swimming plates resulted in no significant effect on the ability of any of the E. coli strains to swim (Fig. 3A). In contrast, the addition of deferoxamine to swimming plates caused significant changes (Fig. 4A). There was a significant treatment effect of the iron chelator seen in the ability of the bacteria in the outer ring to swim faster, as well in the propensity of the bacteria in the second (or inner ring) to swim slower, in two of the three strains compared to the control. It has been established that there are different nutrients utilized by the bacteria in each of the swimming rings. Those in the first ring consume all of the serine and much of the oxygen, whereas those in the second ring consume aspartic acid (20). The reason that sequestration of iron would cause different swimming rates in the different rings may be a combination of the lack of iron and the depletion of nutrients or oxygen. The gene expression data in this work were based on the bacteria isolated from the outer ring; hence, further investigation into the gene expression changes between swimming rings with or without the addition of iron chelators is warranted.
The addition of FeCl3 to swarming plates significantly inhibited swarming (Fig. 3B). This was not unexpected, as iron limitation has been shown to be necessary for swarmer cell differentiation of Vibrio parahaemolyticus (21). Addition of the iron chelator to swarming plates had no effect on two of the three strains. The addition of deferoxamine resulted in a significant increase in the swarming area for strain ECC-M. Therefore, the amount of iron available to the bacteria in an unmodified LB swarming plate seems to have been at an optimal level for swarming for two of the strains, whereas a decrease in iron resulting from addition of the chelator resulted in more swarming for one strain (ECC-M).
Because iron can promote swarming and virulence gene expression in bacteria (4), control of iron availability plays an important role in the innate immune system of the host. The host must balance the need for iron, in such essential functions as oxygen transport and energy production through cytochrome c, with the need to sequester iron away from pathogens (22, 23). The major iron sequestration protein in the mammary gland is lactoferrin, which is one of the most abundant proteins in the liquid fraction of milk and increases in abundance during infection (24, 25). Neutrophils release lactoferrin with other antimicrobial proteins during a response to pathogens (26). Bacterial growth can be inhibited by the presence of lactoferrin (27). In the case of our three MPEC strains, growth in LB (data not shown), on swimming plates (Fig. 4), and on swarming plates (Fig. 6) was not inhibited by the sequestration or addition of excess iron. In fact, swarming was enhanced in one isolate. An important issue in the understanding of pathogens adapted to the mammary gland would concern their ability to compete for iron in the presence of the host’s iron sequestration mechanisms in milk. Such a mechanism could potentially enable persistent MPEC strains to thrive in an iron-poor environment better than transient mastitis-causing E. coli strains.
In addition to the iron acquisition genes, many genes were shown to be differentially expressed in comparisons of growth in LB to growth on swimming or swarming plates. For example, enriched biological process GO terms associated with differentially expressed genes were anaerobic and aerobic respiration, as well as the tricarboxylic acid (TCA) cycle (Table 3). Mutations in genes in the TCA cycle altered swarming patterns of Proteus mirabilis, and those bacteria used components of both the aerobic and anaerobic respiratory chains (28). The two genes mutated in that study, fumC and sdhB, were differentially expressed in our study. The sdhB gene was significantly upregulated in both swimming and swarming compared to the level seen in LB, whereas fumC was upregulated only in swarming compared to the level in LB.
In conclusion, this report used transcriptomics to compare gene expression changes in three strains of E. coli grown under planktonic, swimming, and swarming conditions. Uniquely, we compared results determined under planktonic (growth in liquid media) and swimming (growth on semisolid agar) conditions and demonstrated gene expression differences between these two motility conditions. Our data suggest that swimming motility is an intermediate between planktonic and swarming motility. We also demonstrated the important role that genes associated with iron regulation have in three motility phenotypes. Our research goal is to better understand how pathogens that cause mastitis in dairy cattle establish and maintain an infection and how they evade the host immune response. Our previous research has indicated important differences in motility between E. coli strains that cause transient or persistent intramammary infections (8). The motility phenotype important for infection in the mammary gland is unknown. However, since the gland contains a cistern with a large volume of a liquid, all three of these motility types could play a role in infection. When a bacterium enters the gland through the teat sphincter, does it traverse the teat cistern into the main cistern by swimming? Does the bacterium multiply and fill the cistern by planktonic growth? Does it attach and grow along mammary epithelial cells by swarming? Answers to these important questions will lead to a clearer understanding of the mechanisms of pathogenesis in the bovine mammary gland.
MATERIALS AND METHODS
Bacterial strains and growth conditions.
The three E. coli strains used for these experiments were ECC-Z (O74:H39), ECC-M, (O−:H34) and ECC-1470 (OX18:H−) (7, 29). These strains were isolated from the mammary gland of cows with persistent infections (kind gift from Y. Schukken).
For planktonic conditions, fresh overnight cultures of bacteria were inoculated into fresh liquid Luria-Bertani (LB; 10 g Bacto tryptone–5 g Bacto yeast extract–5 g NaCl–1 liter deionized water) at a 1:1,000 dilution. Bacteria were incubated until mid-log growth (approximate optical density at 600 nm [OD600] of 0.7) at 37°C with aeration (200 rpm). For swimming and swarming, a 5-µl aliquot of a fresh liquid LB overnight culture of each of the three E. coli strains was plated on 0.3% agar swimming plates (3 g Bacto agar–1 liter LB) or 0.5% agar swarming plates (5 g Bacto agar–0.5% [wt/vol] glucose–1 liter LB) (30, 31). Swimming plates were incubated for approximately 5 h and swarming plates for approximately 12 h in a humid 37°C incubator.
RNA isolation.
Each of the three MPEC strains was harvested from LB liquid media, swim plates, and swarm plates for RNA isolation. For the LB liquid media, 0.5 ml of each culture was placed in 1.0 ml of RNAProtect (Qiagen, Germantown, MD). For the swim plates, an agar plug was taken from the outermost ring of bacteria using the opposite end of a 200-µl pipette tip, put in 1.0 ml of RNAProtect, and subjected to vortex mixing to disperse it. For the swarm plates, a culture loop was used to take three samples from the outermost edge of the bacteria, with each loopfull being stirred into 1.0 ml of RNAProtect. All samples (9 total [3 MPEC strains under the 3 sets of conditions]) in RNAProtect were processed according to the manufacturer’s instructions. RNA was isolated using an RNeasy minikit (Qiagen, Germantown, MD), followed by genomic DNA removal performed using Turbo DNase DNA-free (Ambion, Austin, TX) according to the product directions. Total RNA quantitation was performed using a NanoDrop ND-1000 spectrophotometer (Thermo Scientific, Wilmington, DE). RNA quality was determined with a 2100 Bioanalyzer (Agilent Technologies, Santa Clara, CA).
RNA sequencing.
Ribosomal RNA (rRNA) was depleted using a RiboZero rRNA removal kit (bacteria) according to the product instructions (Illumina Inc., San Diego, CA), and rRNA removal was verified on a 2100 Bioanalyzer. Libraries were constructed using TruSeq Stranded Total RNA Library prep kits and were subsequently sequenced on a HiSeq 2500 system using a 100-cycle single-end run (Illumina Inc., San Diego, CA) at the Iowa State University DNA core facility. To ensure robust statistical analyses, we targeted 10 million reads per sample (32); our sequencing resulted in an average of 10.6 ± 0.7 million reads per sample. The quality of the raw reads was assessed using FastQC (33).
Directional whole-transcriptome RNA sequencing (RNA-Seq) analysis.
CLC Genomics Workbench v7.5 was used to import, filter, and analyze the Illumina sequence data. Sequences from the E. coli MG1655 genome (GenBank accession number U00096.3) and an E. coli plasmid (GenBank accession number CP009167) from E. coli strain 1303, a previous described mastitis-causing strain, were used as reference sequences for mapping the reads using the following parameters: 2 maximum mismatches, 90% minimum length fraction, 80% minimum similarity fraction, and a maximum of 10 hits per read (34). Sense and antisense reads were determined by separately mapping reads to the reverse and forward strands of the reference sequences. Biological replication was achieved by averaging the gene expression data of the three MPEC strains. Gene expression changes were calculated with EdgeR (total count filter cutoff = 5.0) using false-discovery rate (FDR)-corrected P values (35) for all pairwise comparisons (LB versus swim; LB versus swarm; swim versus swarm) for each set of data in the sense and antisense directions. The data showing fold changes in gene expression represent the weighted differences between groups based on counts per million calculated in EdgeR. Gene expression differences were considered significant for an FDR P of <0.05. A heat map was made using Euclidean distances and complete linkage to compare the expression levels (in normalized log counts per million) from each gene between all the samples.
Bacterial swimming and swarming assays.
Swimming experiments had 2 technical replicate plates for each strain, and swarming assays had 3 technical replicates. The swimming and swarming experiments were performed 3 times. Each plate was photographed, the width of the diameter of the growth area was measured for swimming assays, and the area of the growth was measured for swarming assays. ImageJ (NIH) was used to determine the diameter and area of the outer bacterial growth circle. The iron chelator deferoxamine or FeCl3 (Sigma, St. Louis, MO) or both deferoxamine and FeCl3 were added to specific plates at concentrations of 0, 10, 100, and 1,000 µM immediately prior to pouring. Statistical analyses were conducted using Prism version 6 (GraphPad, San Diego, CA). To determine the statistical significance of the results of comparisons between the control and the various dosages of deferoxamine and FeCl3, one-way repeated-measure analysis of variance (ANOVA) with Dunnett’s multiple-comparison posttest was used.
RNAseq data accession number.
The 9 RNAseq raw data files are available on the NCBI website as part of BioProject PRJNA326931.
ACKNOWLEDGMENTS
We thank Duane Zimmerman, Allison Lasley, Tera Nyholm, and Derrel Hoy for their technical expertise.
Mention of trade names or commercial products in this article is solely for the purpose of providing specific information and does not imply recommendations or endorsement by the U.S. Department of Agriculture.
REFERENCES
- 1.Jarrell KF, McBride MJ. 2008. The surprisingly diverse ways that prokaryotes move. Nat Rev Microbiol 6:466–476. doi: 10.1038/nrmicro1900. [DOI] [PubMed] [Google Scholar]
- 2.Kearns DB. 2010. A field guide to bacterial swarming motility. Nat Rev Microbiol 8:634–644. doi: 10.1038/nrmicro2405. [DOI] [PMC free article] [PubMed] [Google Scholar]
- 3.Harshey RM, Partridge JD. 2015. Shelter in a swarm. J Mol Biol 427:3683–3694. doi: 10.1016/j.jmb.2015.07.025. [DOI] [PMC free article] [PubMed] [Google Scholar]
- 4.Partridge JD, Harshey RM. 2013. Swarming: flexible roaming plans. J Bacteriol 195:909–918. doi: 10.1128/JB.02063-12. [DOI] [PMC free article] [PubMed] [Google Scholar]
- 5.Hogan J, Larry Smith K. 2003. Coliform mastitis. Vet Res 34:507–519. doi: 10.1051/vetres:2003022. [DOI] [PubMed] [Google Scholar]
- 6.Döpfer D, Almeida RA, Lam TJ, Nederbragt H, Oliver SP, Gaastra W. 2000. Adhesion and invasion of Escherichia coli from single and recurrent clinical cases of bovine mastitis in vitro. Vet Microbiol 74:331–343. doi: 10.1016/S0378-1135(00)00191-7. [DOI] [PubMed] [Google Scholar]
- 7.Dogan B, Klaessig S, Rishniw M, Almeida RA, Oliver SP, Simpson K, Schukken YH. 2006. Adherent and invasive Escherichia coli are associated with persistent bovine mastitis. Vet Microbiol 116:270–282. doi: 10.1016/j.vetmic.2006.04.023. [DOI] [PubMed] [Google Scholar]
- 8.Lippolis JD, Brunelle BW, Reinhardt TA, Sacco RE, Nonnecke BJ, Dogan B, Simpson K, Schukken YH. 2014. Proteomic analysis reveals protein expression differences in Escherichia coli strains associated with persistent versus transient mastitis. J Proteomics 108:373–381. doi: 10.1016/j.jprot.2014.06.008. [DOI] [PubMed] [Google Scholar]
- 9.Ramos HC, Rumbo M, Sirard J-C. 2004. Bacterial flagellins: mediators of pathogenicity and host immune responses in mucosa. Trends Microbiol 12:509–517. doi: 10.1016/j.tim.2004.09.002. [DOI] [PubMed] [Google Scholar]
- 10.Huang DW, Sherman BT, Lempicki RA. 2009. Bioinformatics enrichment tools: paths toward the comprehensive functional analysis of large gene lists. Nucleic Acids Res 37:1–13. doi: 10.1093/nar/gkn923. [DOI] [PMC free article] [PubMed] [Google Scholar]
- 11.Huang DW, Sherman BT, Lempicki RA. 2009. Systematic and integrative analysis of large gene lists using David bioinformatics resources. Nat Protoc 4:44–57. doi: 10.1038/nprot.2008.211. [DOI] [PubMed] [Google Scholar]
- 12.Seo SW, Kim D, Latif H, O’Brien EJ, Szubin R, Palsson BO. 2014. Deciphering Fur transcriptional regulatory network highlights its complex role beyond iron metabolism in Escherichia coli. Nat Commun 5:4910. doi: 10.1038/ncomms5910. [DOI] [PMC free article] [PubMed] [Google Scholar]
- 13.Inoue T, Shingaki R, Hirose S, Waki K, Mori H, Fukui K. 2007. Genome-wide screening of genes required for swarming motility in Escherichia coli K-12. J Bacteriol 189:950–957. doi: 10.1128/JB.01294-06. [DOI] [PMC free article] [PubMed] [Google Scholar]
- 14.Thomason MK, Bischler T, Eisenbart SK, Förstner KU, Zhang A, Herbig A, Nieselt K, Sharma CM, Storz G. 2015. Global transcriptional start Site mapping using differential RNA sequencing reveals novel antisense RNAs in Escherichia coli. J Bacteriol 197:18–28. doi: 10.1128/JB.02096-14. [DOI] [PMC free article] [PubMed] [Google Scholar]
- 15.Butler MT, Wang Q, Harshey RM. 2010. Cell density and mobility protect swarming bacteria against antibiotics. Proc Natl Acad Sci U S A 107:3776–3781. doi: 10.1073/pnas.0910934107. [DOI] [PMC free article] [PubMed] [Google Scholar]
- 16.Wang Q, Frye JG, McClelland M, Harshey RM. 2004. Gene expression patterns during swarming in Salmonella typhimurium: genes specific to surface growth and putative new motility and pathogenicity genes. Mol Microbiol 52:169–187. doi: 10.1111/j.1365-2958.2003.03977.x. [DOI] [PubMed] [Google Scholar]
- 17.Porcheron G, Dozois CM. 2015. Interplay between iron homeostasis and virulence: Fur and RyhB as major regulators of bacterial pathogenicity. Vet Microbiol 179:2–14. doi: 10.1016/j.vetmic.2015.03.024. [DOI] [PubMed] [Google Scholar]
- 18.Lee J, Page R, García-Contreras R, Palermino J-M, Zhang X-S, Doshi O, Wood TK, Peti W. 2007. Structure and function of the Escherichia coli protein YmgB: a protein critical for biofilm formation and acid-resistance. J Mol Biol 373:11–26. doi: 10.1016/j.jmb.2007.07.037. [DOI] [PMC free article] [PubMed] [Google Scholar]
- 19.Tschowri N, Busse S, Hengge R. 2009. The BLUF-EAL protein YcgF acts as a direct anti-repressor in a blue-light response of Escherichia coli. Genes Dev 23:522–534. doi: 10.1101/gad.499409. [DOI] [PMC free article] [PubMed] [Google Scholar]
- 20.Adler J. 1966. Chemotaxis in bacteria. Science 153:708–716. doi: 10.1126/science.153.3737.708. [DOI] [PubMed] [Google Scholar]
- 21.McCarter L, Silverman M. 1989. Iron regulation of swarmer cell differentiation of Vibrio parahaemolyticus. J Bacteriol 171:731–736. [DOI] [PMC free article] [PubMed] [Google Scholar]
- 22.Ganz T, Nemeth E. 2015. Iron homeostasis in host defence and inflammation. Nat Rev Immunol 15:500–510. doi: 10.1038/nri3863. [DOI] [PMC free article] [PubMed] [Google Scholar]
- 23.Ong ST, Ho JZ, Ho B, Ding JL. 2006. Iron-withholding strategy in innate immunity. Immunobiology 211:295–314. doi: 10.1016/j.imbio.2006.02.004. [DOI] [PubMed] [Google Scholar]
- 24.Reinhardt TA, Sacco RE, Nonnecke BJ, Lippolis JD. 2013. Bovine milk proteome: quantitative changes in normal milk exosomes, milk fat globule membranes and whey proteomes resulting from Staphylococcus aureus mastitis. J Proteomics 82:141–154. doi: 10.1016/j.jprot.2013.02.013. [DOI] [PubMed] [Google Scholar]
- 25.Boehmer JL, Ward JL, Peters RR, Shefcheck KJ, Mcfarland MA, Bannerman DD. 2010. Proteomic analysis of the temporal expression of bovine milk proteins during coliform mastitis and label-free relative quantification. J Dairy Sci 93:593–603. doi: 10.3168/jds.2009-2526. [DOI] [PubMed] [Google Scholar]
- 26.Paape MJ, Bannerman DD, Zhao X, Lee J-W. 2003. The bovine neutrophil: structure and function in blood and milk. Vet Res 34:597–627. doi: 10.1051/vetres:2003024. [DOI] [PubMed] [Google Scholar]
- 27.Bishop JG, Schanbacher FL, Ferguson LC, Smith KL. 1976. In vitro growth inhibition of mastitis-causing coliform bacteria by bovine apo-lactoferrin and reversal of inhibition by citrate and high concentrations of apo-lactoferrin. Infect Immun 14:911–918. [DOI] [PMC free article] [PubMed] [Google Scholar]
- 28.Alteri CJ, Himpsl SD, Engstrom MD, Mobley HL. 2012. Anaerobic respiration using a complete oxidative TCA cycle drives multicellular swarming in Proteus mirabilis. mBio 3:e00365–12. doi: 10.1128/mBio.00365-12. [DOI] [PMC free article] [PubMed] [Google Scholar]
- 29.Dogan B, Rishniw M, Bruant G, Harel J, Schukken YH, Simpson KW. 2012. Phylogroup and lpfA influence epithelial invasion by mastitis associated Escherichia coli. Vet Microbiol 159:163–170. doi: 10.1016/j.vetmic.2012.03.033. [DOI] [PubMed] [Google Scholar]
- 30.Gómez-Gómez J-M, Manfredi C, Alonso J-C, Blázquez J. 2007. A novel role for RecA under non-stress: promotion of swarming motility in Escherichia coli K-12. BMC Biol 5:14. doi: 10.1186/1741-7007-5-14. [DOI] [PMC free article] [PubMed] [Google Scholar]
- 31.Wozniak CE, Chevance FF, Hughes KT. 2010. Multiple promoters contribute to swarming and the coordination of transcription with flagellar assembly in salmonella. J Bacteriol 192:4752–4762. doi: 10.1128/JB.00093-10. [DOI] [PMC free article] [PubMed] [Google Scholar]
- 32.Haas BJ, Chin M, Nusbaum C, Birren BW, Livny J. 2012. How deep is deep enough for RNA-Seq profiling of bacterial transcriptomes? BMC Genomics 13:734. doi: 10.1186/1471-2164-13-734. [DOI] [PMC free article] [PubMed] [Google Scholar]
- 33.Andrews S. 2010. FastQC: a quality control tool for high throughput sequence data. http://www.bioinformatics.babraham.ac.uk/projects/fastqc.
- 34.Brunelle BW, Bearson BL, Bearson SM. 2014. Chloramphenicol and tetracycline decrease motility and increase invasion and attachment gene expression in specific isolates of multidrug-resistant Salmonella enterica serovar Typhimurium. Front Microbiol 5:801. doi: 10.3389/fmicb.2014.00801. [DOI] [PMC free article] [PubMed] [Google Scholar]
- 35.Robinson MD, McCarthy DJ, Smyth GK. 2010. edgeR: a Bioconductor package for differential expression analysis of digital gene expression data. BioInformatics 26:139–140. doi: 10.1093/bioinformatics/btp616. [DOI] [PMC free article] [PubMed] [Google Scholar]
Associated Data
This section collects any data citations, data availability statements, or supplementary materials included in this article.
Supplementary Materials
Complete list of all genes aligned with RNA-Seq data. Gene identifier (ID), genome (E. coli strain MG1655 or plasmid CP009167), and start (chromosome start location) data are presented under the first three column headings. Those are followed by the data for the three comparison groups in two columns each corresponding to FC (fold change) and FDR (false-discovery rate) as indicated. The data under the column headings Type, Function, and Description are from an EcoCyc database. Download Table S1, XLSX file, 0.7 MB (766.7KB, xlsx) .
Copyright © 2016 Lippolis et al.
This content is distributed under the terms of the Creative Commons Attribution 4.0 International license.
List of genes that have been associated with the Fur regulon (12). Gene ID, genome (E. coli strain MG1655), and start (chromosome start location) data are presented under the first three column headings. Those are followed by the data for the three comparison groups in two columns each corresponding to FC (fold change) and FDR (false-discovery rate) as indicated. Data with an FDR P of ≤0.05 are highlighted. Negative, higher transcript amount under the first growth condition; positive, higher transcript amount under the second growth condition. Download Table S2, XLSX file, 0.1 MB (62.6KB, xlsx) .
Copyright © 2016 Lippolis et al.
This content is distributed under the terms of the Creative Commons Attribution 4.0 International license.
List of genes that have been associated with the Inoue data set (13). Gene ID, genome (E. coli strain MG1655 or plasmid CP009167), and start (chromosome start location) data are presented under the first three column headings. Those are followed by the data for the three comparison groups in two columns each corresponding to FC (fold change) and FDR (false-discovery rate) as indicated. Data with an FDR P of ≤0.05 are highlighted. The classifications used in the Inoue paper are indicated in the next column. There are three classifications: moderately repressed swarming, strongly repressed swarming and swimming, and strongly repressed swarming and no-effect swimming. Negative, higher transcript amount under the first growth condition; positive, higher transcript amount under the second growth condition. Download Table S3, XLSX file, 0.1 MB (146.7KB, xlsx) .
Copyright © 2016 Lippolis et al.
This content is distributed under the terms of the Creative Commons Attribution 4.0 International license.
List of genes that have been associated with the small regulatory RNA or known antisense RNA. Gene ID, genome (E. coli strain MG1655), and start (chromosome start location) data are presented under the first three column headings. Those are followed by the data for the three comparison groups in two columns each corresponding to FC (fold change) and FDR (false-discovery rate) as indicated. Data with an FDR P of ≤0.05 are highlighted. Description data are from the EcoCyc database. Small regulatory RNAs were identified by searching the EcoCyc database for the term “small regulatory RNA” and by searching our database for the term “antisense” and manually curating the data. Download Table S4, XLSX file, 0.01 MB (15.3KB, xlsx) .
Copyright © 2016 Lippolis et al.
This content is distributed under the terms of the Creative Commons Attribution 4.0 International license.
List of both sense and antisense matches to genes. Gene ID, genome (E. coli strain MG1655), and start (chromosome start location) data are presented under the first column headings. Those are followed by the data for the three comparison groups presented in four columns. FC indicates fold change, FDR indicates false-discovery rate, and A- indicates antisense data. Starting in column P is the read information for the three bacterial strains ECC-Z (1), ECC-M (2), and ECC-1470 (3) grown in LB or on swimming or swarming plates. All antisense data are highlighted in gray. Download Table S5, XLSX file, 0.1 MB (96.3KB, xlsx) .
Copyright © 2016 Lippolis et al.
This content is distributed under the terms of the Creative Commons Attribution 4.0 International license.