Supplemental Digital Content is available in the text
Keywords: blood pressure, cohort study, hemoglobin
Abstract
We investigated the cross-sectional and longitudinal associations between hemoglobin concentration and hypertension in a Korean population.
Between 2006 and 2013, we examined 4899 participants with mean age of 56.6 years (range 35–88 years) from a rural community. We excluded 298 participants with a history of myocardial infarction or stroke and 264 participants with very low hemoglobin levels (men: <13.3 g/dL; women: <11.6 g/dL). Finally, we performed a cross-sectional analysis on 1629 men and 2708 women. Longitudinal associations were evaluated in 654 men and 1099 women, after excluding 2584 people with hypertension at baseline and those who did not participate in follow-up examinations. Hypertension was defined as systolic blood pressure ≥140 mm Hg, diastolic blood pressure ≥90 mm Hg, or use of antihypertensive treatment.
The mean hemoglobin level was significantly higher in people with hypertension than in those without hypertension (P = 0.002 for men, P = 0.006 for women). On cross-sectional analysis, the odds ratio (95% confidence interval) for hypertension per 1 standard deviation increase in hemoglobin concentration (1.2 g/dL) was 1.11 (1.05–1.18) before adjustment and 1.20 (1.09–1.32) after adjusting for age, sex, body mass index, kidney markers, lifestyle factors, and comorbidities. On longitudinal analysis, the relative risk (95% confidence interval) for incident hypertension per 1 standard deviation increase in hemoglobin concentration was 1.09 (0.96–1.23) before adjustment and 0.91 (0.78–1.08) after adjusting for age, sex, body mass index, lifestyle factors, baseline blood pressure, baseline comorbidities, and baseline kidney markers.
This study suggests that hemoglobin per se does not cause hypertension development.
1. Introduction
The World Health Organization has reported that an estimated 17.5 million people died from cardiovascular disease (CVD) in 2012, representing 31% of all global deaths. Worldwide, approximately 54% of stroke cases and 47% of ischemic heart disease cases were attributable to high blood pressure.[1] Therefore, maintaining blood pressure values at an appropriate level and lowering risk factors to the minimal level is the key to preventing CVD.
Recent studies have indicated that increasing levels of hemoglobin are associated with high blood pressure and hypertension.[2–6] However, a Chinese study recently suggested that increasing hematocrit was not associated with prehypertension in individuals older than 60 years.[7] According to several previous studies, high hemoglobin can cause vasoconstriction and then elevate the blood pressure.[8,9] However, other studies reported that blood pressure is not correlated with blood viscosity in healthy individuals.[10–12]
Thus, we aimed to determine whether high hemoglobin per se can cause the development of hypertension in healthy individuals. Accordingly, we investigated both cross-sectional and longitudinal associations between hemoglobin and hypertension among community-dwelling Koreans.
2. Methods
2.1. Study population
Between 2006 and 2011, we enrolled 4899 people aged 35 to 88 years and living on Kangwha Island, South Korea, in the Korean Genome and Epidemiology Study (KoGES) and the Ischemic Heart Disease Clinical Research Center Study. After baseline health examinations, cohort members were invited to undergo follow-up health examinations every 3 to 5 years. The total follow-up period ranged from 1 to 7 years (mean 4.4 years).
A cross-sectional analysis was performed for 4337 people after excluding those with a history of myocardial infarction (n = 125) or cerebrovascular accident (n = 173), and also those with very low hemoglobin concentrations (n = 264, <13.3 g/dL for men and <11.6 g/dL for women).
A longitudinal analysis was performed for 1753 people, after additionally excluding 1096 people who did not participate in follow-up examinations and 1488 participants who had hypertension at baseline. All participants signed written informed consent forms, and the study protocol was approved by the Institutional Review Board of Severance Hospital at Yonsei University College of Medicine.
2.2. Measurements
All participants were interviewed individually using a standardized questionnaire to obtain information about sociodemographic characteristics, health behaviors, and chronic diseases. Trained interviewers conducted face-to-face interviews according to a predefined protocol, and double-checked whether responses were appropriate.
Alcohol intake was categorized as current drinking and former/nondrinking. Participants were asked whether they had ever consumed alcoholic beverages in their lifetime. If they regularly consumed at least 1 drink of any alcoholic beverage per month, they were categorized as current alcohol drinkers. If participants had stopped drinking or had never consumed alcohol, they were classified as former/nondrinkers.[13] Current smokers were defined as those who had smoked more than 100 cigarettes in their lifetime and were presently smoking. Current smokers smoked an average of 15.7 cigarettes per day (19.8 for men, 12.2 for women). Former smokers were those who had smoked more than 100 cigarettes in their lifetime, yet had not smoked recently, and never smokers were defined as those who had smoked fewer than 100 cigarettes. Smoking status was assessed using a self-reported questionnaire and was categorized as former/nonsmoking and current cigarette smoking. Regular physical activity was stratified into 2 groups based on the frequency of leisure-time physical activity.
Standing height was measured to the nearest 0.1 cm with an extensometer (DS-102, JENIX, Korea), and body weight was measured to the nearest 0.1 kg with a digital scale (DB-150, CAS, Korea). Body mass index (BMI) was calculated as weight in kilograms divided by the square of height in meters. Resting systolic blood pressure (SBP) and diastolic blood pressure (DBP) were measured at least twice using an automatic oscilloscopic sphygmomanometer (Carescape Dinamap V100, GE Healthcare). If the first and second measurements differed by ≥10 mm Hg for SBP or DBP, then additional measurements were performed, and the average of the last 2 measurements was used for the current analysis. Hypertension was defined as elevated blood pressure (SBP ≥140 mm Hg or DBP ≥90 mm Hg) or use of antihypertensive medication.
Blood samples were collected from the antecubital veins of the participants, after at least 8 hours of fasting. Collected blood samples were analyzed at a central research laboratory to obtain measurements of complete blood counts, total cholesterol, triglycerides, fasting glucose, blood urea nitrogen (BUN), and creatinine. Hemoglobin concentrations were measured by the impedance method using an automatic analyzer (ADVIA 120, Bayer Corp). Diabetes mellitus was defined as elevated fasting blood glucose (≥126 mg/dL), elevated HbA1c (≥6.5%), or treatment for diabetes. Hypercholesterolemia was defined as elevated total cholesterol (≥230 mg/dL), elevated triglycerides (≥200 mg/dL), or use of lipid-lowering medication.
2.3. Statistical analysis
Baseline characteristics were described for a total of 4337 participants according to sex using Student t test and the chi-square test. Student t test, the chi-square test, and the Wilcoxon test were used to assess statistical differences in baseline characteristics, including hemoglobin, in relation to the prevalence of hypertension. Trend tests were used to determine statistical differences in blood pressure and each covariate at follow-up according to quartiles of baseline hemoglobin concentration. We divided baseline hemoglobin concentrations into 4 groups, using each quartile level for both men and women. For the total population, we applied sex-specific quartiles. A logistic regression analysis was conducted to assess odds ratios (ORs) for cross-sectional associations between hemoglobin concentrations and hypertension. A generalized linear model was used to estimate relative risk (RR) for incident hypertension according to baseline hemoglobin concentration. For these analyses, we used 3 models: model 1 was an unadjusted model; model 2 was adjusted for age, sex, BMI, and study year (only for the cross-sectional analysis); and model 3 was additionally adjusted for menopausal status, alcohol intake, smoking status, regular physical activity, baseline BUN, serum creatinine, diabetes, hypercholesterolemia, and baseline SBP (only for the longitudinal analysis). We also performed Cox proportional hazard regression as a sensitivity analysis of generalized linear model. Smoking status was not included in the analysis of women due to the very low smoking rate (2.2%). To obtain additional insights into the linearity of the association between hemoglobin concentration and hypertension, a penalized cubic regression spline was used.[14] All statistical analyses were performed using SAS software, version 9.4.0 (SAS Inc., Cary, NC) and R package, version 3.0.3. All analyses were 2-sided, and P values less than 0.05 were regarded as statistically significant.
3. Results
3.1. Characteristics of the study population
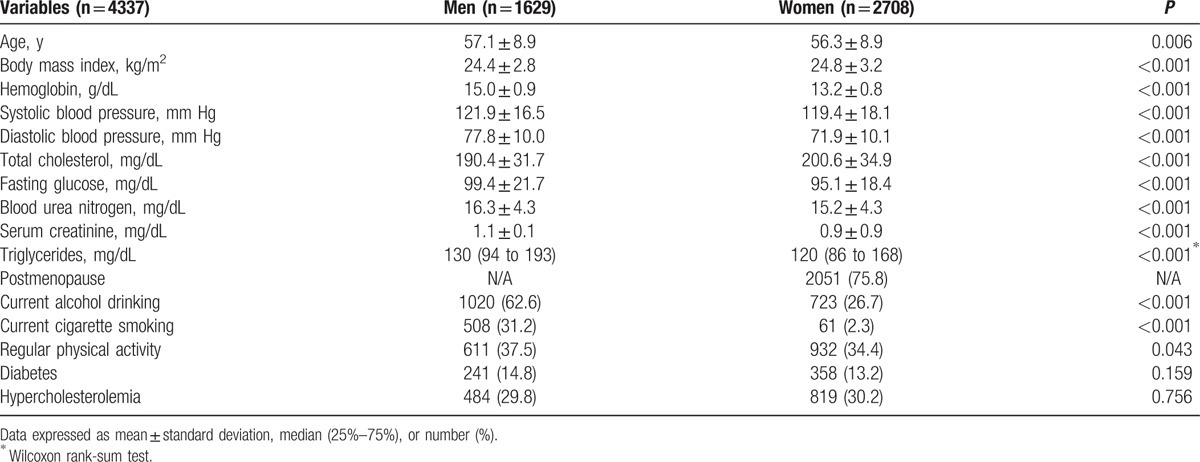
Baseline characteristics are shown separately for men and women in Table 1. Male participants were older and exhibited higher hemoglobin, SBP, DBP, fasting glucose, BUN, serum creatinine, and triglyceride levels than female participants, yet had lower BMI and total cholesterol levels. Cigarette smoking, alcohol drinking, and regular physical activity were more frequent in men than in women.
Table 1.
Baseline characteristics of the study participants by sex.
3.2. Cross-sectional association between hemoglobin and hypertension
Men with hypertension were older and presented with higher BMI, fasting glucose, serum creatinine, and triglyceride levels, and also higher frequencies of current alcohol drinking, diabetes, and hypercholesterolemia, than those without hypertension (Supplementary Table 1). For women, mean age, BMI, fasting glucose, BUN, creatinine, and triglyceride levels were significantly higher in the group with hypertension. Postmenopause, diabetes, and hypercholesterolemia were more frequent in women with hypertension, whereas current alcohol drinking was more common in those without hypertension. Mean baseline hemoglobin concentrations were significantly higher in men and women with hypertension than in those without hypertension (P = 0.002 for men, P = 0.006 for women).
Table 2 outlines the cross-sectional associations between hemoglobin concentration and hypertension for men, women, and all participants. In model 1, the fourth quartile group exhibited significantly higher odds for hypertension in men and women (OR 1.50, 95% confidence interval [CI] 1.12–2.02 for men; OR 1.38, 95% CI 1.11–1.73 for women). After adjusting for age, BMI, lifestyle factors, BUN, serum creatinine, and comorbidities, the relationship persisted, with statistically significant ORs of 1.47 (95% CI 1.06–2.05) for men and 1.39 (95% CI 1.09–1.77) for women.
Table 2.
Cross-sectional association between hemoglobin concentrations and hypertension at baseline.
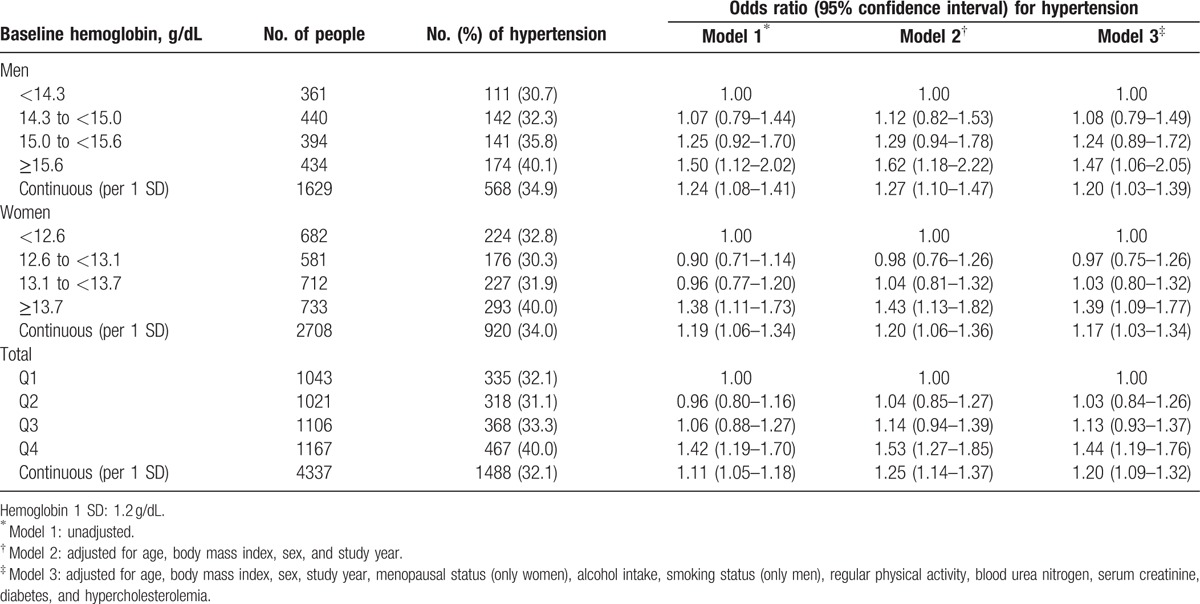
Among all participants, the fourth quartile group showed a significantly higher OR of 1.42 (95% CI 1.19–1.73) than that of the first quartile. For model 2, and even model 3, which was additionally adjusted for age, BMI, lifestyle factors, BUN, serum creatinine, and comorbidities, these associations persisted. We also observed a significant relationship of an increased prevalence of hypertension per 1 standard deviation (SD) increase in hemoglobin concentration in men, women, and all participants. Hemoglobin concentration as a continuous value was also associated with blood pressure with a linear shape (Fig. 1). Even after excluding people with hypertension, hemoglobin showed similar positive associations with SBP and DBP (Supplementary Table 2).
Figure 1.
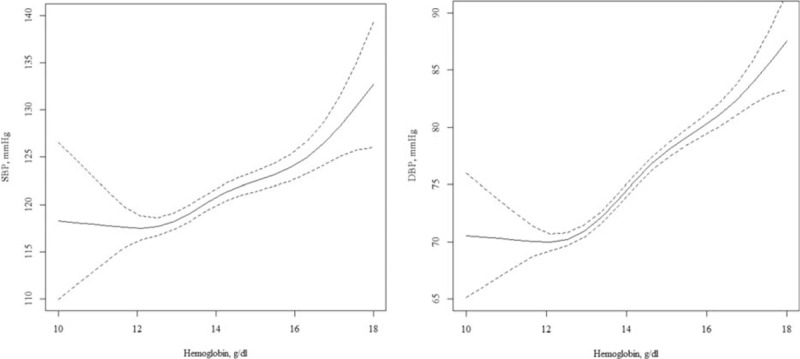
Cross-sectional association between hemoglobin and blood pressure in unadjusted model. Solid (dotted) lines present the odds ratio (95% confidence interval) for blood pressure in relation to hemoglobin, as a function of penalized regression splines.
3.3. Longitudinal association between baseline hemoglobin and incident hypertension
The RRs of incident hypertension at follow-up based on baseline hemoglobin levels for men, women, and all participants are shown in Table 3. Using model 1 for men, the RR of the fourth quartile group was 0.82 (95% CI 0.44–1.53), lower than that for the first quartile group, although the association was not significant. Covariate adjustment did not significantly change the null association. For women, the fourth quartile group exhibited a higher RR than the first quartile group, although the association was not significant (RR 1.44, 95% CI 0.91–2.28). After adjusting for age, BMI, lifestyle factors, BUN, serum creatinine, baseline commodities, and baseline SBP, the nonsignificant relationship persisted.
Table 3.
Relative risk of incident hypertension at follow-up according to baseline hemoglobin concentrations.
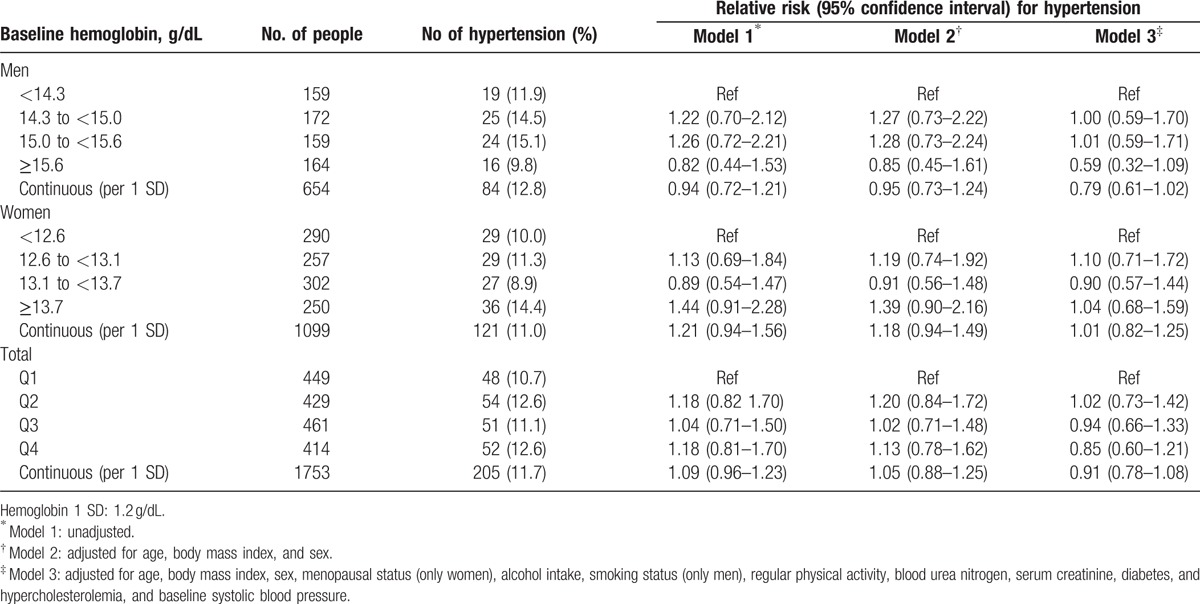
Among all participants, similar results were found. Regardless of adjustment, higher hemoglobin concentration was not associated with hypertension incidence. When we assessed the relationship between continuous hemoglobin and incident hypertension, we failed to observe any significant linear relationships in men, women, and all participants (Fig. 2). To adjust for follow-up time, we also performed Cox proportional hazards regression (Supplementary Table 3). However, the overall results of Cox proportional-hazards regression were similar to those of the generalized linear analysis, showing null association between hemoglobin and hypertension incidence regardless of adjustment. To exclude the effect of hypertensive drugs, we performed a further analysis (Supplementary Table 4). However, we could not find an association between high hemoglobin and high blood pressure at follow-up, regardless of sex.
Figure 2.
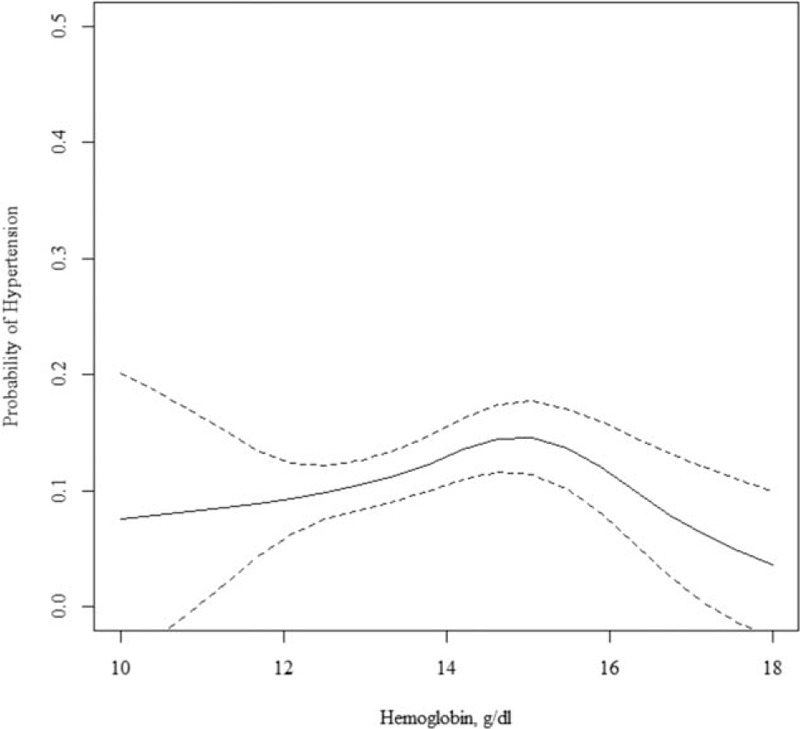
Longitudinal association between hemoglobin and incident hypertension in unadjusted model. Solid (dotted) lines present the relative risk (95% confidence interval) for incident hypertension in relation to hemoglobin, as a function of penalized regression splines.
4. Discussion
We observed a significant positive association between hemoglobin concentrations and the prevalence of hypertension in a rural Korean population. Even after excluding participants with hypertension at baseline, higher hemoglobin levels were significantly associated with higher SBP, DBP, and the presence of hypertension. Nevertheless, we did not observe a significant association between baseline hemoglobin and incident hypertension in the longitudinal analysis. We also performed a stratified analysis according to menopausal status, which is another known CVD risk factor[15,16]; however, the results did not change.
Previous studies have reported positive cross-sectional associations between hemoglobin and blood pressure.[2–4,6,17] A Dutch study reported that hemoglobin concentrations were positively associated with SBP and DBP in men and women after adjusting for age, BMI, and mean daily temperature.[2] A Japanese study demonstrated that higher hemoglobin concentrations were associated with hypertension in nonobese men and women.[3] In a Chinese study, higher hemoglobin concentrations, even within the normal range, were associated with a higher prevalence of hypertension and other cardiovascular risk factors.[4] A Korean study reported that hemoglobin showed significant positive associations with hypertension, SBP, and DBP in men and women after adjusting for age, BMI, total cholesterol, alcohol intake, smoking status, mild renal dysfunction, and diabetes mellitus.[6] Notwithstanding, a longitudinal relationship between hemoglobin and incident hypertension has not been fully evaluated.
Several mechanisms may explain the link between hemoglobin and hypertension. One such potential mechanism is blood viscosity, which may explain the positive cross-sectional association between hemoglobin and blood pressure. Earlier studies have reported that elevations of hematocrit and hemoglobin increase blood viscosity, which may in turn elevate blood pressure levels and worsen cardiovascular function.[17,18] However, other studies reported that blood pressure was not correlated with blood viscosity in healthy individuals,[10–12] due to shear stress regulation in the normotensive population.[19,20] However, this mechanism does not directly support the hypothesis that increased hemoglobin concentration is a causal factor of hypertension.
Other evidence suggests that a third factor may have an influence on both hemoglobin concentration and hypertension. First, the renin-angiotensin-aldosterone system may be related to both hemoglobin concentration and blood pressure. Renin is transformed to angiotensin-2, which causes vasoconstriction. In this process, other tissues may produce angiotensin-2 and stimulate erythropoietin production.[21,22] Second, endothelial cell damage may influence on blood pressure, and also hemoglobin concentration. An Italian study observed an inverse relationship between hemoglobin and forearm endothelium-dependent vasodilation in untreated hypertensive patients, but not in normotensive people.[23] Endothelial cell damage is also associated with the increased concentrations of growth factors[24] to regenerate tissues.[25,26] Several studies have reported that the concentration of serum hepatocyte growth factor concentration is positively associated with hypertension,[27,28] and also an increased hemoglobin concentration.[29] As growth factors enhance hematopoiesis, which produces erythrocytes,[30] hemoglobin levels may increase with increasing levels of growth factors.[29]
The present study had several limitations. First, our study population was limited to a single rural area and was not randomly selected. Therefore, our findings may not be generalizable to other populations. Second, although there was a 4.4-year follow-up period, we could not observe the change in hemoglobin concentration over this period. It is likely that the hemoglobin varied widely in this period, particularly in cases of women due to menstruation or delivery. Instead, we compared mean hemoglobin for women at baseline and follow-up according to status of menopause. However, we could not find a significant difference in hemoglobin between premenopausal and postmenopausal women (not shown). Third, our study potentially introduced measurement errors. We measured treatment history using a self-reported questionnaire; however, misclassification, if any, would likely be nondifferential misclassification bias. Fourth, hemoglobin levels are mainly affected by nutrition and iron metabolism; however, we did not control for nutritional effects. Fifth, the cross-sectional results could have shown a temporal association between hemoglobin and hypertension. However, we used a longitudinal analysis to counter this weak point of the study to explain the causality between hemoglobin and the development of the hypertension.
5. Conclusions
We reported a significant positive association between hemoglobin concentrations and the prevalence of hypertension in a rural Korean population. Even after excluding participants with hypertension at baseline, higher hemoglobin levels were significantly associated with higher SBP and DBP levels and the presence of hypertension. We did not observe a longitudinal association between higher hemoglobin and incident hypertension. Our findings suggest that higher hemoglobin per se may not contribute to the development of hypertension, although high hemoglobin levels are associated with high blood pressure in a cross-sectional view.
Supplementary Material
Footnotes
Abbreviation: BMI = body mass index, BUN = blood urea nitrogen, CVD = cardiovascular disease, DBP = diastolic blood pressure, KoGES = Korean Genome and Epidemiology Study, OR = odds ratio, RRs = relative risks, SBP = systolic blood pressure, SD = standard deviation.
Author contributions: NHK contributed to the study concept and design, performed the statistical analyses, and drafted and revised the manuscript. HCK contributed to the conception, design, analysis, and interpretation of data and revised the article. JML, JYL, HSY, JHL, and IS managed the data for the Korean Genome and Epidemiology Study and Ischemic Heart Disease Clinical Research Center. HCK is responsible for the overall content as a guarantor.
Funding: This work was supported by the Korea Centers for Disease Control and Prevention (2008-E71004–00, 2009-E71006–00) and the Korean Health Technology R&D Project, Ministry of Health & Welfare, Republic of Korea (HI13C0715).
The authors have no conflicts of interest to disclose.
Supplemental Digital Content is available for this article.
References
- 1.Lawes CM, Vander Hoorn S, Rodgers A. Global burden of blood-pressure-related disease, 2001. Lancet 2008; 371:1513–1518. [DOI] [PubMed] [Google Scholar]
- 2.Atsma F, Veldhuizen I, de Kort W, et al. Hemoglobin level is positively associated with blood pressure in a large cohort of healthy individuals. Hypertension 2012; 60:936–941. [DOI] [PubMed] [Google Scholar]
- 3.Shimizu Y, Nakazato M, Sekita T, et al. Association between the hemoglobin levels and hypertension in relation to the BMI status in a rural Japanese population: the Nagasaki Islands Study. Intern Med 2014; 53:435–440. [DOI] [PubMed] [Google Scholar]
- 4.Ren L, Gu B, Du Y, et al. Hemoglobin in normal range, the lower the better?-Evidence from a study from Chinese community-dwelling participants. J Thorac Dis 2014; 6:477–482. [DOI] [PMC free article] [PubMed] [Google Scholar]
- 5.Rasmussen JB, Mwaniki DL, Kaduka LU, et al. Hemoglobin levels and blood pressure are associated in rural black Africans. Am J Hum Biol 2016; 28:145–148. [DOI] [PubMed] [Google Scholar]
- 6.Lee S-G, Rim JH, Kim J-H. Association of hemoglobin levels with blood pressure and hypertension in a large population-based study: the Korea National Health and Nutrition Examination Surveys 2008–2011. Clin Chim Acta 2015; 438:12–18. [DOI] [PubMed] [Google Scholar]
- 7.Liu X, Liang J, Qiu Q, et al. Association of hematocrit and pre-hypertension among Chinese adults: the CRC study. Cell Biochem Biophys 2015; 71:1123–1128. [DOI] [PubMed] [Google Scholar]
- 8.Cabrales P, Han G, Nacharaju P, et al. Reversal of hemoglobin-induced vasoconstriction with sustained release of nitric oxide. Am J Physiol Heart Circ Physiol 2011; 300:H49–H56. [DOI] [PMC free article] [PubMed] [Google Scholar]
- 9.Cabrales P, Sun G, Zhou Y, et al. Effects of the molecular mass of tense-state polymerized bovine hemoglobin on blood pressure and vasoconstriction. J Appl Physiol 2009; 107:1548–1558. [DOI] [PMC free article] [PubMed] [Google Scholar]
- 10.Devereux RB, Case DB, Alderman MH, et al. Possible role of increased blood viscosity in the hemodynamics of systemic hypertension. Am J Cardiol 2000; 85:1265–1268. [DOI] [PubMed] [Google Scholar]
- 11.Vázquez BYS. Blood pressure and blood viscosity are not correlated in normal healthy subjects. Vasc Health Risk Manage 2012; 8:1. [DOI] [PMC free article] [PubMed] [Google Scholar]
- 12.Salazar Vázquez BY, Salazar Vázquez MA, Jáquez MG, et al. Blood pressure directly correlates with blood viscosity in diabetes type 1 children but not in normals. Clin Hemorheol Microcirc 2010; 44:55–61. [DOI] [PubMed] [Google Scholar]
- 13.Baik I, Shin C. Prospective study of alcohol consumption and metabolic syndrome. Am J Clin Nutr 2008; 87:1455–1463. [DOI] [PubMed] [Google Scholar]
- 14.Hagstrom E, Hellman P, Larsson TE, et al. Plasma parathyroid hormone and the risk of cardiovascular mortality in the community. Circulation 2009; 119:2765–2771. [DOI] [PubMed] [Google Scholar]
- 15.Chang C-J, Wu C-H, Yao W-J, et al. Relationships of age, menopause and central obesity on cardiovascular disease risk factors in Chinese women. Int J Obesity 2000; 24:1699–1704. [DOI] [PubMed] [Google Scholar]
- 16.Rosano G, Vitale C, Marazzi G, et al. Menopause and cardiovascular disease: the evidence. Climacteric 2007; 10 (S1):19–24. [DOI] [PubMed] [Google Scholar]
- 17.Göbel BO, Schulte-Göbel A, Weisser B, et al. Arterial blood pressure Correlation with erythrocyte count, hematocrit, and hemoglobin concentration. Am J Hypertension 1991; 4 (1 Pt 1):14–19. [PubMed] [Google Scholar]
- 18.Lowe G, Lee A, Rumley A, et al. Blood viscosity and risk of cardiovascular events: the Edinburgh Artery Study. Br J Haematol 1997; 96:168–173. [DOI] [PubMed] [Google Scholar]
- 19.Martini J, Carpentier B, Negrete AC, et al. Paradoxical hypotension following increased hematocrit and blood viscosity. Am J Physiol Heart Circ Physiol 2005; 289:H2136–H2143. [DOI] [PubMed] [Google Scholar]
- 20.Vazquez B, Vazquez M, Jáquez MG, et al. Blood pressure directly correlates with blood viscosity in diabetes type 1 children but not in normals. Clin Hemorheol Microcirc 2009; 44:55–61. [DOI] [PubMed] [Google Scholar]
- 21.Freudenthaler S, Schenck T, Lucht I, et al. Fenoterol stimulates human erythropoietin production via activation of the renin angiotensin system. Br J Clin Pharmacol 1999; 48:631–634. [DOI] [PMC free article] [PubMed] [Google Scholar]
- 22.Biaggioni I, Robertson D, Krantz S, et al. The anemia of primary autonomic failure and its reversal with recombinant erythropoietin. Ann Intern Med 1994; 121:181–186. [DOI] [PubMed] [Google Scholar]
- 23.Maio R, Sciacqua A, Bruni R, et al. Association between hemoglobin level and endothelial function in uncomplicated, untreated hypertensive patients. Clin J Am Soc Nephrol 2011; 6:648–655. [DOI] [PMC free article] [PubMed] [Google Scholar]
- 24.Nakamura Y, Morishita R, Higaki J, et al. Hepatocyte growth factor is a novel member of the endothelium-specific growth factors: additive stimulatory effect of hepatocyte growth factor with basic fibroblast growth factor but not with vascular endothelial growth factor. J Hypertension 1996; 14:1067–1072. [DOI] [PubMed] [Google Scholar]
- 25.Kawaida K, Matsumoto K, Shimazu H, et al. Hepatocyte growth factor prevents acute renal failure and accelerates renal regeneration in mice. Proc Natl Acad Sci 1994; 91:4357–4361. [DOI] [PMC free article] [PubMed] [Google Scholar]
- 26.Schmidt C, Bladt F, Goedecke S, et al. Scatter factor/hepatocyte growth factor is essential for liver development. Nature 1995; 373:699–702. [DOI] [PubMed] [Google Scholar]
- 27.Nakamura Y, Morishita R, Nakamura S, et al. A vascular modulator, hepatocyte growth factor, is associated with systolic pressure. Hypertension 1996; 28:409–413. [DOI] [PubMed] [Google Scholar]
- 28.Nakamura S, Moriguchi A, Morishita R, et al. A novel vascular modulator, hepatocyte growth factor (HGF), as a potential index of the severity of hypertension. Biochem Biophys Res Commun 1998; 242:238–243. [DOI] [PubMed] [Google Scholar]
- 29.Kadota K, Shimizu Y, Nakazato M, et al. Hemoglobin as a response marker of endothelial cell damage in elderly nonoverweight non-anemic subjects. Acta Medica Nagasakiensia 2016; 60:103–108. [Google Scholar]
- 30.Takai K, Hara J, Matsumoto K, et al. Hepatocyte growth factor is constitutively produced by human bone marrow stromal cells and indirectly promotes hematopoiesis. Blood 1997; 89:1560–1565. [PubMed] [Google Scholar]
Associated Data
This section collects any data citations, data availability statements, or supplementary materials included in this article.


