

Abstract
Researchers and the general public have become increasingly intrigued by the roles that systematic tendencies toward thinking, feeling, and behaving might play in academic achievement. Some measures belonging to this group have been well studied in genetics and psychometrics, while much less is known about other measures. The current study focuses on seven such character traits prominently featured in influential intervention-oriented and/or socialization theories of academic achievement: grit, intellectual curiosity, ability self-concept, mastery orientation, educational value, intelligence mindset, and test motivation. In a population-based sample of 811 school-aged twins and triplets from the Texas Twin Project, we tested (a) how each measure relates to indices of the Big Five personality traits, (b) how the measures relate to one another, (c) the extent to which each measure is associated with genetic and environmental influences and whether such influences operate through common dimensions of individual differences, and (d) the extent to which genetic and environmental factors mediate the relations between fluid intelligence, character measures, and academic achievement. We find moderate relations among the measures that can be captured by a highly heritable common dimension representing a mixture of Openness and Conscientiousness. Moreover, genetically-influenced variance in the character measures is associated with multiple measures of verbal knowledge and academic achievement, even after controlling for fluid intelligence. In contrast, environmentally-influenced variance in character is largely unrelated to knowledge and achievement outcomes. We propose that character measures popularly used in education may be best conceptualized as indexing facets of personality that are of particular relevance to academic achievement.
Keywords: Character, Noncognitive Skills, Soft Skills, Academic Achievement, Behavioral Genetics
“Courage, hard work, self-mastery, and intelligent effort are all essential to successful life. Character, in the long run, is the decisive factor in the life of an individual and of nations alike.”
-President Theodore Roosevelt, Inscribed in the Rotunda of the American Museum of Natural History, New York, NY
Features of character, such as those mentioned by President Theodore Roosevelt in the quote above, have long been considered core determinants of academic, economic, and general life achievement. Particularly in recent years, the concept of character has captured the attention of the general public and of scientists alike.1 Putative measures of character have proliferated, as have the terms used to refer to this increasingly motley assortment of constructs. Measures of character range widely and include indices of effort and intellectual curiosity; self-concept, attitudes toward education, and beliefs in the malleability of intelligence; as well as empathy and emotional intelligence. Researchers have at once referred to this assortment as encompassing character, noncognitive skills, soft skills, and motivational factors. Many of these terms have been criticized as problematic, if not misnomers altogether. For instance, the term “noncognitive,” which is used to refer to determinants of life success other than “cognitive ability” and “intelligence,” is not only defined by what is not- rendering it potentially overly broad- but is often used to refer to tendencies toward thinking about and interpreting the world that clearly involve cognitive processing (Duckworth, 2009). At the same time, it seems that some researchers prefer these more ambiguous terms to established terms such as personality, traits, and abilities, perhaps so as to avoid implying that the constructs under investigation might be fixed, genetically-influenced, or even stable over time. For the purposes of the current report, we use the term character to refer to these behavioral tendencies, not because we view them as conceptually different from personality, but rather to demark their prominence, if not origins, in areas of psychology outside of mainstream personality psychology. We focus specifically on measures of character that have featured prominently in either socially-oriented or intervention-oriented theories of childhood academic achievement (e.g., Dweck, 2006; Meece, Anderman, & Anderman, 2006; Wigfield & Eccles, 2000). These include grit, intellectual curiosity, intellectual self-concept, desire to learn, test motivation, and having positive attitudes toward education. In a genetically-sensitive twin design, we investigate how these character measures relate to measures of the Big Five personality traits, to one another, to fluid intelligence, and to academic achievement.
From an empirically-informed vantage point, a focus on character is justified by the fact that although cognitive abilities reliably account for substantial portions of variation in academic achievement and occupational success, they do not account for all the variation, leaving room for factors other than cognitive ability to account for additional variation. Indeed, the discovery and validation of new measures of character that are predictive of academic success could lead to richer and more accurate models of development, as well as benefits for society. For instance, well-validated character measures could be used to identify children in greatest need of interventions to prevent low academic achievement, and character traits could themselves be the targets of educational interventions to boost academic achievement. As Duckworth (2009) has written,
“recent meta-analyses (e.g., Kuncel & Hezlett, 2007) should lay to rest any doubt over whether high-stakes standardized tests predict important academic and professional outcomes—they do. The challenge now is to identify noncognitive individual differences that determine the same outcomes.”
However – in clear conflict with the empirical evidence – character frequently seems to be referenced as a counterpoint to cognitive ability, with some individuals even calling for the wholesale replacement of performance-based tests of ability and aptitude with measures of character. For instance a recent essay in the highly respected journal Nature advocated that graduate programs “diminish reliance on GRE and instead augment current admissions practices with proven markers of achievement, such as grit and diligence” (Miller and Stassun, 2014).2 This statement conflicts with the consistently strong evidence for the validity of performance-based tests while at the same time promoting a possibly overly-optimistic perspective that measures of grit and diligence are “proven” predictors of achievement.
Other statements about character have amounted to little more than speculation. For instance, in a seminal paper on the topic, Heckman and Rubinstein (2001) wrote “the literature on cognitive tests ascertains that one dominant factor (‘g’) summarizes cognitive tests and their effects on outcomes. No single factor has yet emerged to date in the literature on noncognitive skills, and it is unlikely that one will ever be found.” Of course, under definitions of “noncognitive skills” that include every aspect of the individual other than cognitive ability, this speculation is virtually guaranteed to be true. Nevertheless, Heckman and Rubinstein's quote highlights an issue that has persisted for the fifteen years since their article was published: There has been very little factor-analytic work on how different character measures, particularly those used in educational contexts, interrelate. For instance, how does mastery achievement goal orientation (i.e., the desire to learn for the purpose of understanding the material and improving one's skills) or intelligence mindset (i.e., the belief that people are capable of increasing their skills with hard work) relate to grit (i.e., effortful persistence over long periods of time)? Some researchers (e.g., Wigfield & Eccles, 2000) have proposed and tested cascade models in which one set of character traits leads to others, but we are not aware of research that has comprehensively estimated interrelations among a broad set of educationally-relevant character measures, or used factor analysis to test whether a broad dimension (or dimensions) underlies such interrelations. The structure of covariation among different character measures is particularly important for basic questions of convergent and discriminant validity (Campbell & Fiske, 1959; Cronbach & Meehl, 1955). Should a broad character dimension be identified, it could potentially provide a parsimonious account of the interrelations among many specific character measures and their associations with academic achievement. Indeed, by capitalizing on information from many different character measures, such a dimension could prove to have greater reliability and criterion validity than would any one measure by itself.
A second example of public conjecture outpacing empirical science concerns the extent of genetic influence on character. For instance, in a 2013 Washington Post interview (Tam, 2013) alluding to the well-known tendency for psychological traits to be heritable (Turkheimer, 2000), Angela Duckworth, the originator of the grit scale, commented, “There haven't been genetic studies on grit but we often think that challenge is inherited but grit is learned. That's not what science says. Science says grit comes from both nature and nurture.” In seeming contradiction, Tough (2013, p. 196) has written, “character strengths that matter so much to young people's success are not innate; they don't appear to us magically, as a result of good luck or good genes.” This presumption that genetic differences are irrelevant for character perhaps reflects the view that such factors are counterpoints to cognitive abilities, for which genetic influences are established to the point of infamy. Notwithstanding such presumptions, there have indeed been behavioral genetic studies on many commonly studied character traits. In particular, intellectual interest, intellectual self-concept, and achievement motivation have been examined in some notable behavioral genetic studies (Tucker-Drob & Harden 2012a; Tucker-Drob & Harden, 2012b; Greven, Harlaar, Kovas, Chamorro-Premuzic, and Plomin, 2009; Kovas et al., 2015), all of which have reported moderate heritability estimates. For many other character traits, such as grit, attitudes toward education, achievement goal orientation, and intelligence mindsets, there indeed has been very little genetically-informed work to speak of.
There has, however, been extensive work establishing both genetic and environmental influences on individual differences in the Big Five personality traits and their facets (Briley & Tucker-Drob, 2014; Loehlin, 1992), which may serve as partial bases for variation in character traits commonly studied in educational contexts. Indeed, relations between psychometric measures of personality (i.e., the Big Five) and many character measures are well studied. For example, intellectual engagement and self-perceived intelligence are two core features of Openness/Intellect (DeYoung, 2007); intellectual curiosity has been strongly linked with Openness and moderately linked with Conscientiousness (von Stumm, Hell, & Chamorro-Premuzic, 2011); and grit has been found to have strong relations with, and is sometimes considered a facet of, Conscientiousness (Roberts, Lejuez, Krueger, Richards, & Hill, 2012). However, for many other character measures, such as mastery orientation, attitudes toward education, and mindsets, relations with the Big Five are largely unknown. This is a fundamentally important question, as the Big Five represent the major dimensions of covariation among a highly diverse universe of personality questionnaire items derived via sampling from multiple linguistic lexicons (Goldberg, 1990; John, Naumann, & Soto, 2008) and can therefore serve as an atlas onto which finer-grained character traits can be positioned. Investigating the extent to which character measures capture systematic variance unique of the Big Five is necessary for determining whether educational psychologists have identified constructs that can be used to enrich theory, leveraged for the purposes of more accurate assessment and prediction, and/or specifically targeted by new policies and interventions.
Building on the question of genetic and environmental etiology of character, it is important to examine whether the criterion validity of character measures occurs through genetic or environmental pathways. Prominent theoretical models from educational psychology have primarily focused on environmental experiences as the dominant mechanisms for the effects of character on academic achievement. For instance in the Wigfield & Eccles (2000, p. 69) model of academic achievement, “achievement-related experiences” and “socializers' beliefs and behaviors” are two of the focal determinants of variation in character. Environmentally-influenced character traits, in turn, are postulated to lead to academic achievement via “choice of achievement tasks, persistence on those tasks, vigor in carrying them out, and performance on them” (p. 68). Similarly, in describing their research on intelligence mindset, Blackwell, Trzesniewski, & Dweck (2007) hypothesized that “many of the important social environmental conditions have an influence [on academic achievement] through the psychology of the child” (p. 259).
Transactional models from behavioral genetics also focus on environments as fundamental to academic achievement, but posit that environments are nonrandomly experienced. According to such models, selection into environments occurs systematically on the basis of individual differences that are themselves genetically influenced, and that the effects of environmental experience therefore serve to differentiate children further by genotype (Scarr & McCartney, 1983; Tucker-Drob, Briley, & Harden, 2013). To elaborate, children are hypothesized to differ (in part because of genetic differences and in part because of variation in environmental experiences) in their propensities to seek out and engage with educational and intellectual experiences. In other words, character traits act as “Experience Producing Drives” (Hayes, 1962; Bouchard, 1997; Johnson, 2010; Tucker-Drob & Harden, in press; von Stumm & Ackerman, 2013). For example, a child with a mastery achievement orientation is predicted to seek challenging learning experiences, to evoke these challenging experiences from the individuals (peers, parents, teachers) and institutions (schools) in their proximal environments, and to maintain focus and attention during these challenging experiences. Both genes and environments are expected to influence mastery orientation and other character traits that drive children to select, evoke, and attend to environmental experiences that foster achievement. However, these experiences are hypothesized to have appreciable effects on academic achievement only when they are sustained or recur over long periods of time. As genetic sources of variation in personality are more likely than exogenous sources of environmental variation to exhibit high levels of stability earlier in life (Briley & Tucker-Drob, 2014; Dickens & Flynn, 2001; Tucker-Drob & Briley, 2014), genetically-influenced variation in character is expected to serve as the primary basis for the link between character traits and academic achievement (Johnson, 2012; Tucker-Drob, Briley, & Harden, 2013; Tucker-Drob & Harden, 2012a,b; Tucker-Drob & Harden, in press). As put by Hayes (1962), “inherited motivational makeup influences the kind and amount of learning which occurs.” Consistent with these predictions, Tucker-Drob and Harden (2012a) reported that genetic influences on adolescent intellectual interest partially mediated its association with a general factor of academic achievement; and Greven, Harlaar, Kovas, Chamorro-Premuzic, and Plomin (2009) reported that intellectual self-concept was genetically associated with both concurrent and later achievement independent of intelligence. Luciano, Wainwright, Wright, & Martin (2006) and Wainwright, Wright, Luciano, Geffen, and Martin (2008) reported genetic correlations between academic achievement and intelligence, and facets of Conscientiousness and Openness, respectively. We are not aware of any studies that have performed similar investigations with other popularly used character measures, such as mindset, grit, or mastery orientation.
Finally, although measures of character are often referred to as “noncognitive” on the basis of their conceptual distinction from cognitive ability, research on the criterion validity of many such measures for academic achievement has not commonly controlled for variance that they potentially share with cognitive ability (Tucker-Drob & Harden, in press). This is important for ruling out the possibility that the relation between character traits and academic achievement stems from “third variable causation,” in which cognitive ability causes both academic achievement and character. It is plausible, for instance, that individuals higher in cognitive ability have a greater tendency to view themselves as more intelligent, to hold greater value in education, to be more interested in intellectually engaging experiences, and to be more motivated to perform well in testing situations, even if such beliefs and behaviors do not directly benefit their achievement. Demonstrating that character traits are related to academic achievement above and beyond cognitive ability would suggest a role for character in achievement beyond that of simple third-variable confounding by cognitive ability.
The current project, therefore, addressed five core questions regarding character. First, how do different measures of character relate to the Big Five personality traits? Second, how do different measures of character relate to one another, and what is the factor structure underlying these relations? Third, to what extent are measures of character associated with genetic and environmental influences, and do such influences operate through a common dimension, or dimensions, of individual differences? Fourth, to what extent are measures of character associated with academic achievement, above and beyond fluid intelligence, and fifth, to what extents are these associations mediated by genetic and environmental pathways?
Method
Participants
Analyses were based on data from an ethnically and socioeconomically diverse population-based sample of 811 3rd-8th grade twins and triplets from the Texas Twin Project (Harden, Tucker-Drob, & Tackett, 2013) who participated in an ongoing in-laboratory study of personality, cognitive development, and academic achievement. Participant age ranged from 7.80 to 15.25 years (M=10.91, SD=1.75), with the majority of the age distribution falling between ages 8.0 and 14.0 years. Only 2.5% of participants were under 8.0 years of age and only 2.7% of participants were older than 14.0 years of age. The sample was 51.2% female, 61.4% non-Hispanic White, 18.4% Hispanic, 6.9% African American, 3.0% Asian, 1.2% other, 9.1% multiple races or ethnicities. Additionally, 35% of families reported having received a form of means-tested public assistance, such as food stamps, at some time since the twins or multiples were born. Average IQ, as measured by the Wechsler Abbreviated Scale of Intelligence-II (WASI-II; Weschler, 2011), was 103.65 (SD = 14.14). This sample size is comparable to that of other well-established twin studies of childhood academic achievement, such as the Western Reserve Reading and Math Project (Petrill, Deater-Deckard, Thompson, Thorne, & Schatschneider, 2006) and International Longitudinal Twin Study (Rhea, Gross, Haberstick, & Corley, 2006).
Zygosity for same sex twins was determined by latent class analysis using parents' and examiners' ratings of similarity of a number of specific physical characteristics (e.g., hair texture). Latent class analysis of physical similarity ratings has been found to be more than 99% accurate, as validated by genotyping (Heath, 2003). The sample consisted of 431 unique sibling pairs (380 twin pairs and 51 pairs from triplet sets): 141 pairs (32.7%) were classified as monozygotic (MZ), 147 pairs (34.1%) were classified as same-sex dizygotic (DZ), and 143 pairs (33.2%) were opposite-sex DZ.
Measures
Measures consisted of child-self reports of character and personality, an examiner rating of test motivation, and a number of performance-based measures of fluid intelligence, verbal knowledge, and academic achievement. As detailed in Table 1, sample sizes for individual measures ranged from N=621 (Grit) to N=810 (Spatial Relations). Missing data typically resulted from failures to complete all measures or tasks within the allocated time periods during the laboratory visit.
Table 1.
Descriptive statistics for study outcomes, and relations to age and sex.
| Unstandardized Regression Coefficients | |||||||||
|---|---|---|---|---|---|---|---|---|---|
|
|
|||||||||
| Outcome Variable | Number of Items | Sample Size | Internal Consistency (Alpha) | Possible Range | Mean | SD | Age | Sex | Age × Sex |
| Grit | 8 | 621 | 0.706 | 1-5 | 3.235 | 0.548 | 0.026 | 0.013 | -0.052 |
| Need Cognition | 9 | 796 | 0.671 | 1-5 | 3.437 | 0.546 | 0.045 | -0.058 | 0.004 |
| Intel Self-Cncpt | 7 | 632 | 0.766 | 1-5 | 3.798 | 0.564 | 0.049 | 0.038 | -0.052 |
| Mastery | 5 | 743 | 0.799 | 1-5 | 4.281 | 0.695 | 0.011 | -0.106 | -0.006 |
| Educ. Attitude | 6 | 744 | 0.775 | 1-5 | 3.026 | 0.880 | 0.137 | -0.110 | 0.014 |
| Increm Mindset | 6 | 759 | 0.837 | 1-5 | 2.714 | 0.861 | 0.096 | 0.065 | 0.020 |
| Test Motivation | 1 | 774 | n/a | 1-7 | 5.088 | 1.396 | 0.227 | -0.434 | -0.012 |
| BFI-Openness | 10 | 798 | 0.732 | 1-5 | 3.840 | 0.534 | 0.045 | -0.113 | -0.045 |
| BFI-Conscientiousness | 9 | 798 | 0.721 | 1-5 | 3.499 | 0.577 | 0.002 | -0.054 | -0.013 |
| BFI-Extraversion | 8 | 798 | 0.575 | 1-5 | 3.372 | 0.531 | 0.040 | 0.015 | -0.003 |
| BFI-Agreeableness | 9 | 798 | 0.695 | 1-5 | 3.704 | 0.498 | 0.012 | -0.089 | 0.018 |
| BFI-Neuroticism | 8 | 798 | 0.647 | 1-5 | 2.768 | 0.569 | -0.010 | -0.123 | -0.031 |
| BFI-Acquiescence | 16* | 798 | 0.612 | 1-5 | 3.180 | 0.255 | 0.034 | 0.011 | -0.016 |
| Block Design | 13 | 807 | 0.832 | 0-71 | 27.012 | 13.156 | 0.269 | 0.191 | 0.002 |
| Matrix Reasoning | 30 | 807 | 0.864 | 0-30 | 18.154 | 4.641 | 0.237 | 0.032 | -0.053 |
| Spatial Relations | 26 | 810 | 0.717 | 0-26 | 14.156 | 3.381 | 0.284 | 0.024 | -0.036 |
| Passage Comprehension | 47 | 764 | 0.860 | 0-47 | 30.474 | 4.912 | 0.341 | -0.171 | -0.043 |
| Calculations | 45 | 749 | 0.905 | 0-45 | 20.617 | 5.956 | 0.443 | -0.059 | -0.057 |
| Vocabulary | 31 | 807 | 0.854 | 0-59 | 29.670 | 6.884 | 0.317 | -0.171 | -0.033 |
| Similarities | 24 | 807 | 0.821 | 0-45 | 24.301 | 5.727 | 0.289 | -0.016 | -0.001 |
Note: BFI=Big Five Inventory. Acquiescence was computed from 16 pairings of items from the BFI with opposite meanings. Age was mean-centered for all regressions. Sex was coded as 0=female, 1=male. Regressions for Block Design, Matrix Reasoning, Spatial Relations, Passage Comprehension, Calculations, Vocabulary, and Similarities were conducted on Z-transformed dependent variables. Bolded regressions coefficients are significant at p<.05.
Intellectual Interest (Need for Cognition)
Intellectual interest is curiosity about and desire to engage in intellectually challenging tasks and experiences. This construct has also been labeled “need for cognition” and “intellectual engagement” (Ackerman, 1992; Woo, Harms, & Kuncel, 2007). Expectancy-Value (EV) theory (Wigfield & Eccles, 2000; Nagengast, Marsh, Scalas, Xu, Hau, & Trautwein, 2011) holds that an individual's academic achievement is jointly determined by the expectation that the student is capable of learning and achieving (expectancies) and the view that learning and achieving are valuable goals (values). In EV theory, intellectual interest is a value (Wigfield & Eccles, 2000). Intellectual interest has also been described as the “third pillar” of academic performance (after intelligence and conscientiousness; Von Stumm, Hell, & Chamarro-Premuzic, 2011, p. 574).
To measure intellectual interest, we used a nine-item version of the Need for Cognition Scale adapted for children by Kokis, Macpherson, Toplak, West, and Stanovich (2002) from Cacioppo, Petty, & Feng (1984). Example items include “I like hard problems instead of easy ones” and “I like to be in charge of a problem that needs lots of thinking.” Need for Cognition has been shown to be statistically indistinguishable from Goff and Ackerman's (1992) Typical Intellectual Engagement measure (Woo, Harms, & Kuncel, 2007).
Intellectual Self-Concept
Intellectual self-concept is an individual's self-perceived intellectual ability. That is, does a child consider herself to be smart and capable of learning? Self-perceived ability, is a key construct in a number of theories of motivation and academic achievement. For example, in EV theory (Wigfield & Eccles, 2000) intellectual self-concept is considered an expectancy about the ability to learn. Similarly, Chamorro-Premuzic and Furnham (2004) have hypothesized that intellectual self-concept may predict performance through an “expectancy effect.” We assessed intellectual self-concept with the item “I am smart,” as well as with six items from the intellectual investment subscale of the MAPS (Briley, Domiteaux, & Tucker-Drob, 2014). Examples include “I quickly get the idea of things,” “I am able to find things out by myself,” and “I am not full of ideas” (reverse coded).
Mindsets
According to Dweck's (2000, 2006) mindsets theory, an entity mindset is the view that intelligence is fixed and difficult to change, and an incremental mindset is the view that intelligence is malleable. Individuals with an entity mindset are predicted to devote less effort toward learning, whereas those who have an incremental mindset are predicted to devote more effort in learning and to therefore exhibit greater academic achievement. Entity and incremental mindsets of intelligence are conceptualized and measured as two ends of a single dimension. We used the same six-item measure developed and routinely used by Carol Dweck. Examples include “You have a certain amount of intelligence, and you really can't do much to change it” (entity mindset) and “You can always greatly change how intelligent you are” (incremental mindset). Data were coded such that higher scores indicated more of an incremental, and less of an entity, mindset.
Effortful Persistence (Grit)
Duckworth et al. (2007) define grit as “perseverance and passion for long-term goals. Grit entails working strenuously toward challenges, maintaining effort and interest over years despite failure, adversity, and plateaus in progress.” They write that “Our hypothesis [is] that grit is essential to high achievement” (p. 1087-1088). Duckworth et al. (2007) and Duckworth and Quinn (2009) report that, of the Big Five personality traits, conscientiousness is most strongly related to grit. However, they do report incremental prediction of achievement by grit beyond the Big Five. We used the eight-item Grit Scale for Children (adapted from Duckworth & Quinn, 2009), which we obtained from Angela Duckworth's website (https://upenn.box.com/8itemgritchild). Examples include “I finish whatever I begin” and “I often set a goal but later choose to pursue (follow) a different one” (reverse scored).
Achievement Goal Orientation
Achievement goal theory proposes that the overarching goal of high academic achievement can be bifurcated into two conceptually and empirically distinguishable goal orientations (Kaplan & Maehr, 2007; Meece, Anderman, & Anderman, 2006). Mastery goal orientation is the motivation to learn for the sake of understanding the material, acquiring knowledge, and improving one's skills. Performance goal orientation is the motivation to excel relative to one's peers, achieve high grades, and avoid being viewed as incompetent or failing. Mastery goal orientation consistently predicts positive academic achievement outcomes, but studies of performance goal orientation have been inconsistent, with some studies reporting positive associations with academic achievement and other studies reporting negative associations with academic achievement (Hulleman, 2010; Meece et al., 2006). Therefore, we focused exclusively on a measure of mastery goal orientation, which we obtained from the five-item Mastery Goal Orientation (Revised) scale from the Patterns of Adaptive Learning Scales (PALS; Midgley et al., 2000). Example items include “One of my goals in class is to learn as much as I can” and “It's important to me to that I thoroughly understand my class work.”
Attitudes toward Education
Children's beliefs about the relevance of academic achievement for their future success in life may affect the amount of effort that they put into learning and academic achievement. In EV theory, attitudes toward education are considered values that influence whether children invest effort in school success. We used the six-item Skepticism about the Relevance of School for Future Success scale from the PALS (Midgley et al., 2000). Examples include “Doing well in school doesn't improve my chances of having a good life when I grow up,” and “Getting good grades in school won't guarantee that I will get a good job when I grow up.” Data were coded such that higher scores indicated lower skepticism.
Test Motivation
Researchers employing objective (i.e., performance-based) tests seek to minimize the role of individual differences in test motivation on test scores, in order to obtain pure markers of maximal performance (Cronbach, 1949). However, rather than interfering with the criterion validity of objective tests, individual differences in test motivation may serve as a mechanism of criterion validity, because motivation during cognitive testing reflects typical levels of motivated and controlled behavior in daily life. In previous work, ratings of motivation from 15-minute video recordings of children's behavior during an intelligence test predicted school achievement, as well as employment status, educational attainment, and lifetime criminal convictions in early adulthood (Duckworth et al., 2011). Similarly, a composite measure of “self-control” that included examiner-ratings of children's impulsive and inattentive behavior during cognitive and motor testing predicted later school performance, health, wealth, and criminal convictions (Moffitt et al., 2011). For the current project, we asked examiners to make a single rating of how motivated the participant behaved during the assessment: “On the whole, how motivated did the participant appear to do well on the tasks?” (Different examiners were assigned to each member of a twin/multiple set.)
The Big Five Personality Traits
The Big Five personality traits (Openness, Conscientiousness, Extraversion, Agreeableness, and Neuroticism) represent five general dimensions of thinking, feeling, and behaving that are relatively stable across time and context (Briley & Tucker-Drob, 2014; John, Naumann, & Soto, 2008). The Big Five traits were not specifically constructed for the purposes of educational research but have often been used to predict educational outcomes. Meta-analysis indicates that the Big Five traits most predictive of academic achievement are Conscientiousness and Openness (Poropat, 2009). We measured the Big Five using the child version of the Big Five Inventory (BFI; John et al., 2008), which we obtained from Oliver John's website (https://www.ocf.berkeley.edu/∼johnlab/bfi.php). Example items include “I am someone who is talkative” (Extraversion), “I am someone who is helpful and unselfish with others” (Agreeableness), “I am someone who is relaxed, handles stress well” (Neuroticism), “I am someone who is curious about many different things” (Openness), and “I am someone who tends to be disorganized” (Conscientiousness, reverse coded). The BFI was created specifically with the intention of sampling broadly from the content space of each of the Big Five traits in order to create short scales representing the canonical elements of each factor that save testing time and thus avoid participant boredom and fatigue (John et al., 2008), issues particularly relevant to research in child samples.
Acquiescence
Acquiescence refers to the tendency of a participant to systematically respond at the upper range (“yea-saying”) or lower range (“nay-saying”) of a likert scale, regardless of item content. Acquiescence was computed from the BFI using the method described by Soto, John, Gosling, & Potter (2008). This was achieved by computing the mean response to 16 pairs of BFI items with opposite implications for personality.
Fluid Intelligence
Fluid intelligence (Gf) represents the ability to reason abstractly, and is typically measured using tests that do not explicitly rely on declarative knowledge (Cattell, 1941; Cattell, 1971/1987; Horn, 1965; Tucker-Drob, 2009). We measured fluid intelligence with Matrix Reasoning and Block Design from the Wechsler Abbreviated Scale of Intelligence-II (Wechsler, 2011), and Spatial Relations adapted from the Woodcock Johnson Tests of Cognitive Abilities-III (Woodcock, McGrew, & Mather, 2001).
Verbal Knowledge
We measured verbal knowledge with the Vocabulary and Similarities tests from the Wechsler Abbreviated Scale of Intelligence-II (Wechsler, 2011).
Academic Achievement
We measured mathematics achievement with the Calculations test, and reading achievement with the Passage Comprehension test, both from the Woodcock Johnson Tests of Achievement-III (Woodcock, McGrew, & Mather, 2001).
Phenotypic Results
All correlations, regressions, factor models, and structural equations models were fit using full information maximum likelihood estimation in Mplus (Muthén & Muthén, 2012). Phenotypic models corrected standard errors for nesting of individuals within pairs (using the TYPE = COMPLEX feature in Mplus).
Descriptive Statistics
Basic descriptive information, including internal consistency, means, standard deviations, and relations with age and sex are reported for all study outcomes in Table 1. All variables were approximately normally distributed, with the exception of Mastery Orientation and Attitudes toward Education, which displayed ceiling effects that could not be corrected via transformation. Using the CENSORED option in Mplus, we fit initial models using Tobit link functions (Tobin, 1958) to correct for these ceiling effects. Results from this approach were very similar to results of models with no such provisions. As the Tobit approach is computationally demanding and is difficult to implement in the context of behavioral genetic models, we report results of models that did not implement the Tobit approach.
Internal consistencies for all outcomes were generally in the acceptable-to-very good range (∼.6-.8). That internal consistencies of the self-report measures were not typically in the very high (.9+) range can likely be attributed to a combination of the fact that each measure consisted of 10 or fewer items and that most of the measures sampled widely from the range of the content space for the target construct (Little, Lindenberger, & Nesselroade, 1999). There was a tendency for many of the character measures to have positive relations with age. All subsequent analyses were based on variables residualized for age, sex, and age × sex.
Associations among Character Measures
Correlations among the seven character measures, as well as their correlations with acquiescent responding, are reported in the lower diagonal of Table 2. It can be seen that the character measures tended to be intercorrelated at between approximately r = .10 and r = .50. The character measures tended not to be strongly or consistently correlated with acquiescence. However, to ensure that the positive manifold of intercorrelations among character measures was not attributable simply to individual differences in the tendency to respond at high versus low areas of the likert scale, we calculated partial intercorrelations with respect to acquiescence. These are presented in the upper diagonal of Table 2. It can be seen that the character measures continued to be correlated at between approximately r = .10 and r = .50. Thus, associations among the character measures do not appear to be an artifact of response biases.
Table 2.
Correlations among the character measures, before and after controlling for acquiescence.
| Grit | Need Cognition | Intel Self-Cncpt | Mastery | Educ. Attitude | Increm Mindset | Test Motivation | |
|---|---|---|---|---|---|---|---|
| Grit | 0.374 (0.038) | 0.285 (0.042) | 0.332 (0.037) | 0.274 (0.039) | 0.163 (0.044) | 0.138 (0.039) | |
| Need Cognition | 0.360 (0.038) | 0.475 (0.035) | 0.389 (0.034) | 0.319 (0.037) | 0.254 (0.038) | 0.198 (0.036) | |
| Intel Self-Cncpt | 0.268 (0.042) | 0.492 (0.034) | 0.311 (0.042) | 0.256 (0.043) | 0.195 (0.041) | 0.116 (0.041) | |
| Mastery | 0.321 (0.037) | 0.402 (0.033) | 0.329 (0.042) | 0.287 (0.038) | 0.176 (0.039) | 0.112 (0.038) | |
| Educ. Attitude | 0.276 (0.039) | 0.306 (0.038) | 0.240 (0.045) | 0.277 (0.039) | 0.191 (0.033) | 0.135 (0.038) | |
| Increm Mindset | 0.162 (0.044) | 0.251 (0.038) | 0.191 (0.041) | 0.175 (0.039) | 0.190 (0.033) | 0.117 (0.036) | |
| Test Motivation | 0.136 (0.039) | 0.202 (0.037) | 0.122 (0.040) | 0.116 (0.039) | 0.133 (0.038) | 0.119 (0.037) | |
| Acquiescence | -0.053 (0.037) | 0.163 (0.034) | 0.205 (0.048) | 0.135 (0.037) | -0.053 (0.043) | 0.009 (0.033) | 0.043 (0.037) |
Note: Zero-order correlations are below the diagonal. Partial correlations with respect to acquiescence are above the diagonal. Standard errors are presented in parentheses. Bolded values are significant at p<.05. All variables have been residualized for Age, Sex, and Age × Sex.
Associations among BFI Scores
Correlations among the five BFI scores, as well as their correlations with acquiescent responding, are reported in the lower diagonal of Table 3. BFI-Openness and BFI-Neuroticism had appreciable correlations with acquiescence, but as displayed in the upper diagonal of Table 3, partialling acquiescence did not appreciably alter the interrelations among the BFI scores. As has been previously reported in childhood samples (Soto & Tackett, 2015), BFI-Openness, BFI-Conscientiousness, BFI-Extraversion, and BFI-Agreeableness tended to have moderately positive relations with one another and moderately negative relations with BFI-Neuroticism. BFI-Agreeableness and BFI-Conscientiousness evinced the strongest association (r = .49). BFI-Openness and BFI-Conscientiousness, though positively correlated, were separable (r = .26).
Table 3.
Correlations among BFI scales, before and after controlling for acquiescence.
| BFI-Openness | BFI-Conscientiousness | BFI-Extraversion | BFI-Agreeableness | BFI-Neuroticism | |
|---|---|---|---|---|---|
| Openness | 0.252 (0.039) | 0.309 (0.038) | 0.293 (0.037) | -0.162 (0.035) | |
| Conscientiousness | 0.257 (0.038) | 0.118 (0.039) | 0.494 (0.031) | -0.352 (0.036) | |
| Extraversion | 0.292 (0.038) | 0.116 (0.039) | 0.114 (0.038) | -0.134 (0.038) | |
| Agreeableness | 0.298 (0.036) | 0.496 (0.031) | 0.112 (0.038) | -0.427 (0.032) | |
| Neuroticism | -0.105 (0.035) | -0.337 (0.036) | -0.136 (0.037) | -0.409 (0.032) | |
| Acquiescence | 0.272 (0.043) | 0.053 (0.040) | -0.022 (0.037) | 0.059 (0.040) | 0.179 (0.033) |
Note: Zero-order correlations are below the diagonal. Partial correlations with respect to acquiescence are above the diagonal. Standard errors are presented in parentheses. Bolded values are significant at p<.05. All variables have been residualized for Age, Sex, and Age × Sex.
Associations between BFI Scores and Character Measures
The top portion of Table 4 reports correlations between the BFI scores and the individual character measures. It can be seen that small-to-moderate associations were found between nearly every character trait and each of the BFI scores. Associations were positive for BFI-Openness, BFI-Conscientiousness, BFI-Extraversion, and BFI-Agreeableness, and negative for BFI-Neuroticism. Some of the strongest associations were evident for BFI-Openness and BFI-Conscientiousness.
Table 4.
Associations between character measures and BFI scores.
| Predictors | ||||||
|---|---|---|---|---|---|---|
|
|
||||||
| Outcome | BFI-Openness | BFI-Conscientiousness | BFI-Extraversion | BFI-Agreeableness | BFI-Neuroticism | BFI-Acquiescence |
| Correlations | ||||||
| Grit | 0.156 (0.043) | 0.556 (0.032) | 0.104 (0.043) | 0.358 (0.039) | -0.327 (0.040) | -0.053 (0.037) |
| Need Cognition | 0.441 (0.033) | 0.396 (0.034) | 0.162 (0.038) | 0.328 (0.036) | -0.190 (0.039) | 0.163 (0.034) |
| Intel Self-Cncpt | 0.611 (0.030) | 0.360 (0.038) | 0.316 (0.036) | 0.299 (0.040) | -0.187 (0.040) | 0.205 (0.048) |
| Mastery | 0.274 (0.042) | 0.404 (0.034) | 0.107 (0.036) | 0.307 (0.032) | -0.115 (0.036) | 0.135 (0.037) |
| Educ. Attitude | 0.218 (0.039) | 0.207 (0.036) | 0.077 (0.036) | 0.212 (0.039) | -0.113 (0.038) | -0.053 (0.043) |
| Increm Mindset | 0.102 (0.040) | 0.191 (0.040) | 0.065 (0.043) | 0.154 (0.040) | -0.112 (0.040) | 0.009 (0.033) |
| Test Motivation | 0.114 (0.034) | 0.124 (0.032) | 0.089 (0.036) | 0.151 (0.036) | -0.048 (0.037) | 0.043 (0.037) |
| Standardized Multiple Regression Coefficients | ||||||
| Grit | 0.007 (0.038) | 0.478 (0.039) | 0.021 (0.037) | 0.068 (0.045) | -0.126 (0.039) | -0.048 (0.043) |
| Need Cognition | 0.322 (0.040) | 0.251 (0.037) | 0.025 (0.034) | 0.081 (0.040) | -0.047 (0.038) | 0.066 (0.035) |
| Intel Self-Cncpt | 0.487 (0.033) | 0.185 (0.035) | 0.144 (0.033) | 0.015 (0.039) | -0.063 (0.038) | 0.084 (0.045) |
| Mastery | 0.136 (0.045) | 0.319 (0.040) | 0.025 (0.035) | 0.121 (0.040) | 0.048 (0.037) | 0.064 (0.042) |
| Educ. Attitude | 0.191 (0.040) | 0.114 (0.043) | -0.006 (0.034) | 0.111 (0.044) | 0.011 (0.038) | -0.120 (0.045) |
| Increm Mindset | 0.040 (0.047) | 0.138 (0.049) | 0.026 (0.045) | 0.057 (0.047) | -0.034 (0.048) | -0.006 (0.033) |
| Test Motivation | 0.046 (0.041) | 0.058 (0.041) | 0.060 (0.039) | 0.111 (0.046) | 0.027 (0.045) | 0.017 (0.041) |
Note. Standard errors are presented in parentheses. Bolded values are significant at p<.05. All variables have been residualized for Age, Sex, and Age × Sex.
The bottom portion of Table 4 reports standardized multiple regression coefficients from regression models in which each of the character measures was simultaneously regressed on all five BFI scores and on acquiescence. These associations represent incremental relations of each of the BFI scores on each character measure, above and beyond the other BFI scores and acquiescence. Many of the associations are strongly attenuated relative to their values in the top portion of Table 4. This is predominately the case for BFI-Extraversion, BFI-Agreeableness, and BFI-Neuroticism. Associations with BFI-Conscientiousness and BFI-Openness remain in the moderate range in many cases.
Associations of Character Measures and BFI Scores with Fluid Intelligence, Knowledge, and Achievement
Table 5 presents correlations between the character and Big Five personality measures and the performance based measures. In general, there was a tendency for smaller associations with fluid intelligence and larger associations with knowledge and achievement. Associations between character and fluid intelligence ranged between nearly zero up to .3 for test motivation, with only four significant correlations. On the other hand, the character measures displayed significant correlations with the achievement and knowledge outcomes in 89% of the pairs. The strongest correlates of achievement and knowledge were Need for Cognition (r's between .25 and .40), Intellectual Self-Concept (r's between .20 and .35), Educational Attitude (r's between .20 and .35), and Test Motivation (r's between .30 and .50). BFI-Openness was the only BFI measure to significantly correlate with fluid intelligence (r = .21), but its correlations with knowledge and achievement tended to be stronger (r's between .15 and .35). The remaining Big Five scores had modest associations with knowledge and achievement.
Table 5.
Correlations of character, BFI scores, and acquiescence with fluid intelligence, knowledge, and achievement.
| Fluid Intelligence Factor | Math | Reading | Vocabulary | Similarities | Knowledge/Achievement Factor | |
|---|---|---|---|---|---|---|
| Character Measures | ||||||
| Grit | 0.034 (0.047) | 0.184 (0.039) | 0.123 (0.037) | 0.084 (0.039) | 0.097 (0.036) | 0.155 (0.045) |
| Need Cognition | 0.211 (0.043) | 0.325 (0.039) | 0.277 (0.037) | 0.260 (0.039) | 0.272 (0.036) | 0.374 (0.040) |
| Intel Self-Cncpt | 0.162 (0.047) | 0.221 (0.039) | 0.260 (0.037) | 0.240 (0.039) | 0.248 (0.039) | 0.329 (0.042) |
| Mastery | -0.038 (0.041) | 0.099 (0.040) | 0.049 (0.039) | 0.004 (0.036) | 0.085 (0.039) | 0.068 (0.043) |
| Educ. Attitude | 0.182 (0.044) | 0.231 (0.036) | 0.289 (0.036) | 0.250 (0.039) | 0.246 (0.036) | 0.344 (0.039) |
| Increm Mindset | 0.057 (0.042) | 0.118 (0.036) | 0.139 (0.034) | 0.161 (0.033) | 0.109 (0.035) | 0.183 (0.035) |
| Test Motivation | 0.301 (0.041) | 0.332 (0.035) | 0.370 (0.033) | 0.367 (0.033) | 0.336 (0.035) | 0.479 (0.035) |
| BFI Measures | ||||||
| BFI-Openness | 0.210 (0.042) | 0.147 (0.041) | 0.291 (0.036) | 0.280 (0.035) | 0.248 (0.038) | 0.343 (0.039) |
| BFI-Conscientiousness | 0.073 (0.042) | 0.174 (0.038) | 0.075 (0.037) | 0.034 (0.035) | 0.058 (0.035) | 0.094 (0.040) |
| BFI-Extraversion | 0.010 (0.045) | 0.050 (0.037) | 0.077 (0.037) | 0.168 (0.034) | 0.153 (0.036) | 0.166 (0.040) |
| BFI-Agreeableness | 0.078 (0.044) | 0.135 (0.038) | 0.113 (0.040) | 0.117 (0.035) | 0.089 (0.038) | 0.148 (0.042) |
| BFI-Neuroticism | -0.036 (0.039) | -0.091 (0.037) | -0.026 (0.038) | -0.071 (0.036) | -0.048 (0.038) | -0.077 (0.039) |
| Acquiescence | 0.020 (0.039) | 0.076 (0.041) | 0.056 (0.044) | -0.007 (0.037) | 0.018 (0.037) | 0.034 (.046) |
Note. Standard errors are presented in parentheses. Bolded values are significant at p<.05. All variables have been residualized for Age, Sex, and Age × Sex. Loadings (and SE's) of Spatial Relations, Block Design, and Matrix Reasoning on fluid intelligence were .650 (.031), .745 (.028), and .672 (.031), respectively. Loadings (and SE's) of Vocabulary, Similarities, Reading, and Math on the Knowledge/Achievement Factor were .788 (.025), .727 (.025), .752 (.023), and .647 (.031), respectively.
Phenotypic Factor Analyses and Associations with the Big Five Personality Factors
Next we were interested in whether a single common factor could capture the interrelations among the seven focal character measures: effortful persistence (grit), intellectual interest (need for cognition), intellectual self-concept, mastery achievement goal orientation, attitudes toward education, intellectual mindset, and test motivation. Such a model (Model 1) had excellent fit to the data (RMSEA = .012, CFI = .997, TLI = .995), and a χ2 test indicated that the model-implied covariance matrix fit the observed sample covariance matrix no worse than a fully saturated model (χ2 [14] = 15.735, p = .330). This is strong evidence that a multifactor solution was unnecessary to capture the covariance pattern in the data. Indeed the two-factor solution from an exploratory factor analysis fit no better than the one-factor model (χ2 [6] = 9.476, p = .1485). Eigenvalues from the exploratory factor analysis were 2.534, .941, .866, 805, .711, .660, and .483. Standardized factor loadings from the single common factor model are reported in the top portion of Table 6. It can be seen that all seven factor loadings were statistically significant and moderate in magnitude, ranging from .26 (test motivation) to .75 (need for cognition). The loading for Need for Cognition was the highest loading by a large margin, indicating that the common Character Factor is closely related to intellectual curiosity. When controlling for acquiescence (Model 2), standardized factor loadings remained virtually unchanged relative to the model without covarying acquiescence.
Table 6.
Common factor structural equation models of interrelations among character measures and relations with acquiescence and BFI scores.
| Variable | BFI-Acquiescence | BFI-Openness | BFI-Conscientious ness | BFI-Extraversion | BFI-Agreeableness | BFI-Neuroticism | Common Factor 1 | Common Factor 2 |
|---|---|---|---|---|---|---|---|---|
| Model 1: Common Factor of Character Measures, No covariates | ||||||||
| Grit | 0.505 (0.040) | |||||||
| Need Cognition | 0.745 (0.030) | |||||||
| Intel Self-Cncpt | 0.607 (0.039) | |||||||
| Mastery | 0.554 (0.034) | |||||||
| Educ. Attitude | 0.450 (0.041) | |||||||
| Increm Mindset | 0.340 (0.043) | |||||||
| Test Motivation | 0.257 (0.041) | |||||||
| Model 2: Common Factor of Character Measures, Covary Acquiescence | ||||||||
| Grit | -0.053 (0.037) | 0.522 (0.039) | ||||||
| Need Cognition | 0.162 (0.034) | 0.725 (0.031) | ||||||
| Intel Self-Cncpt | 0.205 (0.047) | 0.585 (0.040) | ||||||
| Mastery | 0.135 (0.039) | 0.542 (0.034) | ||||||
| Educ. Attitude | -0.053 (0.044) | 0.468 (0.039) | ||||||
| Increm Mindset | 0.009 (0.033) | 0.344 (0.043) | ||||||
| Test Motivation | 0.044 (0.036) | 0.252 (0.041) | ||||||
| Model 3: Common Factor of Character Measures, Direct Effects of Big Five on Individual Measures | ||||||||
| Grit | -0.049 (0.042) | 0.005 (0.039) | 0.476 (0.039) | 0.020 (0.037) | 0.069 (0.046) | -0.125 (0.040) | 0.262 (0.057) | |
| Need Cognition | 0.066 (0.037) | 0.322 (0.040) | 0.251 (0.037) | 0.025 (0.034) | 0.081 (0.040) | -0.047 (0.038) | 0.482 (0.049) | |
| Intel Self-Cncpt | 0.083 (0.045) | 0.488 (0.033) | 0.185 (0.035) | 0.143 (0.033) | 0.016 (0.039) | -0.062 (0.038) | 0.257 (0.050) | |
| Mastery | 0.064 (0.043) | 0.136 (0.045) | 0.319 (0.039) | 0.024 (0.035) | 0.122 (0.040) | 0.048 (0.037) | 0.346 (0.049) | |
| Educ. Attitude | -0.119 (0.044) | 0.191 (0.040) | 0.113 (0.043) | -0.005 (0.034) | 0.112 (0.044) | 0.010 (0.038) | 0.397 (0.058) | |
| Increm Mindset | -0.006 (0.033) | 0.041 (0.047) | 0.139 (0.049) | 0.026 (0.045) | 0.056 (0.047) | -0.034 (0.048) | 0.293 (0.050) | |
| Test Motivation | 0.019 (0.040) | 0.046 (0.041) | 0.058 (0.041) | 0.059 (0.039) | 0.112 (0.046) | 0.027 (0.045) | 0.203 (0.047) | |
| Model 4: Big Five Effects via Common Character Factor | ||||||||
| Grit | -0.123 (0.043) | 0.567 (0.567) | ||||||
| Need Cognition | 0.072 (0.036) | 0.677 (0.677) | ||||||
| Intel Self-Cncpt | 0.122 (0.043) | 0.665 (0.665) | ||||||
| Mastery | 0.065 (0.044) | 0.539 (0.539) | ||||||
| Educ. Attitude | -0.110 (0.043) | 0.430 (0.430) | ||||||
| Increm Mindset | -0.031 (0.032) | 0.305 (0.305) | ||||||
| Test Motivation | 0.013 (0.035) | 0.230 (0.230) | ||||||
| Character Factor | 0.423 (0.047) | 0.437 (0.040) | 0.084 (0.035) | 0.134 (0.040) | -0.062 (0.036) | |||
| Model 5: Big Five Effects via Common Character Factor + Direct Effects (data driven model) | ||||||||
| Grit | -0.052 (0.042) | -0.139 (0.053) | 0.356 (0.050) | -0.122 (0.038) | 0.363 (0.072) | |||
| Need Cognition | 0.058 (0.035) | 0.734 (0.028) | ||||||
| Intel Self-Cncpt | 0.066 (0.045) | 0.321 (0.047) | 0.140 (0.032) | 0.415 (0.049) | ||||
| Mastery | 0.064 (0.043) | 0.165 (0.044) | 0.438 (0.046) | |||||
| Educ. Attitude | -0.119 (0.042) | 0.467 (0.038) | ||||||
| Increm Mindset | -0.017 (0.033) | -0.122 (0.051) | 0.413 (0.055) | |||||
| Test Motivation | 0.008 (0.035) | 0.250 (0.041) | ||||||
| Character Factor | 0.417 (0.048) | 0.349 (0.042) | 0.163 (0.042) | |||||
| Model 6: Common Factor of Character Measures, BFI-Openness, and BFI-Conscientiousness | ||||||||
| BFI-Openness | 0.272 (0.039) | 0.533 (0.042) | ||||||
| Grit | -0.047 (0.038) | 0.559 (0.041) | ||||||
| Need Cognition | 0.162 (0.034) | 0.695 (0.027) | ||||||
| Intel Self-Cncpt | 0.211 (0.046) | 0.645 (0.038) | ||||||
| Mastery | 0.136 (0.04) | 0.548 (0.033) | ||||||
| Educ. Attitude | -0.053 (0.043) | 0.443 (0.036) | ||||||
| Increm Mindset | 0.009 (0.033) | 0.316 (0.042) | ||||||
| Test Motivation | 0.044 (0.036) | 0.232 (0.038) | ||||||
| BFI-Conscientiousness | 0.053 (0.039) | 0.605 (0.037) | ||||||
| Model 7: Two Factor Exploratory Factor Analysis of Character Measures, BFI-Openness, and BFI-Conscientiousness | ||||||||
| BFI-Openness | 0.272 (0.039) | -0.012 (0.014) | 0.734 (0.042) | |||||
| Grit | -0.039 (0.038) | 0.784 (0.053) | -0.116 (0.061) | |||||
| Need Cognition | 0.162 (0.034) | 0.393 (0.068) | 0.385 (0.074) | |||||
| Intel Self-Cncpt | 0.210 (0.046) | 0.158 (0.072) | 0.674 (0.063) | |||||
| Mastery | 0.134 (0.040) | 0.468 (0.056) | 0.143 (0.071) | |||||
| Educ. Attitude | -0.054 (0.043) | 0.290 (0.065) | 0.206 (0.073) | |||||
| Increm Mindset | 0.009 (0.033) | 0.244 (0.075) | 0.096 (0.082) | |||||
| Test Motivation | 0.044 (0.036) | 0.167 (0.054) | 0.086 (0.058) | |||||
| BFI-Conscientiousness | 0.053 (.039) | 0.722 (0.039) | 0.006 (0.007) | |||||
| Common Factor 1 | 0.444 (0.067)† | |||||||
Note. Standard errors are presented in parentheses. Bolded values are significant at p<05. All variables have been residualized for Age, Sex, and Age × Sex. Geomin (oblique) rotation was specified for the exploratory factor analysis (Model 7). Results were similar when Promax (oblique) rotation was specified.
parameter represents Factor 1-Factor 2 correlation.
Next we were interested in fitting the common factor model while covarying the BFI in addition to acquiescence (Model 3). After accounting for their relations with the Big Five, the interrelations among the character measures were attenuated, such that their standardized loadings on the common factor dropped in magnitude by approximately 32% on average, ranging from approximately .20 to .48. Need for Cognition continued to have the highest loading on the common factor, by a large margin.
Next (Model 4) we examined whether we could specify relations with BFI scores to occur exclusively via the common character factor, rather than directly on the individual character measures. While parameter estimates from this model indicated sizable relations between the general character factor and both Openness and Conscientiousness, fit for this model was dramatically worse (Table 7) than for any of the previous models. This result indicates that it is not plausible for associations between the BFI factors and the individual character measures to be mediated entirely through the common character factor. Thus, we fit a data driven model (Model 5) in which, in addition to specifying relations with BFI scores to occur via the common factor, we allowed for direct paths from the BFI scores to the individual character measures and retained only those that were statistically significant (cf. Tucker-Drob, 2013). This model, which fit the data very well, continued to indicate sizable relations between the general character factor and both Openness and Conscientiousness, while additionally allowing for a handful of more direct associations between individual BFI scores and individual character measures (e.g., between Openness and Intellectual Self-Concept).
Table 7.
Model fit statistics for common factor structural equation models of interrelations among character measures and relations with acquiescence and BFI scores.
| Chi Square | df | scaling factor | p-value | AIC | BIC | RMSEA | CFI | TLI | |
|---|---|---|---|---|---|---|---|---|---|
| Model 1 | 15.735 | 14 | 1.188 | 0.330 | 10658.661 | 10757.169 | 0.012 | 0.997 | 0.995 |
| Model 2 | 13.063 | 14 | 1.180 | 0.522 | 10569.766 | 10700.865 | 0.000 | 1.000 | 1.003 |
| Model 3 | 11.875 | 14 | 1.143 | 0.616 | 9915.985 | 10210.958 | 0.000 | 1.000 | 1.008 |
| Model 4 | 224.553 | 44 | 1.169 | <0.0005 | 10104.892 | 10259.402 | 0.072 | 0.841 | 0.772 |
| Model 5 | 35.112 | 39 | 1.163 | <0.0005 | 9893.248 | 10071.168 | 0.000 | 1.000 | 1.006 |
| Model 6 | 199.330 | 27 | 1.2103 | <0.0005 | 12674.416 | 12842.972 | 0.089 | 0.853 | 0.755 |
| Model 7 | 49.014 | 19 | 1.241 | <0.0005 | 12504.270 | 12710.282 | 0.044 | 0.974 | 0.939 |
Note: Scaling factors must be implemented to obtain accurate p-values when conducting chi-square difference tests. Because they are not based on all of the same variables, the fit indices for models 1 and 2 cannot be directly compared to one another or to models 3 through 7. Similarly, the fit indices for models 3, 4, and 5 cannot be directly compared to those for models 6 and 7.
The results of Model 5 indicate sizable relations between the general character factor and BFI-Conscientiousness and BFI-Openness. Similarly, the associations presented in Table 4 indicate that sizable relations between many of the individual character measures and both BFI-Conscientiousness and BFI-Openness, and the results of Model 3 indicate that shared variation among the character measures is attenuated after controlling for BFI-Conscientiousness and BFI-Openness. Thus, it is possible that shared variance among the seven character measures stems from the fact that many of the measures are hybrids that tap a mixture of latent Conscientiousness and Openness factors. Two predictions arise from this hypothesis. First, we would expect that when BFI-Conscientiousness and BFI-Openness are specified to load on the common character factor (Model 6), loadings should be moderate, but- because these two BFI scales are not themselves hybrid measures, model fit should be poor. This is indeed the case. BFI-Conscientiousness and BFI-Openness load on the common character factor at .61 and .53, respectively, but the fit of this model is poor (RMSEA = .089, CFI = .853, TLI = .755).3 Second, we would expect that when BFI-Conscientiousness and BFI-Openness are included, along with the seven character measures, in an exploratory factor analysis, two factors (representing Conscientiousness and Openness) should emerge, with the character measures, but not the BFI measures, having nontrivial dual loadings on each of the two factors. The Eigen values from such an exploratory factor analysis were 3.244, 1.107, .992, .882, .801, .674, .512, .410, and .378. The two factor solution (Model 7) has good fit to the data (RMSEA = .044, CFI = .974, TLI = .939), and fit significantly better than the one factor solution (χ2[8] = 155.719, p<0005)4 All indicators, except for BFI-Openness load on the first factor, for which BFI-Conscientiousness and Grit have the largest loadings (>.70). The variables with the largest loadings (>.6) on the second factor are BFI-Openness and Intellectual Self-Concept, and several other variables (but not BFI-Conscientiousness) also have nontrivial loadings on this factor. The two factors are correlated at r = .44. Based on these observations, it is sensible to label the first latent factor as Conscientiousness and the second latent factor as Openness. Interestingly, although Need for Cognition was the character measure with the highest loading on the single common character factor (in models 1-5), it is the variable with the most even pattern of dual loadings (both loadings = .39) on the latent Conscientiousness and Openness factors. In summary, these results indicate that a single common statistical dimension underlies the pattern of covariation between the seven character measures, and that this dimension represents a mixture of both Conscientiousness and Openness. Including purer measures of Conscientiousness and Openness from the BFI in an exploratory factor analysis along with the character measures enables the multivariate system to be separated into its (moderately correlated) Big Five personality components: Openness and Conscientiousness.
Associations between the Character Factors and Academic Achievement and Verbal Knowledge
We next explored relations between the character factors and both academic achievement and verbal knowledge. To ensure that relations with both fluid intelligence and achievement were not driven by examiner ratings of motivation during the in-lab assessment (which could be colored by actual test performance), we excluded motivation from this set of analyses. We examined relations involving the general character factor extracted from the remaining six character measures using Confirmatory Structural Equation Modeling. We also examined relations involving the latent Openness and Conscientiousness factors extracted from the same six character measures, along with BFI-Openness and BFI-Conscientiousness, using Exploratory Structural Equation Modeling (Asparouhov & Muthén, 2009). Fluid intelligence (Gf) was modeled as a latent variable, with Spatial Relations, Block Design, and Matrix Reasoning as indicators. For verbal knowledge/academic achievement, we fit models to each variable individually, and we also fit a model in which all four knowledge/academic achievement measures loaded on a latent knowledge/academic achievement factor.
Results are presented in Table 8. The general character factor was moderately related to all measures of knowledge/academic achievement (all r's ∼ .35), and somewhat more strongly related to the latent knowledge/academic achievement factor (r = .47). In the two-factor model of character, the Openness factor was moderately related to all measures of academic achievement (r's ranged from .26 to .35) and more strongly related to the latent knowledge/academic achievement factor (r = .48), but the Conscientiousness factor was only modestly related to achievement variables (r's ranged from .11 to .28) and the latent knowledge/academic achievement factor (r = .16), The fluid intelligence factor was strongly related to the measures of knowledge/academic achievement (all r's ∼ .50) and even more strongly related to the latent knowledge/academic achievement factor (r = .71; cf. Deary, Strand, Smith, & Fernandes; 2007). The general character factor was significantly, but only modestly, related to fluid intelligence (r = .22). In the two-factor model of character, the Openness and Conscientiousness factors were also rather modestly related to fluid intelligence (r's = .272 and .078, respectively). Partialling fluid intelligence did not appreciably attenuate correlations between the character factors and knowledge/academic achievement. In sum, results of these analyses indicated that the character factor is moderately related to academic achievement, even after controlling for fluid intelligence and the Big Five.
Table 8. Phenotypic Associations Between the Character Factor, Fluid Intelligence, and Academic Achievement.
| Correlations | Partial Fluid Intelligence | ||||||
|---|---|---|---|---|---|---|---|
| Knowledge/Achievement Criterion | Fluid Intelligence Factor | General Character Factor | Openness Factor | Conscientiousne ss Factor | General Character Factor | Openness Factor | Conscientiousness Factor |
| Math | 0.525 (0.039) | 0.386 (0.045) | 0.260 (0.058) | 0.281 (0.058) | 0.328 (0.049) | 0.132 (0.063) | 0.290 (0.055) |
| Reading | 0.468 (0.039) | 0.358 (0.041) | 0.389 (0.047) | 0.160 (0.060) | 0.290 (0.044) | 0.298 (0.050) | 0.140 (0.058) |
| Vocabulary | 0.554 (0.038) | 0.318 (0.046) | 0.375 (0.045) | 0.108 (0.058) | 0.241 (0.050) | 0.283 (0.047) | 0.080 (0.059) |
| Similarities | 0.573 (0.037) | 0.342 (0.041) | 0.352 (0.048) | 0.147 (0.055) | 0.281 (0.045) | 0.264 (0.051) | 0.125 (0.053) |
| Knowledge/Achievement Factor | 0.709 (0.041) | 0.467 (0.044) | 0.477 (0.046) | 0.159 (0.057) | 0.452 (0.053) | 0.427 (.062) | 0.219 (0.081) |
Note: The Openness and Conscientiousness factors were estimated using Exploratory Structural Equation Modeling with Geomin (oblique) rotation. To maintain conservative estimates of correlations with achievement, test motivation was excluded from analyses. The correlation between Gf and the General Character Factor is .220 (SE=.052). The correlations between Gf and the Openness and Conscientiousness factors are .272 (SE = .051) and .078 (SE = .056) respectively. The Openness and Conscientiousness Factors correlate at .416 (SE=.059). Bolded parameters are statistically significant at p<.05. Standard errors are presented in parentheses. Bolded values are significant at p<.05. All variables have been residualized for Age, Sex, and Age × Sex. Loadings (and SE's) of Spatial Relations, Block Design, and Matrix Reasoning on fluid intelligence were .650 (.031), .745 (.028), and .672 (.031), respectively. Loadings (and SE's) of Vocabulary, Similarities, Reading, and Math on the Knowledge/Achievement Factor were .788 (.025), .727 (.025), .752 (.023), and .647 (.031), respectively.
We tested whether the general character factor fully mediated the associations between the individual character variables and achievement/knowledge. To test mediation, we fit the same models used to generate the estimates reported in Table 8, but allowed for correlated residuals between each individual character variable (with the exception of Need for Cognition) and each achievement/knowledge criterion.5 Very few of these correlated residuals were statistically significant, and they were generally small in magnitude. The character variables that had the most consistent residual correlations with achievement/knowledge outcomes were Attitudes toward Education (the residual correlations were ∼ .10 to .20) and Mastery Orientation (the residual correlations were ∼ -.07 to -.25). This indicates that Attitudes toward Education are related to achievement/knowledge outcomes above and beyond mediation by the common character factor and that Mastery Orientation is less related to achievement/knowledge than would be expected on the basis of its relation to the common character factor. Importantly, in these analyses, the correlations between the common character factor and the achievement/knowledge criterion variables were extremely similar in magnitude to those reported in Table 8. For instance, in the model with correlated residuals, the correlation between the common character factor and the Knowledge/Achievement Factor was .48 (compared to .47 in the model without correlated residuals). Overall, then, it is the variation in each character measure that is shared with the other character measures, rather than its unique variance, that drives its relation with achievement/knowledge.
Behavioral Genetic Results
We were next interested in estimating the magnitudes of genetic and environmental influences on both the common and unique variation in the seven character variables. Our behavioral genetic models were fit as multigroup models that identified latent genetic and environmental variance components using differences in the patterns of intraclass correlations between MZ twins (who share nearly 100% of their genes) and DZ twins (who share approximately 50% of their segregating genes, on average). When the intraclass correlation on a phenotype (e.g., a character measure) is larger in MZ twins than it is in DZ twins, genetic variation is inferred to influence variation in the phenotype. When the intraclass correlation for twins raised together (regardless of zygosity) is larger than can be explained by the estimate of genetic influence alone, shared environmental variation is inferred. Nonshared environmental variation is inferred when MZ twins reared together (who are perfectly matched on both genes and objectively shared environments) are not perfectly similar to one another on the phenotype. The multivariate behavioral genetic models rely on this same logic, but also capitalize on differences in the magnitude of cross-twin, cross-variable correlations between zygosities (e.g., the correlation between phenotype A in Twin 1 and phenotype B in Twin 2). For instance, when the cross-twin, cross-variable correlation is larger in MZ twins than in DZ twins, one infers that the same genes influence both phenotypes.
Before formally fitting behavioral genetic models, we examined the pattern of correlations in monozygotic twins, same-sex dizygotic twins, and opposite-sex dizygotic twins. This step is essential because DZ twins, but not MZ twins, can differ in sex. Because all variables were already residualized for age, sex, and age × sex, mean sex differences are prevented from distorting behavioral genetic parameter estimates. However, if the genes relevant to the phenotypes of interest differ by sex, the observed similarity of opposite-sex DZ twins on those phenotypes will be diminished, potentially leading to an overestimation of genetic effects. This potential concern can be detected if opposite-sex DZ twins systematically display lower intraclass correlations on the phenotypes of interest compared to same-sex DZ twins. Table 9 reports intraclass correlations for the character and BFI variables broken down by MZ, same-sex DZ, and opposite-sex DZ twins. The pattern of DZ correlations are similar across same-sex and opposite-sex DZ pairs: Opposite-sex pairs do not have lower average intraclass correlations on either the character measures or the BFI measures compared to same-sex DZ pairs. Therefore, we combine these observations in further analyses. Additionally, MZ twins display stronger intraclass correlations for all character and BFI measures, indicating genetic effects. Finally, there does not appear to be any familial resemblance (either genetic or shared environmental) on acquiescent responding: Intraclass correlations for acquiescence are all very close to zero for all zygosity types.
Table 9.
Intraclass correlations for each of the character measures and the BFI scores by zygosity.
| Outcome | Monozygotic Twins | Same-Sex Dizygotic Twins | Opposite-Sex Dizygotic Twins |
|---|---|---|---|
| Character Measures | |||
| Grit | 0.565 (0.066) | 0.022 (0.094) | 0.071 (0.103) |
| Need Cognition | 0.477 (0.059) | 0.262 (0.077) | 0.092 (0.084) |
| Intel Self-Cncpt | 0.396 (0.087) | 0.084 (0.132) | 0.218 (0.105) |
| Mastery | 0.302 (0.097) | 0.249 (0.089) | 0.146 (0.110) |
| Educ. Attitude | 0.342 (0.088) | 0.140 (0.095) | 0.186 (0.098) |
| Increm Mindset | 0.299 (0.093) | 0.073 (0.096) | 0.061 (0.087) |
| Test Motivation | 0.299 (0.077) | 0.122 (0.092) | 0.204 (0.082) |
| Average Correlation (Character Measures) | 0.383 | 0.136 | 0.140 |
| BFI Measures | |||
| BFI-Openness | 0.397 (0.083) | 0.144 (0.091) | 0.248 (0.089) |
| BFI-Conscientiousness | 0.301 (0.080) | 0.025 (0.093) | 0.113 (0.096) |
| BFI-Extraversion | 0.316 (0.093) | -0.033 (0.092) | 0.094 (0.082) |
| BFI-Agreeableness | 0.356 (0.070) | 0.130 (0.077) | 0.179 (0.085) |
| BFI-Neuroticism | 0.238 (0.085) | 0.078 (0.081) | 0.214 (0.099) |
| Average Correlation (Big Five Scales) | 0.322 | 0.069 | 0.170 |
| BFI-Acquiescence | 0.055 (0.119) | 0.146 (0.116) | -0.052 (0.094) |
Note. Standard errors are presented in parentheses. Bolded correlations are significant at p<.05. All variables have been residualized for Age, Sex, and Age × Sex.
Behavioral Genetic Factor Models of Character
We fit Common Pathway models to decompose variation into genetic and environmental variation occurring on the common character factor and genetic and environmental variation occurring on the variable-specific unique factors. We fit these behavioral genetic models both to a common factor of the seven character measures and to the two factor (Openness and Conscientiousness) exploratory factor analysis solution that emerged when BFI-Openness and BFI-Conscientiousness variables were included along with the seven character measures. This oblique exploratory factor model was specified in the context of a confirmatory Structural Equation Model using the method described by Jöreskog (1969), in which one anchor indicator per factor is specified to have a loading of 0 on the other factor (we chose BFI-Openness and BFI-Conscientiousness as the anchor indicators for the latent Openness and Conscientiousness factors respectively). For both the single factor model and the two factor model, we fit three versions of the Common Pathway model: an ACE model that allowed for Additive Genetic (A), Shared Environmental (C), and Nonshared Environmental (E) factors; an ADE model that allowed for Additive Genetic (A), Dominance (i.e., nonadditive) Genetic (D), and Nonshared Environmental (E) factors; and an AE model that only allowed for Additive Genetic (A) and Nonshared Environmental (E) factors. For the two factor model, we allowed the biometric components of the latent Openness and Conscientiousness factors to correlate with one another. All behavioral genetic models corrected standard errors for the nesting of pairs within triplet sets (using the TYPE = COMPLEX feature in Mplus).
Standardized parameter estimates for all three Common Pathway models of the general character factor are reported in Table 10, and corresponding model fit statistics are reported in the top portion of Table 11. All models fit acceptably well in terms of RMSEA, CFI, and TLI, with both AIC and BIC comparisons favoring the AE version, depicted as a path diagram in Figure 1. All models indicated that the character factor was ∼69% heritable (for AE and ACE models, the A path was .83, which when squared yields a heritability estimate of .69; for the ADE model, the sum of the squared A and D paths yields a heritability estimate of .68), with the remaining 31 to 32% of variance attributable to the nonshared environment. There was very little evidence for shared environmental variation in the character measures at either the level of the common factor or variable-specific unique factors. There was evidence for variable-specific genetic and nonshared environmental contributions. In the preferred AE model, variable-specific genetic contributions occurred for all variables except for Need for Cognition. In other words, genetic influences on Need for Cognition were entirely mediated by genetic influences on the common character factor, whereas genetic influences on the other six character measures were only partially mediated by the common character factor.
Table 10.
Standardized parameter estimates from behavioral genetic models of the general character factor (Single Factor Models).
| ACE Common Pathway Model | ||||
|---|---|---|---|---|
| Outcome | λ | A | C | E |
| Factor | 0.831 (0.047) | 0.000 (0.000) | 0.557 (0.070) | |
| Grit | 0.476 (0.042) | 0.482 (0.072) | 0.000 (0.000) | 0.735 (0.050) |
| Need Cognition | 0.750 (0.032) | 0.216 (0.127) | 0.000 (0.001) | 0.625 (0.044) |
| Intel Self-Cncpt | 0.577 (0.047) | 0.389 (0.096) | 0.000 (0.000) | 0.718 (0.056) |
| Mastery | 0.534 (0.038) | 0.191 (0.520) | 0.309 (0.204) | 0.764 (0.063) |
| Educ. Attitude | 0.447 (0.043) | 0.410 (0.080) | 0.000 (0.003) | 0.795 (0.041) |
| Increm Mindset | 0.331 (0.047) | 0.349 (0.116) | 0.000 (0.000) | 0.877 (0.046) |
| Test Motivation | 0.276 (0.043) | 0.434 (0.225) | 0.136 (0.516) | 0.847 (0.047) |
|
| ||||
| ADE Common Pathway Model | ||||
| Outcome | λ | A | D | E |
|
| ||||
| Factor | 0.804 (0.209) | 0.192 (0.932) | 0.562 (0.074) | |
| Grit | 0.474 (0.042) | 0.000 (0.000) | 0.566 (0.062) | 0.674 (0.053) |
| Need Cognition | 0.750 (0.033) | 0.008 (0.282) | 0.247 (0.132) | 0.614 (0.050) |
| Intel Self-Cncpt | 0.578 (0.047) | 0.175 (0.867) | 0.388 (0.441) | 0.696 (0.062) |
| Mastery | 0.533 (0.038) | 0.413 (0.082) | 0.000 (0.000) | 0.738 (0.050) |
| Educ. Attitude | 0.447 (0.043) | 0.375 (0.357) | 0.180 (0.837) | 0.792 (0.048) |
| Increm Mindset | 0.329 (0.047) | 0.000 (0.000) | 0.426 (0.113) | 0.842 (0.057) |
| Test Motivation | 0.275 (0.043) | 0.462 (0.072) | 0.008 (0.053) | 0.843 (0.039) |
|
| ||||
| AE Common Pathway Model | ||||
| Outcome | λ | A | E | |
|
| ||||
| Factor | 0.830 (0.047) | 0.558 (0.069) | ||
| Grit | 0.477 (0.042) | 0.483 (0.072) | 0.735 (0.050) | |
| Need Cognition | 0.750 (0.032) | 0.220 (0.124) | 0.624 (0.044) | |
| Intel Self-Cncpt | 0.577 (0.047) | 0.389 (0.096) | 0.718 (0.056) | |
| Mastery | 0.534 (0.038) | 0.411 (0.083) | 0.739 (0.050) | |
| Educ. Attitude | 0.447 (0.042) | 0.410 (0.080) | 0.795 (0.040) | |
| Increm Mindset | 0.331 (0.047) | 0.348 (0.116) | 0.877 (0.046) | |
| Test Motivation | 0.276 (0.043) | 0.462 (0.072) | 0.843 (0.039) | |
Note. Standard errors are presented in parentheses. Bolded values are significant at p<.05. All variables have been residualized for Age, Sex, and Age × Sex.
Table 11.
Fit Statistics for Multivariate Behavioral Genetic Models of Character.
| Chi Square | df | Scaling Factor | AIC | BIC | CFI | TLI | RMSEA | |
|---|---|---|---|---|---|---|---|---|
| Single Factor Models | ||||||||
| ACE Common Pathways | 257.593 | 200 | 1.10 | 11340.74 | 11495.26 | 0.92 | 0.93 | 0.04 |
| ADE Common Pathways | 253.773 | 200 | 1.09 | 11333.50 | 11488.01 | 0.93 | 0.93 | 0.04 |
| AE Common Pathways | 266.077 | 208 | 1.07 | 11325.38 | 11447.36 | 0.92 | 0.93 | 0.04 |
| AE Independent Pathways | 254.672 | 203 | 1.06 | 11320.56 | 11462.87 | 0.93 | 0.94 | 0.03 |
| Two Factor Models | ||||||||
| ACE Common Pathways | 452.615 | 317 | 1.10 | 13432.45 | 13680.48 | 0.91 | 0.91 | 0.05 |
| ADE Common Pathways | 446.281 | 317 | 1.10 | 13423.06 | 13671.10 | 0.91 | 0.91 | 0.04 |
| AE Common Pathways | 466.363 | 329 | 1.11 | 13409.50 | 13608.74 | 0.91 | 0.91 | 0.04 |
Note. Scaling factors must be implemented to obtain accurate p-values when conducting chi-square difference tests. The single factor models and the two factor models are based different sets of variables (the two factor models included BFI-Openness and BFI-Conscientiousness in addition to the seven character measures), so their fits cannot be directly compared.
Figure 1.
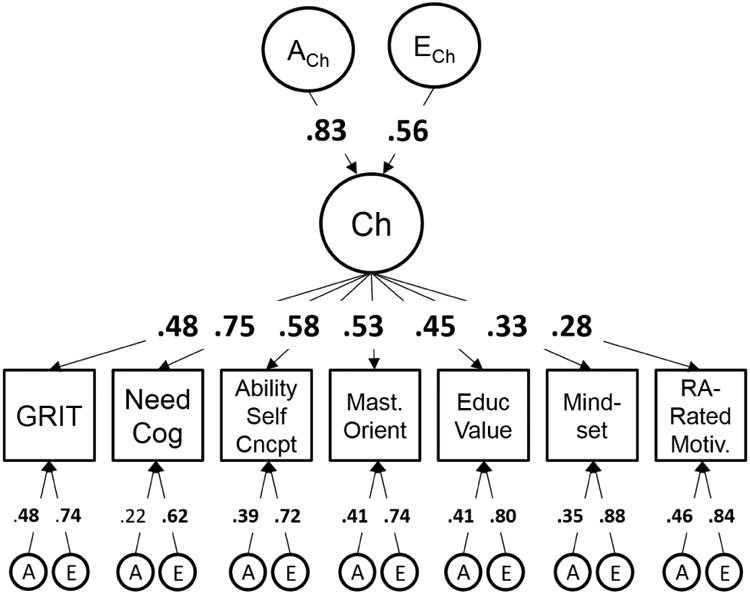
Biometric factor model of character (Ch). All paths are standardized. Bolded parameters are statistically significant at p<.05. All indicators were residualized for age, sex, and age × sex prior to model-fitting.
Standardized parameter estimates for all three Common Pathway models of the two factor (Openness and Conscientiousness) exploratory factor analysis of the seven character measures, BFI-Openness, and BFI-Conscientiousness, are reported in Table 12, and corresponding model fit statistics are reported in the bottom portion of Table 11. All models fit acceptably well in terms of RMSEA, CFI, and TLI, with both AIC and BIC comparisons favoring the AE version, depicted as a path diagram in Figure 2. In the preferred AE model, the latent Openness factor is 48% heritable, and the latent Conscientiousness factor is 57% heritable. The correlation between the A components for the latent Openness and Conscientiousness factors is .47, and the correlation between the E components of these factors is .33, indicating moderate genetic and environmental overlap between the two traits. There was very little evidence for shared environmental variation at either the level of the common factor or variable-specific unique factors. There was evidence for variable-specific genetic and nonshared environmental contributions.
Table 12.
Standardized parameter estimates from multivariate behavioral genetic models of latent Openness and Conscientiousness factors (Two Factor Models).
| ACE Common Pathway Model | |||||
|---|---|---|---|---|---|
| Outcome | λOpenness | λConscientiousness | A | C | E |
| Openness Factor | 0.693 (0.066) | 0.000 (0.001) | 0.721 (0.064) | ||
| Conscientiousness Factor | 0.757 (0.066) | 0.000 (0.000) | 0.654 (0.076) | ||
| BFI-Openness | 0.791 (0.044) | 0.291 (0.096) | 0.000 (0.000) | 0.539 (0.066) | |
| Grit | -0.151 (0.067) | 0.785 (0.055) | 0.264 (0.110) | 0.000 (0.000) | 0.621 (0.058) |
| Need Cognition | 0.385 (0.072) | 0.410 (0.060) | 0.358 (0.066) | 0.000 (0.000) | 0.655 (0.037) |
| Intel Self-Cncpt | 0.676 (0.050) | 0.195 (0.055) | 0.277 (0.093) | 0.000 (0.000) | 0.568 (0.048) |
| Mastery | 0.154 (0.075) | 0.466 (0.054) | 0.214 (0.457) | 0.334 (0.187) | 0.738 (0.064) |
| Educ. Attitude | 0.153 (0.079) | 0.309 (0.061) | 0.437 (0.079) | 0.000 (0.001) | 0.808 (0.041) |
| Increm Mindset | 0.058 (0.076) | 0.261 (0.069) | 0.406 (0.099) | 0.000 (0.000) | 0.867 (0.047) |
| Test Motivation | 0.082 (0.054) | 0.181 (0.052) | 0.458 (0.212) | 0.143 (0.488) | 0.848 (0.047) |
| BFI-Conscientiousness | 0.714 (0.041) | 0.077 (0.994) | 0.172 (0.311) | 0.674 (0.058) | |
| Biometric Correlations | 0.470 (0.135) | 0.997 (0.026) | 0.325 (0.153) | ||
|
| |||||
| ADE Common Pathway Model | |||||
| Outcome | λOpenness | λConscientiousness | A | D | E |
|
| |||||
| Openness Factor | 0.692 (0.141) | 0.080 (1.256) | 0.717 (0.067) | ||
| Conscientiousness Factor | 0.355 (0.230) | 0.720 (0.132) | 0.596 (0.076) | ||
| BFI-Openness | 0.793 (0.045) | 0.228 (0.395) | 0.180 (0.565) | 0.535 (0.075) | |
| Grit | -0.147 (0.066) | 0.781 (0.054) | 0.000 (0.000) | 0.349 (0.095) | 0.581 (0.06) |
| Need Cognition | 0.386 (0.071) | 0.409 (0.060) | 0.309 (0.274) | 0.200 (0.486) | 0.651 (0.044) |
| Intel Self-Cncpt | 0.674 (0.050) | 0.198 (0.055) | 0.000 (0.000) | 0.320 (0.085) | 0.548 (0.049) |
| Mastery | 0.153 (0.074) | 0.465 (0.053) | 0.447 (0.078) | 0.000 (0.000) | 0.710 (0.049) |
| Educ. Attitude | 0.155 (0.076) | 0.308 (0.060) | 0.353 (0.380) | 0.278 (0.550) | 0.801 (0.048) |
| Increm Mindset | 0.056 (0.076) | 0.260 (0.068) | 0.000 (0.000) | 0.476 (0.099) | 0.831 (0.056) |
| Test Motivation | 0.082 (0.054) | 0.181 (0.052) | 0.487 (0.069) | 0.001 (0.005) | 0.844 (0.039) |
| BFI-Conscientiousness | 0.715 (0.04) | 0.202 (0.123) | 0.000 (0.000) | 0.669 (0.051) | |
| Biometric Correlations | 1.000 (0.000) | 0.364 (7.121) | 0.398 (0.161) | ||
|
| |||||
| AE Common Pathway Model | |||||
| Outcome | λOpenness | λConscientiousness | A | E | |
|
| |||||
| Openness Factor | 0.693 (0.066) | 0.721 (0.064) | |||
| Conscientiousness Factor | 0.756 (0.065) | 0.655 (0.075) | |||
| BFI-Openness | 0.790 (0.044) | 0.292 (0.096) | 0.539 (0.066) | ||
| Grit | -0.152 (0.067) | 0.786 (0.055) | 0.265 (0.110) | 0.620 (0.058) | |
| Need Cognition | 0.385 (0.072) | 0.411 (0.061) | 0.358 (0.066) | 0.654 (0.037) | |
| Intel Self-Cncpt | 0.676 (0.050) | 0.194 (0.055) | 0.276 (0.093) | 0.569 (0.049) | |
| Mastery | 0.151 (0.075) | 0.468 (0.054) | 0.448 (0.077) | 0.707 (0.049) | |
| Educ. Attitude | 0.152 (0.078) | 0.309 (0.061) | 0.436 (0.079) | 0.808 (0.040) | |
| Increm Mindset | 0.058 (0.076) | 0.261 (0.069) | 0.406 (0.099) | 0.867 (0.046) | |
| Test Motivation | 0.082 (0.055) | 0.181 (0.053) | 0.486 (0.069) | 0.844 (0.039) | |
| BFI-Conscientiousness | 0.713 (0.04) | 0.212 (0.118) | 0.668 (0.053) | ||
| Biometric Correlations | 0.469 (0.134) | 0.329 (0.15) | |||
Note. Standard errors are presented in parentheses. Bolded values are significant at p<.05. All variables have been residualized for Age, Sex, and Age × Sex. Biometric Correlations refer to rA, rC, rD, and rE with respect to the biometric components of the latent Openness and Conscientiousness factors.
Figure 2.

Biometric factor model of latent Openness (O) and Conscientiousness (C) factors. All paths are standardized. Bolded parameters are statistically significant at p<.05. All indicators were residualized for age, sex, and age × sex prior to model-fitting.
Behavioral Genetic Models of Associations between Fluid Intelligence, the Character Factors, Academic Achievement and Verbal Knowledge
We were next interested in estimating the extent to which the associations between the character factors and knowledge/achievement were mediated by genetic and/or environmental factors. We performed two sets of analyses: one set with the general character factor, and a second set with the latent Openness and Conscientiousness factors. For the first set of analyses, we performed Cholesky decompositions in which the latent fluid intelligence factor was entered as the “upstream” variable, the general character factor was entered as the first “downstream” variable, and verbal knowledge/academic achievement was entered as the final “downstream” variable. These decompositions estimated paths to knowledge/academic achievement from genetic and environmental influences on the common character factor that are independent of fluid intelligence. This approach resembles a standard regression analysis in which the covariance of the predictors is controlled to estimate the unique effect of a predictor (i.e., the character factor). The models additionally estimated the magnitudes of genetic and environmental influences on knowledge/academic achievement unique of both the character factor and fluid intelligence. For the second set of analyses, we regressed verbal knowledge/academic achievement onto the biometric components of both latent Openness and latent Conscientiousness (which were themselves allowed to correlate), and we regressed verbal knowledge/academic achievement, latent Openness, and latent Conscientiousness onto the biometric components of fluid intelligence. The biometric components of latent Openness, and latent Conscientiousness were allowed to correlate with one another. Thus, in this second set of analyses, the paths to knowledge/academic achievement from genetic and environmental influences on latent Openness and latent Conscientiousness are independent of fluid intelligenc, and of one another. We fit models individually to each individual knowledge/academic achievement variable, in addition to a model in which knowledge/academic achievement was modeled as a latent factor. To ensure that relations between the character factors and both fluid intelligence and achievement were not driven by examiner ratings of motivation during the in-lab assessment (which could be colored by actual test performance), we excluded motivation from this set of analyses. As an extensive body of previous behavioral genetic research has established nontrivial shared environmental contributions to both intelligence and academic achievement in childhood and adolescence (Plomin, DeFries, Knopik, & Neiderheiser, 2013; Tucker-Drob, Briley, & Harden, 2013), we modeled fluid intelligence and academic achievement with ACE components. Because the earlier-reported analyses indicated no shared environmental influences on the character factors, we modeled the character factors with AE components and did not allow for cross-paths from C components of fluid intelligence to the character factors.
Parameter estimates from the first set of biometric decompositions (those involving the single general character factor) are reported in the top portion of Table 13. Genetic influences on fluid intelligence were modestly associated with the general character factor, and strongly associated with knowledge/academic achievement. Of key interest are the cross-paths from the genetic and environmental components of the character factor (unique of fluid intelligence) to knowledge/academic achievement. In can be seen that genetic cross-paths were appreciable in magnitude and statistically significant, and the environmental cross-paths were trivial in magnitude and nonsignificant. Fluid intelligence and character explained a large portion of variance in each index of knowledge and achievement, with the latent achievement/knowledge factor possessing no significant residual genetic or environmental variance (significant residual variance was, however, observed at the level of the individual indicators).
Table 13.
Standardized parameter estimates from biometric decomposition representing associations between latent character factor(s) and individual measures of knowledge/academic achievement, controlling for fluid intelligence.
| Parameter | Index of Knowledge/Achievement | ||||
|---|---|---|---|---|---|
| Math | Reading | Vocabulary | Similarities | Achievement/Knowledge Factor | |
| Models with a Single General Character Factor | |||||
| AGf ➔ Fluid Intelligence | 0.951 (0.096) | 0.931 (0.046) | 0.954 (0.051) | 0.951 (0.054) | 0.942 (0.041) |
| CGf ➔ Fluid Intelligence | 0.201 (0.396) | 0.279 (0.119) | 0.211 (0.182) | 0.208 (0.203) | 0.236 (0.133) |
| EGf ➔ Fluid Intelligence | 0.235 (0.107) | 0.236 (0.101) | 0.213 (0.111) | 0.229 (0.103) | 0.240 (0.073) |
| Acharacter ➔ Character Factor | 0.784 (0.048) | 0.768 (0.049) | 0.773 (0.049) | 0.773 (0.048) | 0.764 (0.049) |
| Echaracter ➔ Character Factor | 0.561 (0.079) | 0.580 (0.078) | 0.573 (0.082) | 0.576 (0.077) | 0.584 (0.073) |
| AAch/Know ➔ Ach/Know | 0.262 (0.246) | 0.152 (0.388) | 0.355 (0.174) | 0.405 (0.151) | 0.173 (0.329) |
| CAch/Know ➔ Ach/Know | 0.112 (4.205) | 0.000 (0.000) | 0.000 (0.000) | 0.001 (0.006) | 0.002 (0.007) |
| EAch/Know ➔Ach/Know | 0.529 (0.103) | 0.525 (0.116) | 0.560 (0.084) | 0.662 (0.072) | 0 (0.001) |
| AGf ➔ Character Factor | 0.200 (0.067) | 0.195 (0.068) | 0.209 (0.066) | 0.199 (0.066) | 0.195 (0.066) |
| EGf ➔ Character Factor | 0.176 (0.181) | 0.188 (0.182) | 0.178 (0.202) | 0.174 (0.184) | 0.194 (0.162) |
| AGf ➔ Ach/Know | 0.422 (0.103) | 0.317 (0.095) | 0.420 (0.100) | 0.360 (0.094) | 0.518 (0.089) |
| CGf ➔ Ach/Know | 0.518 (0.906) | 0.608 (0.080) | 0.383 (0.168) | 0.319 (0.172) | 0.592 (0.087) |
| EGf ➔ Ach/Know | 0.250 (0.171) | 0.325 (0.171) | 0.247 (0.141) | 0.226 (0.172) | 0.353 (0.053) |
| Acharacter ➔ Ach/Know | 0.359 (0.066) | 0.341 (0.065) | 0.377 (0.067) | 0.336 (0.073) | 0.461 (0.066) |
| Echaracter ➔ Ach/Know | -0.028 (0.123) | -0.092 (0.137) | -0.185 (0.131) | -0.053 (0.113) | -0.118 (0.093) |
| Models with Latent Openness and Conscientiousness Factors | |||||
| AGf ➔ Fluid Intelligence | 0.956 (0.059) | 0.934 (0.046) | 0.959 (0.051) | 0.958 (0.056) | 0.941 (0.041) |
| CGf ➔ Fluid Intelligence | 0.165 (0.285) | 0.261 (0.128) | 0.177 (0.224) | 0.163 (0.280) | 0.203 (0.158) |
| EGf ➔ Fluid Intelligence | 0.244 (0.098) | 0.245 (0.097) | 0.221 (0.107) | 0.236 (0.099) | 0.271 (0.066) |
| AO ➔ Openness Factor | 0.634 (0.068) | 0.640 (0.063) | 0.632 (0.066) | 0.644 (0.066) | 0.637 (0.056) |
| EO ➔ Openness Factor | 0.712 (0.069) | 0.710 (0.063) | 0.715 (0.066) | 0.707 (0.066) | 0.715 (0.054) |
| AC➔ Conscientiousness Factor | 0.740 (0.067) | 0.720 (0.073) | 0.717 (0.080) | 0.717 (0.076) | 0.723 (0.074) |
| EC➔ Conscientiousness Factor | 0.524 (0.177) | 0.507 (0.208) | 0.470 (0.289) | 0.512 (0.215) | 0.557 (0.102) |
| ra (Conscientiousness, Openness) | 0.508 (0.15) | 0.459 (0.156) | 0.528 (0.166) | 0.495 (0.155) | 0.498 (0.142) |
| re (Conscientiousness, Openness) | 0.204 (0.228) | 0.242 (0.228) | 0.196 (0.281) | 0.235 (0.233) | 0.238 (0.172) |
| AAch/Know ➔ Ach/Know | 0.055 (1.206) | 0.000 (0.001) | 0.273 (0.286) | 0.354 (0.188) | 0.000 (0.000) |
| CAch/Know ➔ Ach/Know | 0.153 (2.585) | 0.001 (0.002) | 0.001 (0.006) | 0.000 (0.003) | 0.013 (0.093) |
| EAch/Know ➔ Ach/Know | 0.515 (0.121) | 0.469 (0.240) | 0.479 (0.344) | 0.643 (0.115) | 0.000 (0.000) |
| AGf ➔ Openness Factor | 0.231 (0.066) | 0.237 (0.067) | 0.253 (0.066) | 0.239 (0.066) | 0.238 (0.065) |
| EGf ➔ Openness Factor | 0.193 (0.173) | 0.174 (0.170) | 0.162 (0.189) | 0.168 (0.175) | 0.161 (0.136) |
| AGf ➔ Conscientiousness Factor | -0.01 (0.077) | -0.036 (0.081) | -0.035 (0.083) | -0.032 (0.081) | -0.030 (0.081) |
| EGf ➔ Conscientiousness Factor | 0.421 (0.223) | 0.472 (0.231) | 0.513 (0.278) | 0.472 (0.245) | 0.408 (0.147) |
| AGf ➔ Ach/Know | 0.430 (0.102) | 0.344 (0.091) | 0.439 (0.103) | 0.391 (0.096) | 0.549 (0.092) |
| CGf ➔ Ach/Know | 0.545 (0.727) | 0.565 (0.055) | 0.318 (0.209) | 0.231 (0.24) | 0.517 (0.090) |
| EGf ➔ Ach/Know | 0.252 (0.160) | 0.314 (0.156) | 0.250 (0.136) | 0.211 (0.166) | 0.320 (0.059) |
| AO ➔ Ach/Know | 0.243 (0.138) | 0.465 (0.113) | 0.508 (0.176) | 0.451 (0.140) | 0.564 (0.108) |
| EO ➔ Ach/Know | -0.166 (0.080) | -0.028 (0.120) | -0.043 (0.147) | -0.045 (0.101) | -0.076 (0.079) |
| AC ➔ Ach/Know | 0.177 (0.133) | -0.079 (0.131) | -0.066 (0.191) | -0.053 (0.149) | -0.043 (0.141) |
| EC ➔ Ach/Know | -0.023 (0.240) | -0.226 (0.323) | -0.326 (0.438) | -0.151 (0.255) | -0.146 (0.089) |
Note. To maintain conservative estimates of the correlation between the character factor and achievement, test motivation was excluded from the character factor. Standard errors are presented in parentheses. Bolded values are significant at p<.05. All variables have been residualized for Age, Sex, and Age × Sex. The outlined cells represent the key association of interest: Genetic and environmental relations between character and achievement/knowledge, controlling for fluid intelligence.
To help visualize these key finding, parameter estimates from the Cholesky decomposition of fluid intelligence, the character factor, and the latent knowledge/academic achievement factor are depicted as a path diagram in Figure 3. Dashed lines represent nonsignificant paths, and solid lines represent significant paths. The estimates in red and blue represent the key parameters of interest: the cross-paths from the genetic and environmental components of the character factor (unique of fluid intelligence) to knowledge/academic achievement. The genetic component of fluid intelligence is statistically associated with variation in the latent character and knowledge/achievement factors. Even after controlling for fluid intelligence, the genetic component of character is still associated with variation in the knowledge/achievement factor. However, the environmental component of character is not associated with variation in the knowledge/achievement factor. Finally, variance that is unique to the knowledge/achievement factor is small in magnitude and nonsignificant.
Figure 3.

Biometric decomposition of genetic and environmental associations among fluid intelligence (Gf), the character factor (Ch), and a common knowledge/achievement factor (Ach). The red and blue colors represent the key paths of interest: the genetic and environmental links between the character factor and achievement, incremental to fluid intelligence. Dotted lines represent nonsignificant paths. All paths are standardized. All indicators were residualized for age, sex, and age × sex prior to model-fitting.
These results can also be illustrated by calculating contributions of genetic and environmental factors (both shared with and unique of fluid intelligence) to the overall association between the general character factor and the knowledge/achievement factor. In other words, the parameter estimates can be used to decompose the correlation between character and knowledge/academic achievement into four parts: genetically-mediated contributions incremental to fluid intelligence, genetically-mediated contributions shared with fluid intelligence, environmentally-mediated contributions incremental to fluid intelligence, and environmentally-mediated contributions shared with fluid intelligence. The sum of the four independent contributions is the model-implied phenotypic correlation.6 Figure 4 presents these results with genetic effects represented in red and environmental effects represented in blue. Solid colors represent effects unique to character and cross-hatched colors represent effects shared with fluid intelligence. Consistent with the phenotypic results presented earlier, the model-implied phenotypic correlation between character and the achievement/knowledge variables is approximately .35, and the model-implied phenotypic correlation between character and the achievement/knowledge factor is approximately .45. Two findings are of particular note. First, genetically-mediated contributions to the association are substantially larger than environmentally-mediated contributions. Second, the largest portion of the genetically-mediated contribution is incremental to fluid intelligence (an average of 3.6 times larger than the contribution from genetic effects shared with fluid intelligence).
Figure 4.
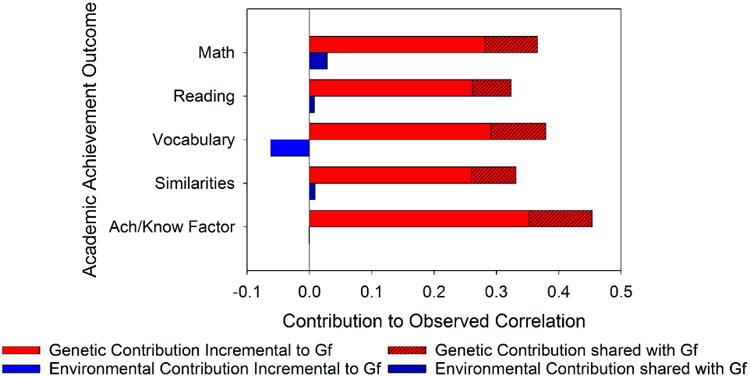
Biometric decomposition of genetic and environmental associations among fluid intelligence (Gf), the latent Openness factor (O), the latent Conscientiousness factor (C), and a common knowledge/achievement factor (Ach). The red and blue colors represent the key paths of interest: the genetic and environmental links of both Openness and Conscientiousness with achievement, incremental to fluid intelligence. Dotted lines represent nonsignificant paths. All paths are standardized. All indicators were residualized for age, sex, and age × sex prior to model-fitting.
Parameter estimates from the second set of biometric decompositions (those involving the latent Openness and Conscientiousness factors) are reported in the bottom portion of Table 13. Genetic, but not environmental, influences on fluid intelligence are modestly associated with latent Openness, whereas environmental, but not genetic influences on fluid intelligence are modestly associated with latent Conscientiousness. Of key interest are the cross-paths from the genetic and environmental components of the latent Openness and Conscientiousness factors (unique of fluid intelligence) to knowledge/academic achievement. For all achievement outcomes, except for Math, the only statistically significant instances of these cross-paths are those stemming from the genetic component of latent Openness. Neither the environmental component of latent Openness nor the genetic and environmental components of latent Conscientiousness are significantly associated with Reading, Vocabulary, or Similarities. The exception is the small, yet significant, nonshared environmental link between the environmental component of latent Openness and Math. Note that the biometric components of latent Openness and latent Conscientiousness were specified to correlate with one another in this analysis, such that their effects on achievement are independent of one another. In other words, we did not perform a Cholesky decomposition of the latent Openness-latent Conscientiousness relationship, which would have required that the biometric components of one latent variable be given priority over the other in predicting achievement. In summary, these results indicate that the earlier-reported links between the general character factor and achievement are likely driven by the component of the general character factor that taps genetic variation in Openness.
To help visualize these finding, parameter estimates from the behavioral genetic decomposition of fluid intelligence, latent Openness, latent Conscientiousness, and the latent knowledge/academic achievement factor are depicted as a path diagram in Figure 5. Dashed lines represent nonsignificant paths, and solid lines represent significant paths. The red and blue paths represent the key parameters of interest: the cross-paths from the genetic and environmental components of the latent Openness and Conscientiousness factors (unique of fluid intelligence) to latent knowledge/academic achievement. It can be seen that, even after controlling for fluid intelligence, the genetic component of latent Openness- but neither genetic nor environmental components of latent Conscientiousness- is associated with variation in the knowledge/achievement factor.
Figure 5.

Barplot representing correlations between the single general character factor and the academic achievement outcomes. The sum of the paired red (i.e., genetically-mediated contribution) and blue (i.e., environmentally-mediated contribution) bars represents the model-implied phenotypic correlation. The cross-hatched portion of the red and blue bars represents genetic and environmental contributions to associations between character and achievement shared with fluid intelligence. The solid portion of the red and blue bars represents genetic and environmental contributions to associations between the character and achievement incremental to fluid intelligence.
Behavioral Genetic Models of Associations between Fluid Intelligence, Individual Character Measures, and Academic Achievement and Verbal Knowledge
As a final set of analyses, we estimated the association between the individual character and Big Five personality measures and the knowledge/achievement factor following a similar analytical approach as in the previous section. We focused specifically on the knowledge/achievement factor, rather than also running analyses separately for each knowledge/achievement variable, in order to avoid reporting an excessive number of results. Results from these analyses are presented in Table 14, and the pattern of associations largely matches that found in Table 13. Specifically, genetic effects on fluid intelligence are minimally associated with the character or BFI measures. Statistically significant effects are only found for Need for Cognition, Educational Attitudes, Test Motivation, and BFI-Openness with average standardized parameters of .21. Genetic effects on fluid intelligence were also associated with variance in achievement/knowledge in every model. Even after controlling for fluid intelligence, genetic variance in each character variable was associated with achievement/knowledge. At the same time, none of the character variables displayed a significant nonshared environmental association with achievement. Turning to the BFI scales, BFI-Openness, BFI-Conscientiousness, and BFI-Agreeableness had significant genetic associations with achievement/knowledge. Figure 6 presents these effects as decomposed model-implied correlations. Similar to Figure 4, two results are particularly noteworthy for the character variables. First, in every case genetically-mediated effects are substantially larger than environmentally-mediated effects. On average, genetically-mediated effects were 19 times larger than the absolute value of the environmentally-mediated effects. Second, the largest portion of the genetically-mediated contributions was incremental to fluid intelligence. On average, genetic contributions incremental to fluid intelligence were 3 times as large as the absolute value of the environmentally-mediated effects.
Table 14.
Standardized parameter estimates from biometric decompositions representing associations between individual measures of character/personality and academic achievement, controlling for fluid intelligence.
| Parameter | Character/BFI Variable | ||||||||||||
|---|---|---|---|---|---|---|---|---|---|---|---|---|---|
| Grit | Need Cognition |
Intel Self- Cncpt |
Mastery | Educ. Attitude |
Increm Mindset |
Test Motivatio n |
BFI Acquiesce nce |
BFI Openness |
BFI Conscienti ousness |
BFI Extraversi on |
BFI Agreeable ness |
BFI Neuroticis m |
|
| AGf ➔ Fluid Intelligence | 0.946 (0.038) | 0.947 (0.039) | 0.947 (0.040) | 0.950 (0.037) | 0.950 (0.036) | 0.952 (0.037) | 0.956 (0.030) | 0.951 (0.036) | 0.959 (0.033) | 0.938 (0.036) | 0.954 (0.035) | 0.951 (0.036) | 0.949 (0.037) |
| CGf ➔ Fluid Intelligence | 0.224 (0.125) | 0.217 (0.133) | 0.218 (0.138) | 0.207 (0.127) | 0.204 (0.131) | 0.194 (0.141) | 0.164 (0.123) | 0.203 (0.129) | 0.155 (0.153) | 0.198 (0.133) | 0.193 (0.133) | 0.201 (0.130) | 0.207 (0.129) |
| EGf ➔ Fluid Intelligence | 0.234 (0.071) | 0.238 (0.071) | 0.237 (0.069) | 0.235 (0.073) | 0.236 (0.071) | 0.236 (0.113) | 0.242 (0.068) | 0.233 (0.070) | 0.239 (0.068) | 0.283 (0.058) | 0.230 (0.071) | 0.234 (0.070) | 0.237 (0.071) |
| Acharacter/BFI ➔ Character/BFI | 0.648 (0.056) | 0.626 (0.044) | 0.580 (0.062) | 0.570 (0.074) | 0.533 (0.064) | 0.466 (0.090) | 0.433 (0.077) | 0.260 (0.183) | 0.586 (0.052) | 0.491 (0.075) | 0.466 (0.086) | 0.565 (0.053) | 0.497 (0.073) |
| Echaracter/BFI ➔ Character/BFI | 0.759 (0.048) | 0.738 (0.046) | 0.768 (0.061) | 0.805 (0.057) | 0.827 (0.042) | 0.878 (0.052) | 0.849 (0.038) | 0.963 (0.049) | 0.769 (0.046) | 0.662 (0.089) | 0.873 (0.049) | 0.819 (0.036) | 0.846 (0.055) |
| AAch/Know ➔ Ach/Know | 0.419 (0.109) | 0.067 (0.919) | 0.155 (0.412) | 0.413 (0.123) | 0.343 (0.160) | 0.375 (0.134) | 0.125 (0.503) | 0.466 (0.036) | 0.175 (0.360) | 0.337 (0.162) | 0.288 (0.245) | 0.457 (0.098) | 0.429 (0.108) |
| CAch/Know ➔ Ach/Know | 0.003 (0.009) | 0.016 (0.066) | 0.005 (0.020) | 0.002 (0.005) | 0.001 (0.002) | -0.007 (0.045) | 0.001 (0.002) | 0.001 (0.129) | 0.002 (0.008) | 0.001 (0.006) | 0.005 (0.015) | 0 (0.001) | 0.005 (0.014) |
| EAch/Know ➔ Ach/Know | 0.001 (0.004) | 0.000 (0.001) | 0.001 (0.003) | -0.002 (0.010) | 0.000 (0.000) | -0.001 (0.006) | 0.000 (0.001) | 0.000 (0.070) | 0.000 (0.001) | 0.000 (0.000) | 0.000 (0.000) | 0.000 (0.000) | 0.001 (0.003) |
| AGf ➔ Character/BFI | 0.046 (0.067) | 0.176 (0.054) | 0.129 (0.068) | -0.085 (0.055) | 0.179 (0.058) | 0.075 (0.056) | 0.304 (0.051) | 0.002 (0.045) | 0.164 (0.05) | -0.098 (0.056) | -0.015 (0.059) | 0.091 (0.05) | 0.010 (0.054) |
| EGf ➔ Character/BFI | 0.049 (0.187) | 0.181 (0.143) | 0.238 (0.172) | 0.139 (0.168) | 0.019 (0.182) | -0.083 (0.181) | 0.012 (0.15) | 0.066 (0.129) | 0.196 (0.121) | 0.558 (0.105) | 0.146 (0.168) | -0.029 (0.15) | -0.191 (0.16) |
| AGf ➔ Ach/Know Factor | 0.505 (0.090) | 0.523 (0.089) | 0.519 (0.094) | 0.521 (0.09) | 0.526 (0.086) | 0.520 (0.098) | 0.547 (0.083) | 0.519 (0.090) | 0.558 (0.095) | 0.527 (0.092) | 0.527 (0.090) | 0.521 (0.090) | 0.516 (0.091) |
| CGf ➔ Ach/Know Factor | 0.631 (0.081) | 0.599 (0.086) | 0.605 (0.088) | 0.620 (0.083) | 0.587 (0.086) | 0.610 (0.085) | 0.585 (0.081) | 0.614 (0.085) | 0.549 (0.105) | 0.626 (0.081) | 0.602 (0.088) | 0.607 (0.086) | 0.622 (0.082) |
| EGf ➔ Ach/Know Factor | 0.369 (0.051) | 0.353 (0.053) | 0.353 (0.055) | 0.363 (0.053) | 0.365 (0.053) | 0.374 (0.052) | 0.348 (0.055) | 0.369 (0.051) | 0.347 (0.052) | 0.293 (0.064) | 0.367 (0.052) | 0.369 (0.052) | 0.364 (0.051) |
| Acharacter/BFI ➔ Ach/Know Factor | 0.184 (0.078) | 0.473 (0.075) | 0.449 (0.090) | 0.189 (0.092) | 0.354 (0.085) | 0.274 (0.101) | 0.455 (0.111) | 0.029 (0.159) | 0.468 (0.080) | 0.275 (0.094) | 0.370 (0.133) | 0.122 (0.074) | -0.157 (0.090) |
| Echaracter/BFI ➔ Ach/Know Factor | -0.010 (0.083) | -0.124 (0.072) | -0.121 (0.070) | -0.081 (0.077) | 0.047 (0.069) | 0.032 (0.074) | 0.121 (0.063) | 0.000 (0.048) | -0.135 (0.062) | -0.234 (0.056) | -0.078 (0.072) | 0.036 (0.06) | 0.074 (0.069) |
Note. Standard errors are presented in parentheses. Bolded values are significant at p<.05. All variables have been residualized for Age, Sex, and Age × Sex. The outlined cells represent the key association of interest: Genetic and environmental relations between the individual character/BFI measures and the achievement/knowledge factor, controlling for fluid intelligence.
Figure 6.

Barplot representing correlations between the character/BFI scores and the latent achievement/knowledge factor. The sum of the paired red (i.e., genetically-mediated contribution) and blue (i.e., environmentally-mediated contribution) bars represents the model-implied phenotypic correlation. The cross-hatched portion of the red and blue bars represents genetic and environmental contributions to associations between character and achievement shared with fluid intelligence. The solid portion of the red and blue bars represents genetic and environmental contributions to associations between the character and achievement incremental to fluid intelligence.
Turning toward the BFI scales, BFI-Openness, BFI-Conscientiousness, and BFI-Agreeableness each had unique genetic associations with achievement/knowledge. Similar to character, associations between the BFI scales and knowledge/achievement were primarily due to genetically-mediated effects incremental to fluid intelligence. BFI-Openness showed sizable genetically-mediated correlations with knowledge/achievement. BFI-Conscientiousness, BFI-Extraversion, BFI-Agreeableness, and BFI-Neuroticism tended to have smaller genetically-mediated associations with achievement. Acquiescence showed essentially no genetic or environmental association with achievement/knowledge.
Discussion
Using data from a genetically informative sample of 3rd to 8th grade twins, we investigated how a variety of character variables that are commonly implemented in educational research relate with one another, with fluid intelligence, and with academic achievement and verbal knowledge. The seven character variables that we examined were diverse in their content, with some (e.g., Grit) representing the tendency to work toward goals over long stretches of time, others (e.g., Need for Cognition and Mastery Orientation) representing the enjoyment of and desire to learn information, and yet others representing attitudes toward education and self-appraisals of ability. All character measures examined were positively interrelated, and a common factor captured this pattern of covariation very well. This factor was moderately related to indices of both Openness and Conscientiousness personality traits, as measured from the Big Five Inventory (BFI). When BFI-Openness and BFI-Conscientiousness were included in an exploratory factor analysis along with the seven character measures, two correlated factors- representing Openness and Conscientiousness- emerged. BFI-Conscientiousness and Grit loaded substantially on the latent Conscientiousness factor, and BFI-Openness and Intellectual Self-Concept loaded substantially on the latent Openness factor. However, the remaining character measures tended to have moderate loadings on both the latent Conscientiousness and latent Openness factors (themselves positively correlated at r = .44). These results indicate that individual character measures commonly used in educational research tend to tap a mixture of both Openness and Conscientiousness, such that the single general factor underlying the measures represents a hybrid of both of these Big Five personality traits.
The general character factor was 69% heritable, with remaining 31% of variance attributable to the nonshared environment. Latent Openness and Conscientiousness factors were 48% and 57% heritable, respectively, with the remaining variance in each factor (52% and 43% for latent Openness and Conscientiousness, respectively) attributable to the nonshared environment. At the variable-specific level, nonshared environmental influences unique of the factors were stronger, but specific genetic influences were also evident on a number of measures. There was very little evidence for shared environmental influences at either the variable-specific or common factor levels. That is, children raised in the same home did not resemble each other in their character dimensions beyond what could be attributed to genetic similarity. This finding of zero shared environmental variance might be particularly surprising, in light of popular theories of the development of child academic motivation, interest, and value (e.g., Dweck, 2006; Meece, Anderman, & Anderman, 2006; Wigfield & Eccles, 2000), which have largely focused on the role of parenting and school factors, with relatively little consideration of genetic sources of variation. It is certainly possible that parents or schools could affect the development of character; however, our results indicate that such effects are not operating to make children raised together more similar to one another. Rather, to the extent that such home or school experiences affect children's character, such experiences serve to differentiate the character of children raised together, either because children raised together encounter different experiences with their parents, peers, and schools, or because they respond to the same experiences in different ways. Additionally, behavioral genetic results are based on observed (i.e., naturally occurring) variation in character. Consequently, these results do not inform the question of whether interventions or policies that have yet to be implemented, did not naturally occur for children in the current sample, or were universally experienced by all children in the sample could potentially make children raised together more similar in their character.
We found that genetic, but not environmental, variation in character accounts for the associations between character and both academic achievement and verbal knowledge. This held regardless of whether character or achievement was operationalized with individual variables or latent factors. This finding is consistent with transactional theories of gene-environment correlation (Tucker-Drob & Harden, in press). According to such theories, individuals differentially select, evoke, and attend to educationally-relevant learning experiences on the basis of their genetically-influenced talents, dispositions, and proclivities toward learning. These learning experiences, in turn, are predicted to affect their knowledge and academic achievement, as well as to reinforce the dispositional tendencies that led a child into the environmental experience. Environmental experiences will have the strongest effects on learning when those experiences are systematic and sustained. Therefore, because genetic influences on dispositions are relatively consistent over long periods of development, whereas non-genetic sources of variation are more fleeting (Briley & Tucker-Drob, 2014; Tucker-Drob & Briley, 2014), transactional models predict that genetically-influenced variation in character will ultimately be the most relevant for academic achievement (Dickens and Flynn, 2001). Consistent with this prediction, genetically-influenced variation in character – but not environmentally-influenced variation – was positively associated with multiple measures of academic achievement and verbal knowledge. Interestingly, in the two factor model of latent Openness and Conscientiousness factors, it was primarily genetic variance in latent Openness, and neither genetic nor environmental variance in latent Conscientiousness that was responsible for links with academic achievement and verbal knowledge. This may indicate that aspects of character that are associated with interest and desire to learn may be stronger drivers of academically-relevant transactional processes than aspects of character associated with diligence and hard work.
Character and Personality Development Considered
In the rapidly expanding body of research on child personality development, it has become clear that some of the established truths regarding adult personality structure simply do not apply to childhood personality structure. In a recent review, Soto and Tackett (2015) report consistent evidence for a “substantial positive relation between conscientiousness and openness, two personality dimensions that are quite distinct in adults” (p. 359). They indicate that such results can be interpreted as representing “a higher-order self-regulation trait (representing the general capacity to regulate both social and task-related impulses” or as “an overarching mastery-orientation trait (combining intellectual curiosity with work ethic)” (Soto & Tackett, 2015, p. 359). Our results are consistent with this hypothesis in that we find coherence among several diverse educationally-relevant measures of character, some of which (e.g., need for cognition) tap intellectual curiosity and others of which (e.g., grit) tap work ethic. Moreover, we found that the common dimension underlying covariation in these character measures was considerably related to both BFI-Openness and BFI-Conscientiousness. When BFI-Openness and BFI-Conscientiousness were included along with the character measures in an exploratory factor analysis, we were able to extract latent Openness and Conscientiousness factors that correlated at r = .44, with many character measures loading moderately on both factors. Thus, our findings confirm previous observations that individual differences in attitudes and effort put toward learning cohere particularly strongly in childhood. An outstanding question is whether this phenomenon is tied to the massive amounts of time that are spent actively engaged in formal education during childhood.
The current results indicate that common measures of character thought to influence child achievement are substantially related to the Big Five personality traits and influenced by genetic effects. These results align measures of character with other psychometric features commonly attributed to personality traits. Another feature commonly associated with personality traits, stability over time, has also been reported to apply to many measures of character (e.g., one-year stability of .68 for grit [Duckworth & Quinn, 2009], seven-month stability of .86 for latent academic self-concept [Marsh, Byrne, & Yeung, 1999], two-year stability of .63 for positive attitudes toward school [Green et al., 2012]). Together, these results imply that what is commonly referred to as character, “noncognitive” skills, or other socially/educationally-defined child factors function in the world much in the same way as personality traits. Put differently, features of character may represent educationally-contextualized stable patterns of thinking and behaving that are genetically influenced and linked with academic achievement. In an effort to maximize cross-situational consistency, measures of the Big Five attempt to remove contextual features of behavior and reflect very broad individual differences domains. Measures of character appear to tap more narrow facets of personality specifically designed to assess educationally-relevant features. Such features hold great promise for personality researchers, as numerous studies document the importance of facet level variation in traditional Big Five scales (i.e., incremental prediction above and beyond the Big Five themselves). They may even help to direct intervention-oriented researchers to psychological targets of particular importance for educational contexts. At the same time, it is important to keep in mind that character traits may not be “silver bullets.” Indeed, character traits share many of the definitional features of, and are correlated with, traditional personality traits.
Limitations, Considerations, and Future Directions
Our results should be considered with some limitations and considerations. First, our approach relies on the same assumptions and limitations that are typical of the classical twins-reared-together design (see, e.g., Bouchard & McGue, 2003, for an overview). For instance, we were unable to simultaneously model both nonadditive and shared environmental effects. While we did not find strong evidence for either nonadditive or shared environmental effects in separate ACE and ADE models of character, it is conceivable that the two effects could be masking one another. More direct means of evaluating shared environmental effects can be achieved, for example, in adoption studies in which genetically unrelated close-in-age children are raised together as siblings from an early age. Future work would do well to incorporate measures of character into such a design.
Second, six of the seven character measures and all five of the Big Five indices that we implemented were based on child self-reports. Self-reports are generally known to have the potential to suffer from biased reporting (Paulhus & John, 1998), and this problem has the potential to be more severe in childhood samples. That said, other methods of assessing personality such as informant report are not without their own limitations, and there is a growing body of psychometrically rigorous literature that takes child self-reports seriously as an informational source for personality (Soto & Tackett, 2015). In order to mitigate against potential self-report biases, we implemented measurement scales specially designed for use with children and that have an appropriate reading level. Many of these scales, such as those assessing mindsets or educational attitudes, are frequently used in educational research with children similar in age to those in the current sample. Further, we calculated an index of acquiescent responding using an established method. This index was not strongly related to any of the measures, and controlling for acquiescence had a very minimal impact on any of the results, implying that response sets are unlikely explanations for our findings. Thus, we believe that the results reported are robust to measurement artifacts associated with the childhood age range sampled. However, given that many of the self-report measures used here are already so widely implemented in research in student populations, the associations documented here provide valuable information to the research community, regardless of the accuracy or construct validity of the measures themselves.
Third, based only on the results of the current (cross-sectional) study, we are unable to distinguish between the effects of character on achievement and the effects of achievement on character. Longitudinal studies, which help to untangle issues concerning direction of effects, have supported the existence of effects in the direction from some specific character dimensions (e.g., intellectual self-concept) to academic achievement, often coinciding with reciprocal effects from achievement to character (see Tucker-Drob & Harden, in press, for a review). Future work should employ longitudinal, behavioral genetic methods to a multivariate assessment of character in order to test bidirectional effects between achievement and a broader constellation of character traits than has previously been examined.
Fourth, our results do not contradict the possibility that different character measures affect one another via cascading processes. For example, having an incremental theory of intelligence might lead one to pursue a mastery goal orientation toward learning, which, in turn, might lead to valuing education more highly (Dweck & Legget, 1988). Indeed, transactional models of development highlight bidirectionality, not simply between children's psychological characteristics and their environments, but also among children's psychological characteristics (Tucker-Drob & Harden, 2012a). Such corresponsive processes have received much attention in theories of personality development (e.g., Roberts, Wood, & Caspi, 2008) and have been found, when formally modeled, to plausibly lead to the statistical emergence of common factors (Dickens, 2007; van der Maas et al., 2006; Schmittmann et al., 2013). The factors identified in the current project may represent biologically or psychologically coherent entities, or they may represent statistical dimensions that emerge from a dynamical system.
Finally, it is important to emphasize that even though we found evidence for common factors underlying the measures examined, this does not mean that the common factors are the only aspect of character of interest or import. To the contrary, the majority of variation in the individual character measures (approximately two-thirds on average) was not accounted for by the common factors. Moreover there was significant measure-specific genetic influence on nearly all character measures examined. Thus, the fact that statistical dimensions can be extracted from the multivariate system of character measures examined in the current article does not in any way undermine the importance of considering the unique aspects of each of the character measures considered.
Conclusions
In conclusion, the current article represents the first systematic, multivariate investigation of a broad variety of character measures and academic achievement using a genetically informative design. Results indicated moderate relations between the character measures and both one another and the Big Five. Although popular theories in educational psychology have focused on families and schools as the primary sources of variation in motivation, self-evaluations, interests, and values and their effects on outcomes, there was very little evidence for shared environmental influences on character at the level of either the general factor or the more specific character variables. Furthermore, there was limited evidence that environmentally-influenced variation in character was related to children's academic achievement or verbal knowledge. Rather, genetic variation in children's propensities toward an interrelated set of academically-oriented patterns of thinking, feeling, and behaving are related to differences in acquired knowledge and academic achievement. The measures of “character” examined here may be best conceptualized as indexing facets of personality that are of particular relevance to academic achievement.
Acknowledgments
Portions of this research were supported by NIH grants HD083613, HD081437, AA020588, and AA023322. The Population Research Center is supported by NIH grant HD042849. Daniel Briley was supported by NIH grant HD007081.
Footnotes
For instance, a recent book (Tough, 2012) titled “How Children Succeed: Grit, Curiosity, and the Hidden Power of Character” spent 12 weeks on the New York Times Best Seller list.
A press release issued by one of the author's (Stassun) home institution (Vanderbilt University) was titled “Grit better than GRE for predicting grad student success” (http://news.vanderbilt.edu/2014/06/grit-better-than-gre/).
To maintain continuity with models 2-5, the parameter estimates reported for Models 6 and 7 include controls for acquiescence. Results from models in which acquiescence was not controlled for are very similar to those reported in Table 6.
In the three-factor exploratory factor analysis solution, one of the factors produced had standardized loadings very close to zero for all variables except BFI-Conscientiousness, for which the standardized loading was very far out of bounds (>2.0). This was the case regardless of whether Geomin or Promax rotation criteria were specified. We therefore considered this solution uninterpretable.
In order to identify this model, which resembles the well-studied MIMIC (“Multiple Indicator Multiple Cause”) model (Muthén, 1989), the number of pathways between (latent and manifest) character variables and each knowledge/achievement criterion variable cannot exceed the number of manifest character variables. Therefore, because we retained the pathway from the latent character factor to the criterion variables, we needed to choose a pathway from a manifest character variable to exclude. We chose to exclude the pathway from Need for Cognition because its loading on the latent character factor was the highest, and hence it served as a sensible reference variable.
Using Figure 3 as an example, we can calculate these four components using path-tracing rules to connect variance in latent character to variance in latent knowledge/achievement: genetically-mediated contributions incremental to fluid intelligence (i.e., .76 × .46), environmentally-mediated contributions incremental to fluid intelligence (i.e., .58 × -.12), genetically-mediated contributions shared with fluid intelligence (i.e., .20 × .52), and environmentally-mediated contributions shared with fluid intelligence (i.e., .19 × .35).
References
- Asparouhov T, Muthén B. Exploratory structural equation modeling. Structural Equation Modeling: A Multidisciplinary Journal. 2009;16:397–438. [Google Scholar]
- Blackwell LS, Trzesniewski KH, Dweck CS. Implicit theories of intelligence predict achievement across an adolescent transition: A longitudinal study and an intervention. Child Development. 2007;78:246–263. doi: 10.1111/j.1467-8624.2007.00995.x. [DOI] [PubMed] [Google Scholar]
- Bouchard TJ. Experience producing drive theory: How genes drive experience and shape personality. Acta Paediatrica. 1997;86:60–64. doi: 10.1111/j.1651-2227.1997.tb18347.x. [DOI] [PubMed] [Google Scholar]
- Bouchard TJ, McGue M. Genetic and environmental influences on human psychological differences. Journal of Neurobiology. 2003;54:4–45. doi: 10.1002/neu.10160. [DOI] [PubMed] [Google Scholar]
- Briley DA, Domiteaux M, Tucker-Drob EM. Achievement-relevant personality: Relations with the Big Five and validation of an efficient instrument. Learning and Individual Differences. 2014;32:26–39. doi: 10.1016/j.lindif.2014.03.010. [DOI] [PMC free article] [PubMed] [Google Scholar]
- Briley DA, Tucker-Drob EM. Genetic and environmental continuity in personality development: A meta-analysis. Psychological Bulletin. 2014;140:1303–1331. doi: 10.1037/a0037091. [DOI] [PMC free article] [PubMed] [Google Scholar]
- Briley DA, Tucker-Drob EM. Comparing the developmental genetics of cognition and personality over the life span. Journal of Personality. doi: 10.1111/jopy.12186. in press. [DOI] [PMC free article] [PubMed] [Google Scholar]
- Cacioppo JT, Petty RE, Feng Kao C. The efficient assessment of need for cognition. Journal of Personality Assessment. 1984;48(3):306–307. doi: 10.1207/s15327752jpa4803_13. [DOI] [PubMed] [Google Scholar]
- Cattell RB. Some theoretical issues in adult intelligence testing. Psychological Bulletin. 1941;38:592. [Google Scholar]
- Cattell RB. Intelligence: Its structure, growth, and action. Amsterdam: North-Holland: 1987. Original work published 1971. [Google Scholar]
- Campbell DT, Fiske DW. Convergent and discriminant validation by the multitrait-multimethod matrix. Psychological Bulletin. 1959;56:81–105. [PubMed] [Google Scholar]
- Chamorro-Premuzic T, Furnham A. A possible model for understanding the personality- intelligence interface. British Journal of Psychology. 2004;95:249–264. doi: 10.1348/000712604773952458. [DOI] [PubMed] [Google Scholar]
- Cronbach LJ. Essentials of psychological testing. New York: Harper and Row; 1949. [Google Scholar]
- Cronbach LJ, Meehl PE. Construct validity in psychological tests. Psychological Bulletin. 1955;52:281–302. doi: 10.1037/h0040957. [DOI] [PubMed] [Google Scholar]
- Deary IJ, Strand S, Smith P, Fernandes C. Intelligence and educational achievement. Intelligence. 2007;35:13–21. [Google Scholar]
- Dickens WT. What is g? 2007 May 3; Retrieved May 13, 2015, from http://www.brookings.edu/research/papers/2007/05/03education-dickens.
- Dickens WT, Flynn JR. Heritability estimates versus large environmental effects: the IQ paradox resolved. Psychological Review. 2001;108:346. doi: 10.1037/0033-295x.108.2.346. [DOI] [PubMed] [Google Scholar]
- Duckworth AL, Quinn PD, Lynam DR, Loeber R, Stouthamer-Loeber M. Role of test motivation in intelligence testing. Proceedings of the National Academy of Sciences. 2011;108:7716–7720. doi: 10.1073/pnas.1018601108. [DOI] [PMC free article] [PubMed] [Google Scholar] [Retracted]
- Duckworth AL, Peterson C, Matthews MD, Kelly DR. Grit: Perseverance and passion for long-term goals. Journal of Personality and Social Psychology. 2007;92:1087–1101. doi: 10.1037/0022-3514.92.6.1087. [DOI] [PubMed] [Google Scholar]
- Duckworth AL, Quinn PD. Development and validation of the Short Grit Scale (Grit-S) Journal of Personality Assessment. 2009;91:166–174. doi: 10.1080/00223890802634290. [DOI] [PubMed] [Google Scholar]
- Dweck CS. Self-Theories: Their Role in Motivation, Personality and Development. Philadelphia: Psychology Press; 2000. [Google Scholar]
- Dweck CS. Mindset: The New Psychology of Success. New York: Random House; 2006. [Google Scholar]
- Dweck CS, Leggett EL. A social-cognitive approach to motivation and personality. Psychological Review. 1988;95:256–273. [Google Scholar]
- Goff M, Ackerman PL. Personality-intelligence relations: Assessment of typical intellectual engagement. Journal of Educational Psychology. 1992;84:537–552. [Google Scholar]
- Goldberg LR. An alternative “description of personality”: the big-five factor structure. Journal of Personality and Social Psychology. 1990;59:1216–1229. doi: 10.1037//0022-3514.59.6.1216. [DOI] [PubMed] [Google Scholar]
- Green J, Liem GAD, Martin AJ, Colmar S, Marsh HW, McInerney D. Academic motivation, self-concept, engagement, and performance in high school: Key processes from a longitudinal perspective. Journal of Adolescence. 2012;35:1111–1122. doi: 10.1016/j.adolescence.2012.02.016. [DOI] [PubMed] [Google Scholar]
- Greven CU, Harlaar N, Kovas Y, Chamorro-Premuzic T, Plomin R. More than just iq: school achievement is predicted by self-perceived abilities—But for genetic rather than environmental reasons. Psychological Science. 2009;20(6):753–762. doi: 10.1111/j.1467-9280.2009.02366.x. [DOI] [PMC free article] [PubMed] [Google Scholar]
- Hayes KJ. Genes, drives, and intellect. Psychological Reports. 1962;10:299–342. [Google Scholar]
- Harden KP, Tucker-Drob EM, Tackett JL. The Texas Twin Project. Twin Research and Human Genetics [Special Issue: Twin registers as a global resource for genetic research: An update] 2013;16:385–390. doi: 10.1017/thg.2012.97. [DOI] [PMC free article] [PubMed] [Google Scholar]
- Heath AC, Nyholt DR, Neuman R, Madden PA, Bucholz KK, Todd RD, et al. Martin NG. Zygosity diagnosis in the absence of genotypic data: An approach using latent class analysis. Twin Research and Human Genetics. 2003;6:22–26. doi: 10.1375/136905203762687861. [DOI] [PubMed] [Google Scholar]
- Heckman JJ, Rubinstein Y. The importance of noncognitive skills: Lessons from the GED testing program. American Economic Review. 2001:145–149. [Google Scholar]
- Horn JL. Unpublished doctoral dissertation. University of Illinois, Urbana-Champaign; 1965. Fluid and crystallized intelligence. [Google Scholar]
- Hulleman CS, Schrager SM, Bodmann SM, Harackiewicz JM. A meta-analytic review of achievement goal measures: Different labels for the same constructs or different constructs with similar labels? Psychological Bulletin. 2010;136:422–449. doi: 10.1037/a0018947. [DOI] [PubMed] [Google Scholar]
- John OP, Naumann LP, Soto CJ. Paradigm shift to the integrative big five trait taxonomy. Handbook of personality: Theory and research. (3rd) 2008:114–158. [Google Scholar]
- Johnson W. Extending and testing Tom Bouchard's experience producing drive theory. Personality and Individual Differences. 2010;49:296–301. [Google Scholar]
- Joreskog KG. A general approach to confirmatory maximum likelihood factor analysis. Psychometrika. 1969;34:183–202. [Google Scholar]
- Kaplan A, Maehr ML. The contributions and prospects of goal orientation theory. Educational Psychology Review. 2007;19:141–184. [Google Scholar]
- Kokis JV, Macpherson R, Toplak ME, West RF, Stanovich KE. Heuristic and analytic processing: Age trends and associations with cognitive ability and cognitive styles. Journal of Experimental Child Psychology. 2002;83:26–52. doi: 10.1016/s0022-0965(02)00121-2. [DOI] [PubMed] [Google Scholar]
- Kovas Y, Garon-Carrier G, Boivin M, Petrill SA, Plomin R, Malykh SB, et al. Vitaro F. Why children differ in motivation to learn: Insights from over 13,000 twins from 6 countries. Personality and Individual Differences. 2015;80:51–63. doi: 10.1016/j.paid.2015.02.006. [DOI] [PMC free article] [PubMed] [Google Scholar]
- Little TD, Lindenberger U, Nesselroade JR. On selecting indicators for multivariate measurement and modeling with latent variables: When “good” indicators are bad and “bad” indicators are good. Psychological Methods. 1999;4:192. [Google Scholar]
- Loehlin JC. Genes and Environment in Personality Development. Newbury Park, CA: Sage; 1992. [Google Scholar]
- Luciano M, Wainwright MA, Wright MJ, Martin NG. The heritability of conscientiousness facets and their relationship to IQ and academic achievement. Personality and Individual Differences. 2006;40:1189–1199. [Google Scholar]
- Marsh HW, Byrne BM, Yeung AS. Causal ordering of academic self-concept and achievement: Reanalysis of a pioneering study and…. Educational Psychologist. 1999;34:155–167. [Google Scholar]
- Meece JL, Anderman EM, Anderman LH. Classroom goal structure, student motivation, and academic achievement. Annual Review of Psychology. 2006;57:487–503. doi: 10.1146/annurev.psych.56.091103.070258. [DOI] [PubMed] [Google Scholar]
- Midgley C, Maehr ML, Hruda LZ, Freeman KE, Gheen M, Kaplan A, et al. Manual for the Patterns of Adaptive Learning Scales (PALS) Ann Arbor: University of Michigan; 2000. [Google Scholar]
- Miller C, Stassun K. A test that fails. Nature. 2014;510:303–304. [Google Scholar]
- Moffitt TE, Arseneault L, Belsky D, Dickson N, Hancox RJ, Harrington H, et al. Caspi A. A gradient of childhood self-control predicts health, wealth, and public safety. Proceedings of the National Academy of Sciences. 2011;108:2693–2698. doi: 10.1073/pnas.1010076108. [DOI] [PMC free article] [PubMed] [Google Scholar]
- Muthén BO. Latent variable modeling in heterogeneous populations. Psychometrika. 1989;54:557–585. [Google Scholar]
- Muthén BO, Muthén LK. Mplus [Computer software] Los Angeles, CA: Author; 2012. [Google Scholar]
- Nagengast B, Marsh HW, Scalas LF, Xu MK, Hau KT, Trautwein U. Who took the “×” out of expectancy-value theory? A psychological mystery, a substantive-methodological synergy, and a cross-national generalization. Psychological Science. 2011;22:1058–1066. doi: 10.1177/0956797611415540. [DOI] [PubMed] [Google Scholar]
- Paulhus DL, John OP. Egoistic and moralistic biases in self-perception: The interplay of self-deceptive styles with basic traits and motives. Journal of Personality. 1998;66:1025–1060. [Google Scholar]
- Petrill SA, Deater-Deckard K, Thompson LA, De Thorne LS, Schatschneider C. Reading Skills in Early Readers Genetic and Shared Environmental Influences. Journal of Learning Disabilities. 2006;39(1):48–55. doi: 10.1177/00222194060390010501. [DOI] [PMC free article] [PubMed] [Google Scholar]
- Plomin R, DeFries JC, Knopik VS, Neiderhei J. Behavioral genetics. Palgrave Macmillan; 2013. [Google Scholar]
- Poropat AE. A meta-analysis of the Five-Factor Model of personality and academic performance. Psychological Bulletin. 2009;135:322–338. doi: 10.1037/a0014996. [DOI] [PubMed] [Google Scholar]
- Rhea SA, Gross AA, Haberstick BC, Corley RP. Colorado twin registry. Twin Research and Human Genetics. 2006;9(06):941–949. doi: 10.1375/183242706779462895. [DOI] [PubMed] [Google Scholar]
- Roberts BW, Wood D, Caspi A. The development of personality traits in adulthood. Handbook of Personality: Theory and Research. 2008;3:375–398. [Google Scholar]
- Scarr S, McCartney K. How people make their own environments: A theory of genotype→ environment effects. Child Development. 1983;54:424–435. doi: 10.1111/j.1467-8624.1983.tb03884.x. [DOI] [PubMed] [Google Scholar]
- Schmittmann VD, Cramer AO, Waldorp LJ, Epskamp S, Kievit RA, Borsboom D. Deconstructing the construct: A network perspective on psychological phenomena. New Ideas in Psychology. 2013;31:43–53. [Google Scholar]
- Soto CJ, John OP, Gosling SD, Potter J. The developmental psychometrics of big five self-reports: acquiescence, factor structure, coherence, and differentiation from ages 10 to 20. Journal of Personality and Social Psychology. 2008;94:718–737. doi: 10.1037/0022-3514.94.4.718. [DOI] [PubMed] [Google Scholar]
- Soto CJ, Tackett JL. Personality Traits in Childhood and Adolescence: Structure, Development, and Outcomes. Current Directions in Psychological Science. 2015;24:358–362. [Google Scholar]
- Tam R. MacArthur fellow Angela Duckworth: Test kids' grit, not just their IQ. 2013 Retrieved May 13, 2015 from http://www.washingtonpost.com/blogs/she-the-people/wp/2013/09/27/macarthur-fellow-angela-duckworth-test-kids-grit-not-just-their-iq/
- Tough P. Curiosity, and the Hidden Power of Character. Boston, MA: Houghton Mifflin; 2012. How Children Succeed: Grit. [Google Scholar]
- Tobin J. Estimation of relationships for limited dependent variables. Econometrica. 1958;26:24–36. [Google Scholar]
- Tucker-Drob EM. Differentiation of cognitive abilities across the life span. Developmental Psychology. 2009;45:1097–1118. doi: 10.1037/a0015864. [DOI] [PMC free article] [PubMed] [Google Scholar]
- Tucker-Drob EM. How many pathways underlie socioeconomic differences in the development of cognition and achievement? Learning and Individual Differences. 2013;25:12–20. doi: 10.1016/j.lindif.2013.01.015. [DOI] [PMC free article] [PubMed] [Google Scholar]
- Tucker-Drob EM, Briley DA. Continuity of genetic and environmental influences on cognition across the life span: A meta-analysis of longitudinal twin and adoption studies. Psychological Bulletin. 2014;140:949–979. doi: 10.1037/a0035893. [DOI] [PMC free article] [PubMed] [Google Scholar]
- Tucker-Drob EM, Briley DA, Harden KP. Genetic and environmental influences on cognition across development and context. Current Directions in Psychological Science. 2013;22:349–355. doi: 10.1177/0963721413485087. [DOI] [PMC free article] [PubMed] [Google Scholar]
- Tucker-Drob EM, Harden KP. Intellectual interest mediates gene-by-socioeconomic status interaction on adolescent academic achievement. Child Development. 2012a;83:743–757. doi: 10.1111/j.1467-8624.2011.01721.x. [DOI] [PMC free article] [PubMed] [Google Scholar]
- Tucker-Drob EM, Harden KP. Learning motivation mediates gene-by-socioeconomic status interaction on early mathematics achievement. Learning and Individual Differences. 2012b;22:37–45. doi: 10.1016/j.lindif.2011.11.015. [DOI] [PMC free article] [PubMed] [Google Scholar]
- Tucker-Drob EM, Harden KP. A behavioral genetic perspective on noncognitive factors and academic achievement. In: Bouregy Susan, Grigorenko Elena L, Latham Stephen R, Tan Mei., editors. Current Perspectives in Psychology: Genetics, Ethics and Education. in press. [Google Scholar]
- Turkheimer E. Three laws of behavior genetics and what they mean. Current Directions in Psychological Science. 2000;9:160–164. [Google Scholar]
- Van Der Maas HL, Dolan CV, Grasman RP, Wicherts JM, Huizenga HM, Raijmakers ME. A dynamical model of general intelligence: the positive manifold of intelligence by mutualism. Psychological Review. 2006;113:842–861. doi: 10.1037/0033-295X.113.4.842. [DOI] [PubMed] [Google Scholar]
- Von Stumm S, Ackerman PL. Investment and intellect: A review and meta-analysis. Psychological Bulletin. 2013;139:841–869. doi: 10.1037/a0030746. [DOI] [PubMed] [Google Scholar]
- Von Stumm S, Hell B, Chamorro-Premuzic T. The hungry mind intellectual curiosity is the third pillar of academic performance. Perspectives on Psychological Science. 2011;6:574–588. doi: 10.1177/1745691611421204. [DOI] [PubMed] [Google Scholar]
- Wainwright MA, Wright MJ, Luciano M, Geffen GM, Martin NG. Genetic covariation among facets of openness to experience and general cognitive ability. Twin Research and Human Genetics. 2008;11:275–286. doi: 10.1375/twin.11.3.275. [DOI] [PubMed] [Google Scholar]
- Wang Z, Hart SA, Kovas Y, Lukowski S, Soden B, Thompson LA, et al. Petrill SA. Who is afraid of math? Two sources of genetic variance for mathematical anxiety. Journal of Child Psychology and Psychiatry. 2014;55:1056–1064. doi: 10.1111/jcpp.12224. [DOI] [PMC free article] [PubMed] [Google Scholar]
- Wechsler D. Wechsler Abbreviated Scale of Intelligence–Second Edition (WASI-II) San Antonio, TX: NCS Pearson; 2011. [Google Scholar]
- Wigfield A, Eccles JS. Expectancy–value theory of achievement motivation. Contemporary educational psychology. 2000;25:68–81. doi: 10.1006/ceps.1999.1015. [DOI] [PubMed] [Google Scholar]
- Woodcock RW, McGrew KS, Mather N. Woodcock-Johnson III. Rolling Meadows, IL: Riverside Publishing; 2001. [Google Scholar]
- Woo SE, Harms PD, Kuncel NR. Integrating personality and intelligence: Typical intellectual engagement and need for cognition. Personality and Individual Differences. 2007;43:1635–1639. [Google Scholar]