Abstract
This article describes a rapid, simple and cost-effective technique that could lead to a screening method for colitis without the need for biopsies or in vivo measurements. This screening technique includes the testing of serum using Attenuated Total Reflectance Fourier Transform Infrared (ATR-FTIR) spectroscopy for the colitis-induced increased presence of mannose. Chronic (Interleukin 10 knockout) and acute (Dextran Sodium Sulphate-induced) models for colitis are tested using the ATR-FTIR technique. Arthritis (Collagen Antibody Induced Arthritis) and metabolic syndrome (Toll like receptor 5 knockout) models are also tested as controls. The marker identified as mannose uniquely screens and distinguishes the colitic from the non-colitic samples and the controls. The reference or the baseline spectrum could be the pooled and averaged spectra of non-colitic samples or the subject's previous sample spectrum. This shows the potential of having individualized route maps of disease status, leading to personalized diagnosis and drug management.
Keywords: Colitis, ATR-FTIR, Sera, Screening, minimally invasive
1. Introduction
Inflammatory bowel diseases (IBDs), Crohn's disease and ulcerative colitis, are multifactorial disorders whose etiologies remain obscure. Although the exact pathogenesis is poorly understood, there is evidence that it involves interactions among the immune system, genetic susceptibility, and the environment, most notably the bacterial flora.
The two major forms of IBDs, Ulcerative Colitis[1] and Crohn's disease[2] are debilitating gastrointestinal tract disorders that can lead to life threatening complications such as colorectal cancer[3]. Assessment of intestinal inflammation in IBD remains a difficult challenge[4]. Currently, the clinical diagnosis is achieved by colonoscopy that assesses the endoscopic appearance of the colon. However, this technique is not ideal for monitoring disease activity regularly or as an annual checkup since it is expensive and invasive, requiring sedation. Thus, there is a need for new, low risk, simple, inexpensive and objective tools for IBD diagnostics.
In the last two decades, Infrared spectroscopy has greatly enhanced clinical medicine through advancements in the field of spectroscopy and imaging. Specifically, there is an emerging infrared technology called Attenuated Total Reflectance Fourier Transform Infrared (ATR-FTIR) spectroscopy used in life sciences. This technique[5] is sensitive to the bond vibrations of the molecular composition of the sample and requires minimal sample preparation[6, 7], which provides a rapid diagnostic alternative to biological assays[8].
2. Materials and Methods
Mice
Three week-old female C57BL/6 wild type (WT) and interleukin 10 knockout (IL10−/−) mice were obtained from Jackson Laboratories (Bar Harbor, ME). Toll-like receptor knockout (TLR5−/−) mice were grown in our facility. Mice were group housed under a controlled temperature (25°C) and photoperiod (12:12-h light–dark cycle) and fed ad libitum. All studies were performed in accordance with the Institutional Animal Care and Use Committee at Georgia State University (Atlanta, GA), permit number: A14010.
Development of colitis in IL10−/−
IL10−/− mice develop colitis on a time dependent manner. In order to assess the intestinal inflammation in those mice at different times of colitis development, feces were collected at week 4 and week 14 to measure Lcn-2. Blood was collected at week 4 and 14 to obtain sera by centrifugation using serum separator tubes (BD Biosciences, Franklin Lakes, NJ)
Dextran Sodium Sulphate (DSS) induced Colitis
C57BL/6 WT mice were administered DSS (MP Biomedicals, Solon, OH) at 3% in drinking water ad libitum for 7 days. Feces and blood were collected at day 0 (before DSS treatment) and day 7. Hemolysis-free serum was collected by centrifugation using serum separator tubes. Mice were sacrificed by CO2 euthanasia.
Collagen Antibody-Induced Arthritis Model
BALB/C WT mice received collagen antibodies injections (200 μL) on day 0 by an intravenous injection (tail vein). On day 6, mice received a lipopolysaccharide (LPS) boost injection (200μL) by intraperitoneal injection. Blood samples were collected from each mouse on pretreatment (day −2) and on day 12 from the jugular vein. Hemolysis-free serum was collected by centrifugation using serum separator tubes.
TLR5−/− model of metabolic syndrome
TLR5−/− spontaneously develop metabolic syndrome as previously described[9]. Age-matched WT and TLR5−/− mice were fasted for 5-h and baseline blood glucose levels measured with a blood glucose meter (Roche) using blood collected from the tail vein.
H&E staining of colonic tissue
Mouse colons were fixed in 10% buffered formalin for 24 hours at room temperature and then embedded in paraffin. Tissues were sectioned at 5-μm thickness and stained with hematoxylin & eosin (H&E) using standard protocols. Images were acquired using a Zeiss Axioskop 2 plus microscope (Carl Zeiss MicroImaging) equipped with an AxioCam MRc5 CCD camera (Carl Zeiss).
Quantification of fecal and serum Lcn-2 by ELISA
Fecal samples were reconstituted in PBS containing 0.1% Tween 20 (100 mg/ml). After centrifugation, clear supernatants were collected. Serum samples were diluted in kit-recommended reagent diluent (1.0% BSA in PBS). Lipocalin-2 (Lcn-2) levels were estimated in the supernatants and/or serum using Duoset murine Lcn-2 ELISA kits (R&D Systems, Minneapolis, MN).
Colonic Myeloperoxidase (MPO) Assay
Neutrophil influx in colon was analyzed as marker of inflammation by assaying the enzymatic activity of MPO, a neutrophils marker. Briefly, tissue (50 mg/mL) was thoroughly washed in PBS and homogenized in 0.5% hexadecyltrimethylammonium bromide (Sigma, St. Louis, MO) in 50 mM PBS, (pH 6.0), freeze-thawed 3 times, sonicated and centrifuged. MPO was assayed in the clear supernatant by adding 1 mg/mL of dianisidine dihydrochloride (Sigma) and 0.0005% H2O2 and the change in optical density measured at 450 nm. Human neutrophil MPO (Sigma) was used as standard. One unit of MPO activity was defined as the amount that degraded 1 mmol peroxidase per minute.
Fourier Transform Infrared (FTIR) Spectroscopy
A Bruker Vertex 70 FTIR spectrometer was used to obtain all the spectroscopic results. The samples were scanned covering the wavelength range of 4000 to 400 cm−1 and the 1800 to 1000 cm−1 section was used for this study. A medium Blackman-Harris appodization was employed with a resolution of 8 cm−1. The samples were scanned 50 times and averaged. Each co-added sample scan was repeated 5 times and averaged. A room temperature Deuterated Lanthanum Alanine doped TriGlycine Sulphate (DLaTGS) pyroelectric detector was employed. The infrared light beam intensity was controlled by passing it through a 3mm aperture. This is done to optimize the detector response and prevent saturation. A Parker-Balston dry air purging system was used to reduce the moisture and carbon dioxide levels of the ambient air in the spectrometer.
Attenuated Total Reflectance (ATR) configuration
MVP-Pro ATR accessory from Harrick-Scientific was used for all spectroscopic measurements in this study. A diamond crystal (1mm × 1.5mm) was the internal reflection element configured to have a single reflection of the infrared radiation. A sample of one microliter is deposited on the crystal surface and allowed to air dry (~5 minutes). An evanescent wave with an approximate penetration depth of 2 microns (dependent on the refractive indices of the ATR crystal and sample and the wavelength of light) interacts with the sample. The output spectra is an ATR absorbance spectra which is subsequently analysed.
Post processing techniques
The 5 reads of the 50 co-added scans for each sample (total of 250 scans) are averaged. The spectra were sectioned to the 1800 to 1000 cm−1 range. Using OPUS 7.2 software, all the spectra were internally normalized[10] by scaling the entire sectioned range so that the absorbance value at the 1642 cm−1 peak (Amide I) was 2.0. Spectral deconvolution was also done to better resolve the peaks by obtaining the second derivative followed by a 9 point smoothing using Microsoft Excel software.
Data analysis techniques
Cluster and heterogeneity analyses were carried out in the spectral range of 1140 to 1000 cm−1 using the Bruker Optics OPUS 7.2 software. The algorithm calculates the Euclidean distance between each spectrum and groups them into clusters based on the conformity of the spectra with each other. The resulting data is plotted as a heterogeneity dendrogram chart where the heterogeneity index on the y-axis indicates the degree of heterogeneity between the identified clusters. Student's t-tests were carried out for the DSS study and not for the IL10−/−, CAIA and Metabolic syndrome studies due to the smaller sample sizes, although the uncertainty levels of the averages are shown.
3. Results and discussion
DSS-induced colitis[11, 12] is a commonly used chemically-induced mouse model of acute colitis which has similarities to ulcerative colitis in human. DSS first disrupts the intestinal barrier functions followed by an increase of inflammation which closely resembles histological and clinical characteristics of IBDs such as ulcerative colitis[13, 14]. The second model studied, IL10−/− mouse model[15] closely resembles the physiological, histological and biochemical features of human chronic colitis and develops colitis mediated by T helper cell 1 (Th1) cells. Mice with targeted deletion of the IL10 gene spontaneously develop chronic enterocolitis with massive infiltration of lymphocytes, activated macrophages, and neutrophils in a Th1 cell-mediated mechanism[16]. The predictability of the timing of colitis in IL10−/− mice allows longitudinal assessment of blood samples during colitis progression from 4 weeks (no symptoms shown) up to 14 weeks, the age at which the mice display signs of severe colitis.
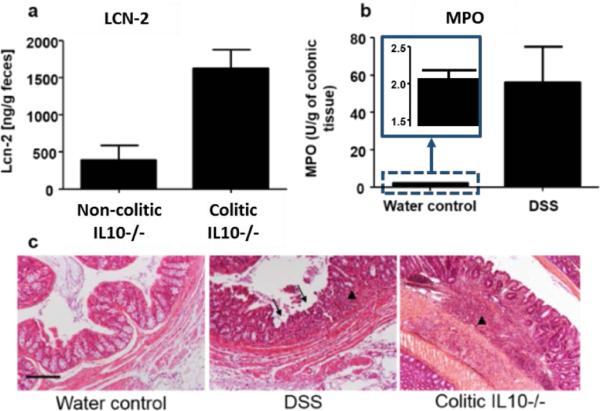
To confirm the effectiveness of these two models as tools for investigating spectral markers for colitis, the development of colitis was assessed in these mice using other established techniques. Histological features were assessed by H&E staining, and the degree of inflammation was measured in DSS and IL10−/− model by respectively assessing MPO activity, a marker of inflammation in the colon[17], and measuring fecal Lipocalin 2 (Lcn-2) levels, previously described[18] as being a robust fecal marker that correlates with the severity of inflammation. MPO is produced by neutrophils, a class of leukocytes that highly infiltrate into the mucosa in a situation of intestinal inflammation. Increases of Lcn-2 levels and MPO activity in the feces of IL10−/− mice (figure 1a) and in DSS-induced colitis colon samples (figure 1b) respectively, were observed. The increase of lymphocyte infiltration (figure 1c, arrow head) and the erosion (figure 1c, arrow) of intestinal glands (crypt), observed on the H&E stained picture of the colon confirmed that, in contrast to the control groups (non-colitic), the DSS-treated and the IL10−/− mice develop colitis.
Figure 1.
(a) Lcn-2 was quantified in the feces of mice showing a clear increase of Lcn-2 in colitic IL10−/− Vs. non-colitic IL10−/− mice. (b) Colonic Myeloperoxidase (MPO) activity was quantified in the distal colon of DSS induced-colitis compared to water control mice agreeing well with the spectroscopy data. (c) Respective H&E-stained colons of WT water control, DSS-induced colitis and colitic IL10−/− mice indicate sites of lymphocytes infiltrations (arrow heads) and erosion of the crypt figures (arrows). Scale bar: 100μm.
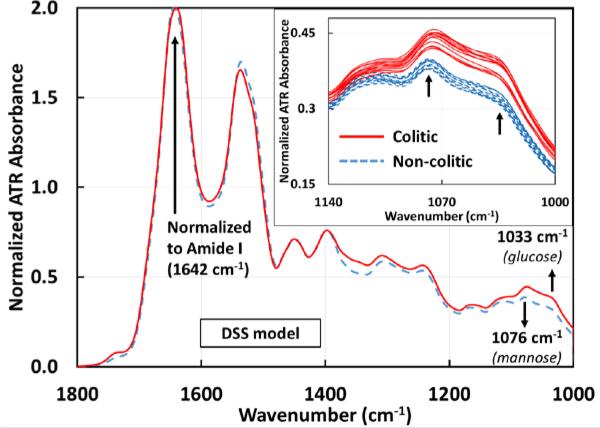
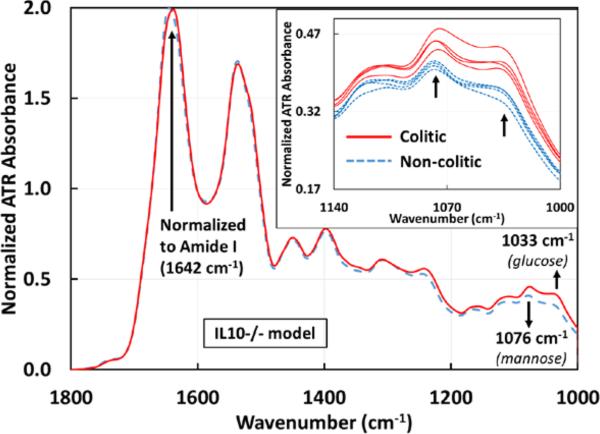
Spectroscopic measurements were performed on sera from DSS-induced colitis mice compared to the same mice before intake of DSS (control mice) and on colitic IL10−/− mice compared to the same mice before the development of colitis. Serum was chosen due to its stability and absence of any additives such as anticoagulants. Serum samples were deposited on the ATR crystal and allowed to dry. By allowing the water in the sera to evaporate, the signal to noise ratio of the spectral signal of other sera components are greatly enhanced, which are otherwise occluded by the broad water absorption. Similar significant differences in absorbance were observed in both DSS (figure 2) and IL10−/− (figure 3) mouse models between the control groups (non-colitic) and the colitic groups at ~1033 cm−1 and ~1076 cm−1. Both absorbance peaks have been attributed to the symmetric stretching modes of C-O indicating the presence of saccharides[19], with the vibrational modes at ~1033 cm−1 and ~1076 cm−1 due to glucose and mannose respectively[20].
Figure 2.
Averaged ATR-FTIR spectra of sera drawn from mice before (n=12) and after (n=12) developing colitis induced by 3% DSS. The differentiating markers 1033 and 1076 cm−1 are identified as glucose and mannose with p-values of 4.43E-8 and 7.59E-8 respectively. The inset shows the individual serum samples from 1140 – 1000 cm−1 for clarity. Individual colitic and non-colitic spectra show a clear separation between the groups. With further data points it should be possible to find an absorbance range for the two groups. All spectra are normalized to the Amide I peak (1642 cm−1). The averages for the glucose peak are 0.3175±0.0024 (non-colitic) and 0.3788±0.0041 (colitic) and the averages for the mannose peak are 0.3847±0.0022 (non-colitic) and 0.438±0.0035 (colitic).
Figure 3.
Averaged ATR-FTIR spectra of sera drawn from IL10−/− mice before (n=4) and after (n=4) spontaneously developing colitis. The same markers 1033 and 1076 cm−1identified in the DSS model are effective in differentiating colitic from non-colitic spectra of the IL10−/− model. The inset shows the individual serum samples from 1140 – 1000 cm−1 for clarity, again showing a clear separation between the two groups. All spectra are normalized to the Amide I peak (1642 cm−1). The averages for the glucose peak are 0.3491±0.0057 (non-colitic) and 0.412±0.009 (colitic) and the averages for the mannose peak are 0.4071±0.0034 (non-colitic) and 0.4553±0.0081 (colitic).
It has been reported that in colitis serum samples, there is a reduction in butyrate oxidation with a compensatory increase in the oxidation levels of glucose[21]. Hence, the increase in the absorbance at ~1033 cm−1 in colitic serum samples could be an indication of colitis.
Studies in humans have shown the co-occurrence of ulcerative colitis with that of diabetes and glucose intolerance[22]. In order to exclude the possibility that the mannose and glucose peaks obtained for the IL10−/− and DSS-induced models of colitis originate from the co-occurrence of other glucose intolerance conditions, similar assays were performed using a mouse model developing metabolic syndrome. Mice deficient of Toll-like receptor 5, a component of the innate immune system that is expressed in the intestinal mucosa, exhibit hyperphagia and develop the hallmark features of metabolic syndrome, including hyperlipidemia, hypertension, insulin resistance, and increased adiposity [23].
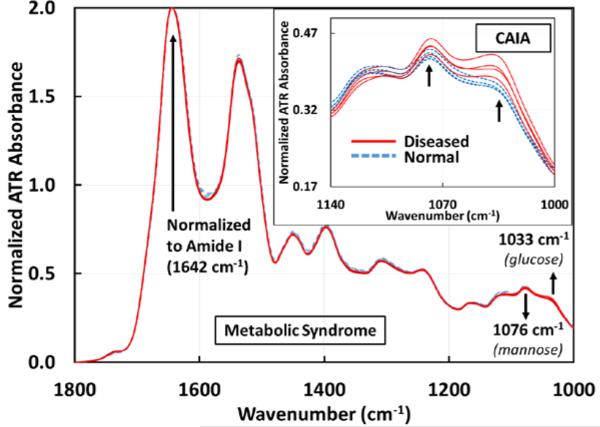
As seen in figure 4, metabolic syndrome samples did not show any significant differences in absorbance at the ~1033 cm−1 and ~1076 cm−1 peaks with respect to ATR-FTIR spectroscopy in this wavelength range of interest. This indicates that these particular mannose and glucose peaks observed in colitic samples were not a result of metabolic syndrome.
Figure 4.
ATR-FTIR spectra of sera drawn from mice before (n=4) and after (n=4) developing metabolic syndrome. In these 8 spectra, the two spectral markers at 1033 cm−1 and 1076 cm−1 do not show any difference in the metabolic syndrome samples with respect to ATR-FTIR technique. The inset shows the spectra (1140 – 1000 cm−1) of sera drawn from collagen antibody-induced arthritic (n=4) and normal (n=4) mice (total of 8). 1033 cm−1 marker is common to colitis and arthritis, but 1076 cm−1 marker is unique to colitis. All spectra are normalized to the Amide I peak (1642 cm−1).
The next objective was to determine whether the absorbance changes in the two peaks at ~1033 cm−1 and ~1076 cm−1, were specific to intestinal inflammation or associated with any kind of inflammation. Collagen antibody-induced arthritis (CAIA) was employed as a model of extra-intestinal inflammation. An increase in absorbance was seen in arthritic sera samples at ~1033 cm−1 (similar to colitic samples), but not at ~1076 cm−1 as previously seen in the inset of figure 4. This result suggests that the glucose peak might not be specific to colitis but general to an inflammation from any origin. However, the mannose peak at ~1076 cm−1 appeared to be specific to colitis. It has been reported that in ulcerative colitis cases in humans, one of the glycoprotein fractions in the colonic mucus has elevated levels of mannose that was confirmed using biological assays[24]. The lesions on the colon characteristic of colitis can facilitate the diffusion of mannose into the circulating blood stream, thus manifesting as increased levels of mannose in serum[25]. This phenomenon could explain the increased levels of mannose in the colitic mice serum samples in the DSS model at ~1076 cm−1 spectral marker. Another study using Proton Nuclear Magnetic Resonance spectroscopy reports that there is a significant increase in mannose levels[26] in the serum for DSS-induced colitic mice which is confirmed by our ATR-FTIR spectroscopic study.
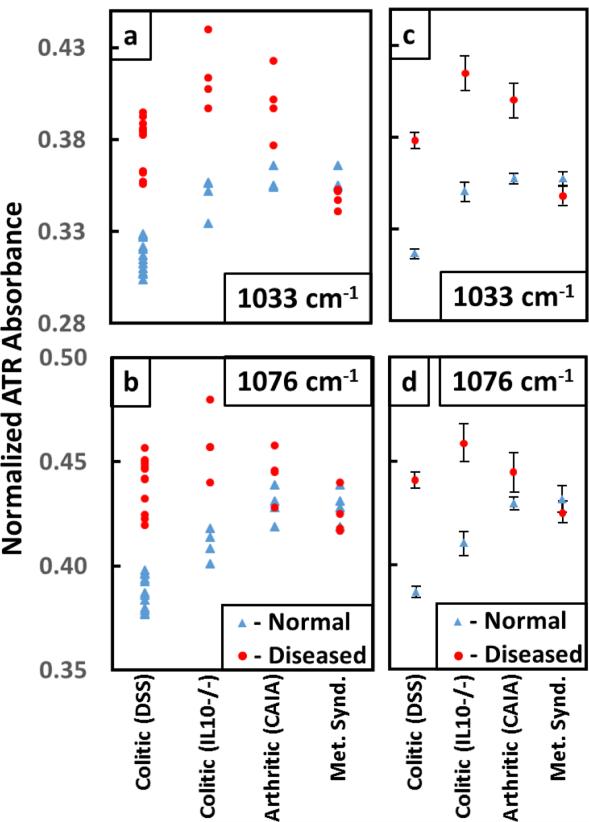
As seen in figure 5a, the absorbance levels at ~1033 cm−1 indicated that the glucose peak increased at the onset of arthritis and colitis. The absorbance data points for the metabolic samples did not show a clear separation from the normal in either individual (figures 5a and b) or the average (figures 5c and d) values at ~1033 and ~1076 cm−1. The error bars associated with the averaged absorbance values of diseased samples in figures 5c and d were larger than the normal sample values as each mouse could be at a different stage of the disease.
Figure 5.
Plot of the absorbances for the glucose peak (a) at ~1033 cm−1 and the mannose peak (b) at ~1076 cm−1 for Colitic (DSS), Colitic (IL10−/−), Arthritic (CAIA) and Metabolic syndrome samples. (c) and (d) show the average values of absorbances for the normal and diseased samples with the error bars. The error bars associated with the normal samples are much smaller than the diseased samples as expected. The metabolic syndrome samples do not show a separation from the normal at either of the two peaks. However especially for colitis samples, there is a clear separation from the normal samples. The absorbance data associated with the peak at ~1033 cm−1 for arthritis also show a separation but not at ~1076 cm−1. Hence this analysis shows that the absorbance data related to the mannose peak at ~1076 cm−1 is unique to colitis.
The absorbance data for arthritis also showed a separation at ~1033 cm−1 but no appreciable difference in the mannose peak at ~1076 cm−1 (figure 5b). However, especially for colitis samples, there were clear separations from the normal samples.
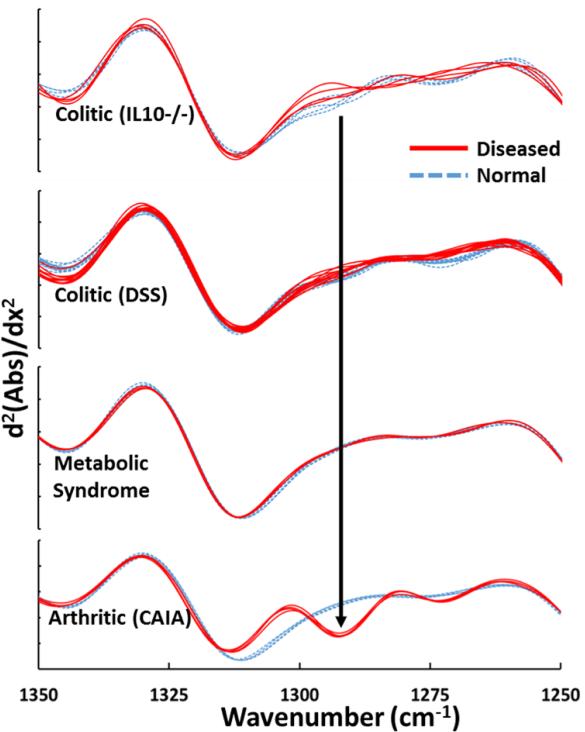
Moreover, arthritis serum samples displayed an absorption peak at 1292 cm−1 which was observed only for arthritis and not for colitis (both DSS and IL10−/−) or metabolic syndrome serum samples. This peak was identified as thymine[19]. It has been reported that, in cases of arthritis, thymidine begins to break down to thymine[27] which explains the increased presence of thymine in the serum.
On deconvolution of the spectra by performing the second derivative on the absorbance values (figure 6), one can clearly distinguish between the serum samples representative of intra- (colitic) and extra- (arthritic) intestinal inflammation based on the thymine peak.
Figure 6.
Second derivative of the absorbances of colitic (IL10−/− and DSS), metabolic syndrome and arthritic samples clearly indicating the 1292 cm−1 peak identified as thymine which is unique to arthritis.
There was no notable difference in absorbance values for the metabolic syndrome samples and their controls indicating that the presence of metabolic syndrome was not manifested at these spectral markers. The analysis indicated that the increase in glucose peak (~1033 cm−1) was common to colitis and arthritis, but the increase in mannose peak (~1076 cm−1) was unique to colitis.
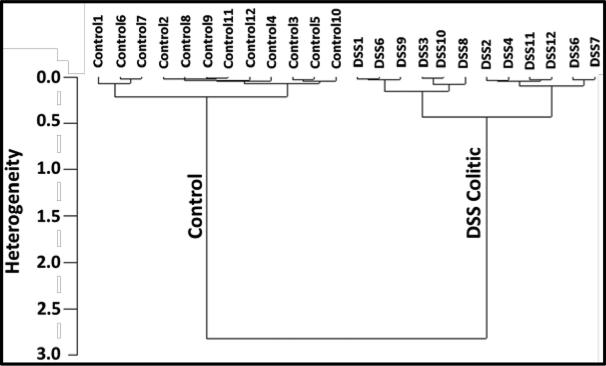
Cluster and heterogeneity analyses[28], commonly employed in computational biology, were carried out in the spectral range of 1140 to 1000 cm−1 to include the glucose (1033 cm−1) and mannose (1076 cm−1) peaks. The input datasets include the 12 DSS induced colitic and 12 control sample spectra. The resulting data is plotted as a heterogeneity dendrogram chart (figure 7) indicating that the spectra were correctly grouped together and classified into two clusters, namely control and colitic with a high degree of heterogeniety.
Figure 7.
Dendrogram plots of the cluster analyses of colitis DSS sample spectra (12 colitic and 12 control) in the range of 1140 to 1000 cm−1 to include glucose (1033 cm−1) and mannose (1076 cm−1) peaks. The spectra are correctly classified into the colitic and control groups based on their conformity to each other. Large heterogeneity is seen between colitis and control samples (2.5) indicating that the two groups are distinctly different. Similar heterogeneity (1.3) is seen in the IL10−/− study.
4. Conclusion
A rapid, simple, cost effective and minimally invasive technique, ATR-FTIR spectroscopy, has been demonstrated as an effective tool to detect colitis in mice serum. The use of a metabolic syndrome mouse model and an arthritis model indicate the specificity of the mannose peak for colitis. More work is currently being done including, a) increased sample sizes, b) specificity of diagnosis to other IBDs such as collagenous and lymphocytic colitis and Crohn's disease, c) calibration of the markers to determine the sensitivity and d) to miniaturize the technique to small devices and with positive human blood trials. A portable device capable of detecting similar variations in mannose and glucose absorbance will require a specific infrared detector capable of simultaneous multiband detection in order to avoid bulky interferometers or gratings. The developments in infrared detector technology allowing room temperature operation of multiband infrared detectors make this possible[29-32]. In terms of application, this potential technology can be further developed into a personalized diagnostic tool in which patient-to-patient differences in molecular signatures would allow the assessment of disease status and personalized drug management. We can anticipate that this technology could be integrated in a portable device, like the current glucometer, that each patient would wear as a platform to monitor multiple health parameters at the point-of-care, facilitating the creation of bedside technologies for diagnostics and treatment monitoring for various other medical conditions[8] such as arthritis, viral or bacterial infections, allergies etc including IBD.
Acknowledgements
Financial support from the following entities are much appreciated: U.S. Army W911 NF-15-1-0018; Defense University Research Instrumentation Program 55655-EL-DURIP; Department of Veterans Affairs (Merit Award: BX002526); Crohn's & Colitis Foundation of America research fellowship award to EV; National Institutes of Health of Diabetes and Digestive and Kidney RO1DK064711 and RO1DK071594; Molecular Basis of Diseases (MBD) program at Georgia State University
Dr. Chassaing's provision of the serum samples from TLR5−/− mice and the corresponding WT controls is appreciated. All experiments conducted on mice were performed in accordance with the Institutional Animal Care and Use Committee at Georgia State University (Atlanta, GA).
References
- 1.Kornbluth A, et al. How Effective Is Current Medical Therapy for Severe Ulcerative and Crohn's Colitis?: An Analytic Review of Selected Trials. Journal of clinical gastroenterology. 1995;20(4):280–284. doi: 10.1097/00004836-199506000-00004. [DOI] [PubMed] [Google Scholar]
- 2.Friedman S, et al. Screening and surveillance colonoscopy in chronic Crohn's colitis. Gastroenterology. 2001;120(4):820–826. doi: 10.1053/gast.2001.22449. [DOI] [PubMed] [Google Scholar]
- 3.Argov S, et al. Inflamatory bowel diseases as an intermediate stage between normal and cancer: A FTIR - microspectroscopy approach. Biopolymers. 2004;75(5):384–392. doi: 10.1002/bip.20154. [DOI] [PubMed] [Google Scholar]
- 4.Schreyer A, et al. Comparison of magnetic resonance imaging colonography with conventional colonoscopy for the assessment of intestinal inflammation in patients with inflammatory bowel disease: a feasibility study. Gut. 2005;54(2):250–256. doi: 10.1136/gut.2003.037390. [DOI] [PMC free article] [PubMed] [Google Scholar]
- 5.Sommer AJ, et al. Attenuated total internal reflection infrared mapping microspectroscopy using an imaging microscope. Applied spectroscopy. 2001;55(3):252–256. [Google Scholar]
- 6.Kazarian S, Chan K. ATR-FTIR spectroscopic imaging: recent advances and applications to biological systems. The Analyst. 2013;138(7):1940–1951. doi: 10.1039/c3an36865c. [DOI] [PubMed] [Google Scholar]
- 7.Kazarian SG, Chan KLA. Applications of ATR-FTIR spectroscopic imaging to biomedical samples. Biochimica et Biophysica Acta (BBA) - Biomembranes. 2006;1758(7):858–867. doi: 10.1016/j.bbamem.2006.02.011. [DOI] [PubMed] [Google Scholar]
- 8.Titus J, et al. Early detection of cell activation events by means of attenuated total reflection Fourier transform infrared spectroscopy. Applied Physics Letters. 2014;104(24):243705. [Google Scholar]
- 9.Vijay-Kumar M, et al. Metabolic syndrome and altered gut microbiota in mice lacking Toll-like receptor 5. Science. 2010;328(5975):228–231. doi: 10.1126/science.1179721. [DOI] [PMC free article] [PubMed] [Google Scholar]
- 10.Yu C, Irudayaraj J. Spectroscopic characterization of microorganisms by Fourier transform infrared microspectroscopy. Biopolymers. 2005;77(6):368–377. doi: 10.1002/bip.20247. [DOI] [PubMed] [Google Scholar]
- 11.Laroui H, et al. Dextran sodium sulfate (DSS) induces colitis in mice by forming nano-lipocomplexes with medium-chain-length fatty acids in the colon. PloS one. 2012;7(3):e32084. doi: 10.1371/journal.pone.0032084. [DOI] [PMC free article] [PubMed] [Google Scholar]
- 12.Chassaing B, et al. Dextran Sulfate Sodium (DSS) - Induced Colitis in Mice. Current Protocols in Immunology. :15.25. 1–15.25. 14. doi: 10.1002/0471142735.im1525s104. [DOI] [PMC free article] [PubMed] [Google Scholar]
- 13.Clapper ML, Cooper HS, CHANG WCL. Dextran sulfate sodium - induced colitis - associated neoplasia: a promising model for the development of chemopreventive interventions1. Acta pharmacologica Sinica. 2007;28(9):1450–1459. doi: 10.1111/j.1745-7254.2007.00695.x. [DOI] [PubMed] [Google Scholar]
- 14.Perše M, Cerar A. Dextran sodium sulphate colitis mouse model: traps and tricks. Journal of biomedicine & biotechnology. 2011;2012:718617–718617. doi: 10.1155/2012/718617. [DOI] [PMC free article] [PubMed] [Google Scholar]
- 15.Kennedy R, et al. Interleukin 10 - deficient colitis: new similarities to human inflammatory bowel disease. British journal of surgery. 2000;87(10):1346–1351. doi: 10.1046/j.1365-2168.2000.01615.x. [DOI] [PubMed] [Google Scholar]
- 16.Kim JJ, et al. Investigating Intestinal Inflammation in DSS-induced Model of IBD. Journal of Visualized Experiments : JoVE. 2012;(60):3678. doi: 10.3791/3678. [DOI] [PMC free article] [PubMed] [Google Scholar]
- 17.Viennois E, et al. Micheliolide, a new sesquiterpene lactone that inhibits intestinal inflammation and colitis-associated cancer. Laboratory Investigation. 2014;94(9):950–965. doi: 10.1038/labinvest.2014.89. [DOI] [PubMed] [Google Scholar]
- 18.Chassaing B, et al. Fecal lipocalin 2, a sensitive and broadly dynamic non-invasive biomarker for intestinal inflammation. PloS one. 2012;7(9):e44328. doi: 10.1371/journal.pone.0044328. [DOI] [PMC free article] [PubMed] [Google Scholar]
- 19.Movasaghi Z, Rehman S, ur Rehman DI. Fourier transform infrared (FTIR) spectroscopy of biological tissues. Applied Spectroscopy Reviews. 2008;43(2):134–179. [Google Scholar]
- 20.Petibois C, et al. Determination of glucose in dried serum samples by Fourier- transform infrared spectroscopy. Clinical chemistry. 1999;45(9):1530–1535. [PubMed] [Google Scholar]
- 21.Ahmad M, et al. Butyrate and glucose metabolism by colonocytes in experimental colitis in mice. Gut. 2000;46(4):493–499. doi: 10.1136/gut.46.4.493. [DOI] [PMC free article] [PubMed] [Google Scholar]
- 22.Maconi G, et al. Glucose intolerance and diabetes mellitus in ulcerative colitis: Pathogenetic and therapeutic implications. World Journal of Gastroenterology : WJG. 2014;20(13):3507–3515. doi: 10.3748/wjg.v20.i13.3507. [DOI] [PMC free article] [PubMed] [Google Scholar]
- 23.Vijay-Kumar M, et al. Metabolic syndrome and altered gut microbiota in mice lacking Toll-like receptor 5. Science. 2010;328(5975):228–31. doi: 10.1126/science.1179721. [DOI] [PMC free article] [PubMed] [Google Scholar]
- 24.Teague R, Fraser D, Clamp J. Changes in monosaccharide content of mucous glycoproteins in ulcerative colitis. BMJ. 1973;2(5867):645–646. doi: 10.1136/bmj.2.5867.645. [DOI] [PMC free article] [PubMed] [Google Scholar]
- 25.Freeman HJ. Inflammatory Bowel Disease. Taylor & Francis; 1989. [Google Scholar]
- 26.Schicho R, et al. Quantitative Metabolomic Profiling of Serum and Urine in DSS- Induced Ulcerative Colitis of Mice by 1H NMR Spectroscopy. Journal of Proteome Research. 2010;9(12):6265–6273. doi: 10.1021/pr100547y. [DOI] [PubMed] [Google Scholar]
- 27.Nykänen P. Degradation of thymidine to thymine by rheumatoid arthritis synovial tissue eluate. Scandinavian journal of immunology. 1979;9(5):477–482. doi: 10.1111/j.1365-3083.1979.tb03070.x. [DOI] [PubMed] [Google Scholar]
- 28.Godehardt E. Graphs as structural models: The application of graphs and multigraphs in cluster analysis. Springer Science & Business Media; 2013. [Google Scholar]
- 29.Perera AGU, et al. Room temperature nano- and microstructure photon detectors. Microelectronics Journal. 2009;40(3):507–511. [Google Scholar]
- 30.Jayaweera PVV, Perera AGU, Tennakone K. Displacement currents in semiconductor quantum dots embedded dielectric media: A method for room temperature photon detection. Applied Physics Letters. 2007;91(6):063114. [Google Scholar]
- 31.Ariyawansa G, et al. Multi-color tunneling quantum dot infrared photodetectors operating at room temperature. Infrared Physics & Technology. 2007;50(2–3):156–161. [Google Scholar]
- 32.Perera A, et al. High operating temperature split-off band infrared detectors. Applied Physics Letters. 2006;89(13):131118. [Google Scholar]


