

Abstract
The beta score, a composite measure of beta cell function after islet transplantation, has limited sensitivity because of its categorical nature and requires a mixed‐meal tolerance test (MMTT). We developed a novel score based on a single fasting blood sample. The BETA‐2 score used stepwise forward linear regression incorporating glucose (in millimoles per liter), C‐peptide (in nanomoles per liter), hemoglobin A1c (as a percentage) and insulin dose (U/kg per day) as continuous variables from the original beta score data set (n = 183 MMTTs). Primary and secondary analyses assessed the score's ability to detect glucose intolerance (90‐min MMTT glucose ≥8 mmol/L) and insulin independence, respectively. A validation cohort of islet transplant recipients (n = 114 MMTTs) examined 12 mo after transplantation was used to compare the score's ability to detect these outcomes. The BETA‐2 score was expressed as follows (range 0–42):
A score <20 and ≥15 detected glucose intolerance and insulin independence, respectively, with >82% sensitivity and specificity. The BETA‐2 score demonstrated greater discrimination than the beta score for these outcomes (p < 0.05). Using a fasting blood sample, the BETA‐2 score estimates graft function as a continuous variable and shows greater discrimination of glucose intolerance and insulin independence after transplantation versus the beta score, allowing frequent assessments of graft function. Studies examining its utility to track long‐term graft function are required.
Keywords: clinical research/practice, translational research/science, endocrinology/diabetology, islet transplantation, diabetes: type 1, immunosuppressant, immunosuppressive regimens, islets of Langerhans
Short abstract
Using regression analyses from the original Edmonton islet transplant recipients’ fasting C‐peptide, fasting glucose, HbA1c and insulin requirements, the authors derive a new score of islet engraftment from a single fasting blood sample, then validate it in a separate cohort of islet transplant recipients.
Abbreviations
- AIR
acute insulin response
- AUROC
area under the receiver operating characteristic
- CI
confidence interval
- HbA1c
hemoglobin A1c
- IE
islet‐equivalent units
- IQR
interquartile range
- ITx
islet transplantation
- MMTT
mixed‐meal tolerance test
- OGTT
oral glucose tolerance test
- ROC
receiver operating characteristic
- SEM
standard error of the mean
- SUITO
secretory unit of islet transplant objects
- WHO
World Health Organization
Introduction
Islet transplantation (ITx) is indicated in patients with type 1 diabetes and frequent severe hypoglycemia 1, 2, 3, 4, 5. ITx can achieve short‐term insulin independence in almost all cases, and it is recognized that the islet mass transplanted and primary graft function after transplantation are important for long‐term islet graft success 6, 7. Despite improving results, insulin independence rates (approaching 50% at 5 years) fall short of a cure for type 1 diabetes 2, 6, 8.
There is growing consensus that the success of ITx should not be defined by the presence or absence of insulin independence but rather by maintenance of stable glycemic control and protection from severe hypoglycemia 2, 4, 9. This protection can be maintained with relatively low levels of endogenous insulin production compared with the degree of graft function required for insulin independence 1, 10. Patients without residual graft function (C‐peptide negative) are at high risk for recurrent severe hypoglycemia (Collaborative Islet Transplant Registry data 6); therefore, graft function after transplant should be thought of as a continuum.
Assessment of graft function, like the assessment of beta cell mass in diabetes 11, 12, is complex. The most precise tools rely on complex metabolic tests measuring insulin secretion in response to various stimuli 1, 13, 14, 15, and they are time consuming, expensive and likely to be used only in a research setting. Because they cannot be performed routinely on a frequent basis, it is hard to accurately track changes in graft function over time.
The use of simple estimates of beta cell mass in ITx recipients based on fasting glucose and C‐peptide levels (e.g. C‐peptide:glucose ratio 16, secretory unit of islet transplant objects [SUITO] index 17) may be confounded by the use of exogenous insulin or poor glycemia. The best validated tool currently is the beta score 18. This tool integrates fasting glucose and a stimulated C‐peptide level 90 min after a mixed‐meal tolerance test (MMTT) with hemoglobin A1c (HbA1c) and use of insulin or glucose‐lowering therapies.
Each component of the score is assigned a categorical score of 0, 1, or 2 (Table S1), with a maximum score of 8 representing excellent graft function and a score of 0 representing no residual graft function. The score has been independently validated using continuous glucose‐monitoring systems, with scores ≥7 required to maintain euglycemia, but protection from severe hypoglycemia by ITx can be achieved with a score ≥3 10.
The categorical nature of the beta score (which reduces the information gained from each individual variable) and the relative infrequency of MMTT testing means that the beta score does not identify subtle early changes in transplant function. The weighting of each variable may not be optimal because changes in treatment can result in spurious improvements in beta score. Deteriorating graft function, for example, treated by adding insulin (−1 point) to reduce fasting plasma glucose (+1 or +2 points) and HbA1c (+1 point) would yield an improved, although spurious, beta score.
Stimulated C‐peptide is a widely used measure of endogenous beta cell function in both ITx and immunotherapy trials in type 1 diabetes 19, 20, but fasting C‐peptide correlates very well with stimulated measures 18, 20. Fasting C‐peptide can be tested frequently and at lower cost than following an MMTT.
Because the natural history of the progressive decline in graft function seen in many islet recipients over time is poorly understood, we sought to develop and validate a simple clinical tool to assess beta cell function using a single fasting blood sample factoring in the dose of insulin required per day and the patient's body weight. Such a score in which each variable is expressed continuously may more accurately describe the spectrum of islet graft function and be more sensitive to detect changes in graft function over time. This could be used to assess graft function at regular outpatient visits and not just at 6‐ to 12‐mo intervals, with benefits in cost savings and ease and convenience for the patient.
Research Design and Methods
Derivation cohort
Overall, 57 participants with type 1 diabetes and normal renal function from the originally described Edmonton cohort transplanted before the year 2005 (data shown as mean plus or minus standard error of the mean [SEM]; age 42.1 ± 1.3 years, duration of diabetes 26.1 ± 11.3 years) had 183 MMTTs after transplant at 3, 6, 12, 18, and 24 mo and then yearly up to 5 years 18. The induction agents and maintenance immunosuppression are shown (Table S2).
In this original cohort, participants underwent intravenous glucose tolerance and intravenous arginine tests (79 and 39 tests, respectively) at the above time points, and the acute insulin responses (AIRs) to glucose and arginine, respectively, were derived.
The AIRs to glucose and arginine have been shown to be highly predictive of beta cell secretory capacity and can provide estimates of functional islet beta cell mass in ITx recipients 21. AIRs to glucose and arginine were calculated, as described previously 1.
A composite BETA‐2 score was derived based on a single fasting blood sample and insulin use standardized to body weight (units per kilogram of body weight). Insulin dose, HbA1c, and fasting C‐peptide and glucose were individually fitted to the 90‐min glucose level following a standard MMTT (360 ml Ensure HP; Abbott Laboratories, Saint‐Laurent, Québec, Canada) using appropriate transformations, as detailed in the statistical methods, before being combined in a total score. The association between the BETA‐2 score and other engraftment indices was examined.
Although glucose tolerance is defined by the 75‐g oral glucose tolerance test (OGTT), MMTTs are performed more commonly after ITx. In our primary analysis, the BETA‐2 score was derived and best detected abnormal glucose tolerance during the MMTT, with maximum sensitivity and specificity (described under Statistical analyses). We defined abnormal glucose tolerance as a 90‐min MMTT glucose level ≥8 mmol/L, based on a previous study of ITx recipients undergoing simultaneous 75‐g OGTTs and MMTTs 22. In this study, the 90‐min MMTT glucose level ≥8 mmol/L was superior to the fasting glucose level derived from the MMTT for diagnosing diabetes (World Health Organization [WHO] criteria: after 75‐g OGTT, fasting plasma glucose level ≥7 mmol/L or 2‐h glucose level ≥11.1 mmol/L) with sensitivity and specificity of 91% and 87.5%, respectively 22. The finding is consistent with other studies examining ITx recipients. A longitudinal study comparing recipients who remained insulin independent over an 18‐mo period with those who recommenced insulin found that 90‐min MMTT glucose was an earlier marker of graft dysfunction than fasting plasma glucose, reflecting loss of first‐phase insulin secretion 23. Studies comparing MMTTs with OGTTs in patients with a range of glucose intolerance demonstrated ≈30% lower glucose excursions with MMTTs at equivalent time points following caloric ingestion, again consistent with our data 24, 25. We reasoned that because this level of glucose intolerance is associated with morbidity and mortality 26, 27, 28, intervention with exogenous insulin may be initiated, reinforcing this as a clinically relevant outcome variable.
Independence from exogenous insulin (with HbA1c <6.5%) is important clinically; therefore, we also examined the BETA‐2 and beta scores in relation to this clinical outcome (described under Statistical analyses).
Validation cohort
To validate the BETA‐2 score, we used retrospective data from MMTTs performed at 12 mo (8 ± 0.5 mo after last infusion) in a group of ITx recipients receiving their first ITx after the year 2006, selected to represent a broad spectrum of graft function (n = 114; 109 ITx‐alone and five islet‐after‐kidney recipients, all with normal renal function; mean age 49.0 ± 0.9 years and duration of diabetes 31.5 ± 1.0 years). Table S2 shows induction agents and maintenance immunosuppression.
Scores were not calculated for participants using exogenous insulin whose fasting plasma glucose values were ≤3.5 mmol/L because of the anticipated suppression of C‐peptide production 18.
Case study following ITx
Data from a man aged 25 years with type 1 diabetes since age 12 years who received two islet infusions (478 851 islet‐equivalent units [IE] = 6031 IE/kg and 364 601 IE = 5043 IE/kg) 11 months apart are presented to demonstrate and compare the utility of the BETA‐2 score with the beta score. MMTTs were performed 4 weeks after each islet infusion.
Following the initial transplant, the patient's insulin requirements fell to ≈40% of baseline but increased steadily, and he was noted to be C‐peptide negative at day 75 after the first transplant. A second transplant 11 mo later led to a substantial reduction in insulin requirements initially but was not maintained, and graft function was lost within 2 mo after the second transplant.
Metabolic studies
The methods for the metabolic studies (MMTT, intravenous glucose tolerance test, arginine stimulation test) have been described previously 2, 18. Body weight and insulin use (average insulin dose per day over the previous 7 days divided by body weight in kilograms) were extracted from medical records.
Biochemical assays were measured in duplicate. Plasma glucose concentrations were determined by the glucose oxidation method. C‐peptide concentrations were measured using commercial kits (Roche Elecsys; Roche Diagnostics, Indianapolis, IN; lower limit of sensitivity of the C‐peptide assay was 0.1 nmol/L before 2005 18 and 0.02 nmol/L after 2005; assay equivalence confirmed, Pearson R2 = 0.99).
Ethics approval
Participants provided written informed consent, and the study was approved by the University of Alberta Health Research Ethics Board and conducted in accordance with the principles endorsed by the Declaration of Helsinki.
Statistical analyses and validation of BETA‐2 score
Statistical analyses were performed using Stata version 12 (StataCorp, College Station, TX). Descriptive statistics are expressed as mean ± SEM and median (interquartile range [IQR]) as appropriate. Data were tested for normality, and Pearson or Spearman rank correlation coefficients were determined, as appropriate.
A composite BETA‐2 score was derived from the original cohort of participants in Edmonton and was based on the following independent variables: fasting plasma glucose, fasting C‐peptide values, HbA1c (percentage) and insulin use. Univariate regression analyses of each of these variables with stimulated glucose 1 was performed, and transformations were applied as appropriate to normalize the residuals, followed by stepwise forward multiple linear regression analyses 18. In the derivation cohort, receiver operating characteristic (ROC) curves were constructed for participants' BETA‐2 scores based (i) on the 90‐min MMTT glucose level ≥8 mmol/L (which has been shown to correlate closely with a diagnosis of diabetes [WHO criteria] during the OGTT 22) and (ii) on insulin independence with HbA1c <6.5%, and then the discrimination and predictive accuracy of the score was determined.
The score that best detected these outcome variables with maximum sensitivity and specificity was derived 29.
In the validation cohort, ROC curves were constructed for participants' BETA‐2 and beta scores based on the 90‐min MMTT glucose level ≥8 mmol/L and insulin independence with HbA1c <6.5%. The area under the ROC (AUROC) curves were compared to determine whether the BETA‐2 score detected the outcome variables with greater discrimination than the beta score. Statistical significance was set at 5%.
Results
In the derivation cohort, a total of 183 of the 187 MMTTs were eligible for analysis 18. Four MMTTs were excluded because fasting plasma glucose concentrations were <3.5 mmol/L. Overall, 70 of the 183 MMTTs were associated with insulin use (38% MMTTs; 33 participants), and 69% (n = 126) of MMTTs had 90‐min glucose levels ≥8 mmol/L.
In the validation study, no participants were excluded because of hypoglycemia prior to meal testing. Moreover, 76 of 114 participants (66%) had 90‐min glucose levels ≥8 mmol/L, and 72 of 114 participants (63%) were using exogenous insulin.
Formulation of BETA‐2 score in the derivation cohort
The metabolic variables fasting plasma glucose (in millimoles per liter), HbA1c (as a percentage), fasting C‐peptide (in nanomoles per liter) and insulin dose (units per kilogram of body weight) from the original cohort study with 183 complete MMTTs were examined.
Median fasting plasma glucose was 6.4 mmol/L (IQR 5.7–7.9 mmol/L), HbA1c was 6.1% (IQR 5.7–6.6%; median 43 mmol/mol [IQR 39–49 mmol/mol]), and stimulated glucose was 10.2 mmol/L (IQR 7.3–13.4 mmol/L). Fasting plasma glucose and HbA1c were independently associated with the 90‐min glucose level after MMTT (p < 0.0001) (Figure S1).
Stimulated and fasting C‐peptide concentrations were closely associated: 1.28 nmol/L (IQR 0.88–1.74 nmol/L) and 0.61 nmol/L (IQR 0.39–0.88 nmol/L), respectively (r = 0.78, p < 0.001). In nine MMTTs, neither the stimulated nor the corresponding fasting C‐peptide concentrations were detected. In nine MMTTs, stimulated C‐peptide concentrations were detected, but fasting C‐peptide concentrations were below the level of assay detection (0.1 nmol/L). Fasting C‐peptide concentrations transformed using a square root function demonstrated the closest association with graft function (p < 0.0001) (Figure S1).
The range of insulin doses taken by participants was 0–0.91 U/kg per day. The insulin dose subtracted from unity demonstrated the closest association with the 90‐min glucose level after MMTT (p < 0.0001) (Figure S1).
The BETA‐2 score was generated as follows:
Multiplication by 1000 converted the score to a range from 0 to 42 in the derivation cohort.
BETA‐2 score and islet engraftment
The BETA‐2 score was associated with the 90‐min glucose level after MMTT, the beta score and the AIR after intravenous glucose and arginine (all p < 0.0001) (Figure 1). The relationship between the beta score intervals (beta score 0–2, 3–4, 5–6 and 7–8) and the BETA‐2 score were closely associated (r = 0.99; p < 0.001) (Figure 2).
Figure 1.
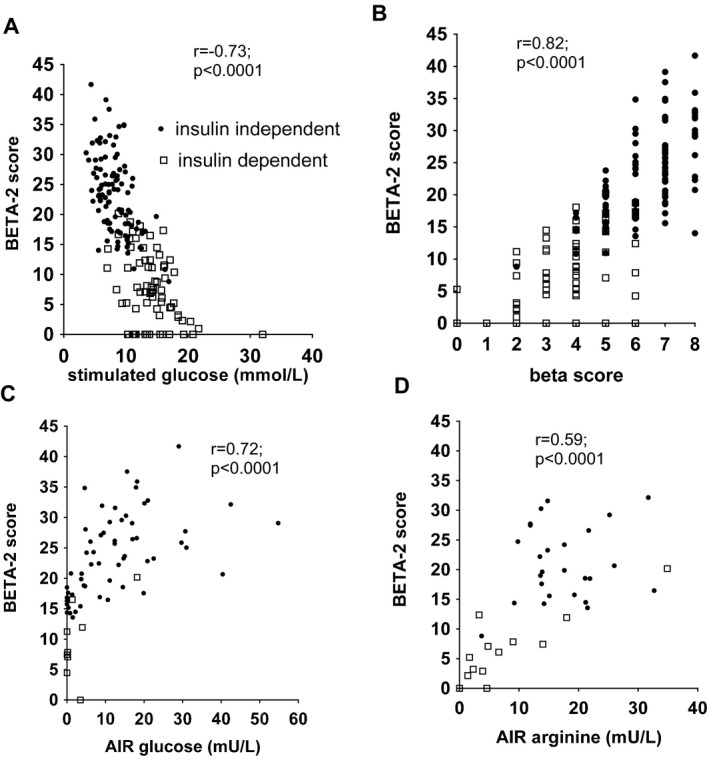
Relationship between BETA ‐2 score and indices of graft function. Relationship between BETA‐2 score and indices of graft function: (A) stimulated glucose, (B) beta score and acute insulin response (C) to glucose and (D) to arginine were highly statistically significant (all p < 0.01). AIR, acute insulin response.
Figure 2.
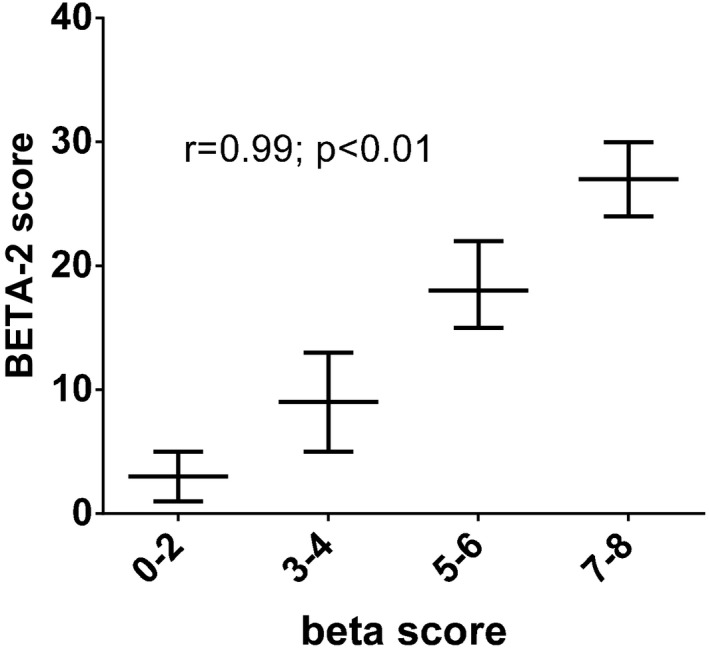
Relationship between beta score intervals and the BETA ‐2 score in the derivation cohort. The relationship between the beta score intervals and the BETA‐2 score were closely associated in the derivation cohort as demonstrated (r = 0.99; p < 0.01), with similar values in the validation cohort (data not shown). Data are shown as median (interquartile range).
BETA‐2 score and detection of 90‐min MMTT glucose level ≥8 mmol/L and insulin independence (HbA1c <6.5%) after ITx
The BETA‐2 score in participants with 90‐min MMTT glucose levels ≥8 mmol/L was two times lower than in their counterparts (13 [IQR 5–18] vs. 26 [IQR 22–29]; p < 0.001).
The BETA‐2 score in insulin‐dependent participants was lower than in insulin‐independent (HbA1c <6.5%) participants (7 [IQR 2–12] vs. 23 [IQR 18–27]; p < 0.001). This was also the case when only participants with HbA1c <6.5% were analyzed: BETA‐2 scores were 9 (IQR 5–14) versus 25 (IQR 20–29) (p < 0.001; 19% and 48% of MMTTs, respectively, in the derivation cohort).
The AUROC curve analyses demonstrated excellent discrimination between MMTT glucose level ≥8 versus <8 mmol/L and insulin independence versus dependence (AUROC 86 ± 2% and 96 ± 1%, respectively; all p < 0.001) (Figure 3). A BETA‐2 score <20 had sensitivity of 82% (95% confidence interval [CI] 74–88%) and specificity of 82% (95% CI 70–91%) for detecting a 90‐min MMTT glucose level ≥8 mmol/L after ITx, with a positive predictive value of 91% and a negative predictive value of 68%. A BETA‐2 score ≥15 had sensitivity of 89% (95% CI 82–94%) and specificity of 88% (95% CI 78–94%) with a positive predictive value of 98% and a negative predictive value of 99.5% for predicting insulin independence after ITx.
Figure 3.
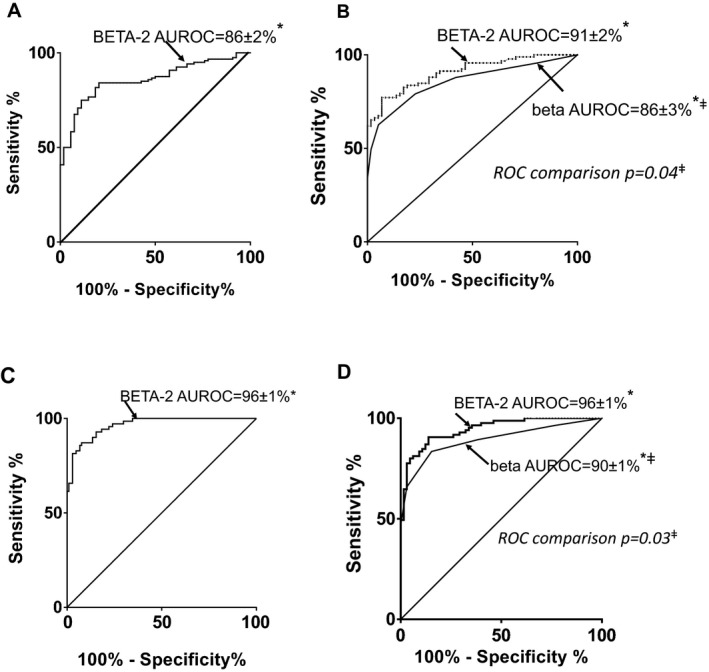
BETA ‐2 score's detection of 90‐min MMTT glucose level ≥8 mmol/L and insulin independence following islet transplantation in derivation and validation cohorts. (A) Participants in the original Edmonton derivation cohort (n = 58, 183 MMTTs), with 90‐min MMTT glucose levels ≥8 mmol/L (69% of cohort). The AUROC curve was 86 ± 2%, reflecting excellent discrimination (*p < 0.001) between the glycemic groups. A BETA‐2 score <20 detected a 90‐min MMTT glucose level ≥8 mmol/L with sensitivity of 82% (95% CI 74–88%) and specificity of 82% (95% CI 69–91%). (B) BETA‐2 and beta scores for participants (n = 114) in the validation cohort with 90‐min MMTT glucose levels ≥8 mmol/L (66% of cohort) versus <8 mmol/L confirmed the greater accuracy of the BETA‐2 score for detecting 90‐min MMTT glucose levels ≥8 mmol/L (ROC comparison; ‡p = 0.04). (C) Participants in the derivation cohort were segregated by insulin independence with HbA1c <6.5% (56% of cohort) versus insulin dependence. The AUROC curve was 96.4 ± 1.1%, reflecting excellent discrimination (*p < 0.001) between the groups. A BETA‐2 score ≥15 predicted insulin independence with sensitivity of 89% (95% CI 82–94%) and specificity of 88% (95% CI 78–94%). (D) BETA‐2 and beta scores for participants (n = 114) in the validation cohort with insulin independence (HbA1c <6.5%; 37% of cohort) versus insulin‐dependent participants confirmed greater accuracy of the BETA‐2 score for detecting insulin independence (ROC comparison; ‡p = 0.03). AUROC curve, area under the receiver operator characteristic curve; CI, confidence interval; MMTT, mixed‐meal tolerance test; ROC, receiver operator characteristic.
Validation of BETA‐2 score in separate cohort
In total, 112 participants in the validation cohort had measurable stimulated and fasting C‐peptide concentrations (1.18 nmol/L [IQR 0.59–1.77 nmol/L] and 0.53 nmol/L [IQR 0.24–0.76 nmol/L], respectively), whereas two participants had nondetectable concentrations for both stimulated and fasting C‐peptide. Fasting plasma glucose was 6.8 mmol/L (IQR 5.8–9.2 mmol/L), HbA1c was 6.5% (IQR 6.0–7.2%; 48 mmol/mol [IQR 42–54 mmol/mol]), stimulated glucose was 10.4 mmol/L (IQR 7.0–15.9 mmol/L), and the insulin dose range was 0–0.64 U/kg per day.
The BETA‐2 score demonstrated a range similar to the derivation cohort (IQR 0–38) with approximately threefold lower scores in participants with a 90‐min MMTT glucose level ≥8 vs. <8 mmol/L after ITx (8 [IQR 3–13] vs. 24 [IQR 19–28]; insulin‐dependent vs. ‐independent participants: 7 [IQR 3–12] vs. 25 [IQR 20–28]; all p < 0.0001). The BETA‐2 scores in insulin‐independent (HbA1c <6.5%) participants were significantly greater than in those on insulin with HbA1c <6.5% (26 [IQR 22–28] vs. 12 [IQR 9–17]; p < 0.0001).
A 90‐min MMTT glucose level ≥8 mmol/L and insulin independence were better discriminated with the BETA‐2 score than the beta score (AUROC for 90‐min MMTT glucose level ≥8 mmol/L was 91 ± 2% vs. 86 ± 3% and for insulin independence was 96 ± 1% vs. 90 ± 1%; ROC comparison of BETA‐2 vs. beta score, p = 0.04 and p = 0.03, respectively) (Figure 3).
The BETA‐2 score showed a better ability to discriminate between participants' 90‐min MMTT glucose levels ≥8 versus <8 mmol/L and insulin independence: The number of participants with nondiscriminating scores was significantly lower for the BETA‐2 score than for the beta score (55 vs. 89 and 61 vs. 72 participants had overlapping scores in the two groups; both p < 0.0001) (Figure 4).
Figure 4.
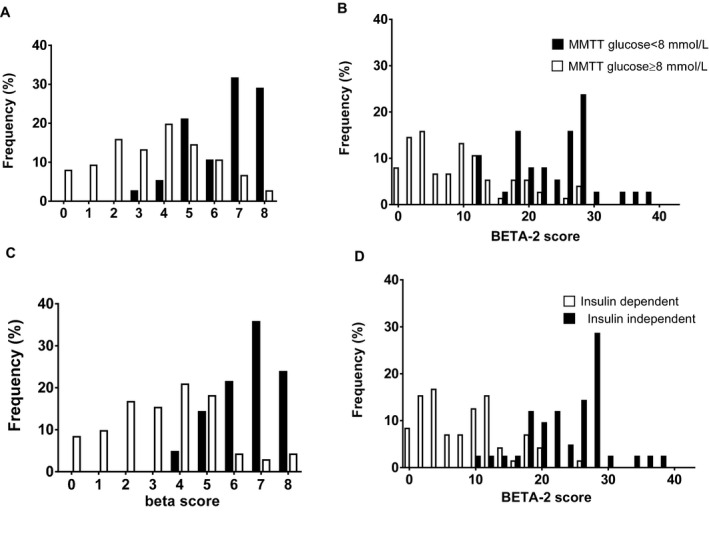
Frequency of beta and BETA ‐2 scores according to 90‐min MMTT glucose level ≥8 mmol/L and insulin independence. Frequency of beta and BETA‐2 scores in islet transplant recipients is demonstrated according to 90‐min MMTT glucose level ≥8 or <8 mmol/L (A and B) and insulin dependence versus independence (C and D) in the validation cohort. The BETA‐2 scores demonstrated greater resolution than the beta scores (p < 0.001). MMTT, mixed‐meal tolerance test.
Illustration of clinical utility of the BETA‐2 score
In the case study, the participant underwent two ITxs (Figure 5). Following the first ITx, the BETA‐2 score indicated deteriorating graft function beginning on day 15, whereas the beta score could not be calculated until the MMTT at 4 weeks. Immediately following the second transplant, there was a rapid decline in the BETA‐2 score, which was close to 0 by the time of the MMTT at 4 weeks after transplant. The beta score was 3 on both occasions.
Figure 5.
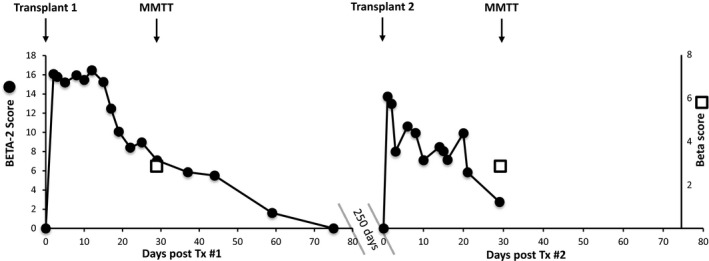
Example of beta versus BETA ‐2 scores in a participant after islet transplantation. The beta score and the BETA‐2 score were demonstrated for a participant with type 1 diabetes receiving two islet infusions 11 mo apart. MMTTs were performed 1 mo following each transplant. Fasting blood samples were measured frequently, allowing frequent calculation of the BETA‐2 score, whereas the participant could attend MMTTs only infrequently; therefore, the beta score was calculated for the first time at 4 weeks after transplant. MMTT, mixed meal tolerance test.
Discussion
The BETA‐2 score derived from fasting C‐peptide, fasting plasma glucose, HbA1c and insulin dose expressed as continuous variables, is an improved measure of beta cell function following ITx and may be determined from a single fasting blood sample and basic clinical measures. Importantly, because of the maximum use of information from constituent variables, the score shows superiority to the originally described beta score in its assessment of graft function 18. In our primary analysis, a BETA‐2 score <20 demonstrates excellent discrimination between those with poor graft function who may require intensification of treatment with additional islet infusions or exogenous insulin therapy versus those with superior graft function who do not require such intervention, with high sensitivity and specificity. Similarly a BETA‐2 score ≥15 discriminates between those who are insulin independent (HbA1c <6.5%) and those on or requiring insulin. We further demonstrated proof of principle of the BETA‐2 score's ability to track graft function following ITx.
We tested the performance of the BETA‐2 score to predict both glucose intolerance (90‐min MMTT glucose level <8 mmol/L) and insulin independence with HbA1c <6.5%. This approach is more robust than testing only for prediction of insulin independence because insulin use is included in both predictor and outcome variables. Although the OGTT is the gold standard to detect glucose intolerance, we had not performed OGTTs systematically in either the derivation or validation cohorts.
Because the BETA‐2 score uses a single fasting blood sample, it is cheaper and easier to measure than the beta score. In a recent review, the MMTT with basal and stimulated samples cost approximately twice as much as scoring systems that relied on fasting metabolites alone 30, 31. The ability to perform more frequent assessments of graft function over time is another advantage that may result in a greater likelihood of graft dysfunction being detected with the potential to intervene.
Notably, when the original beta score study was published in 2005 18, the level of detection of C‐peptide concentrations was 0.1 nmol/L, whereas more sensitive assays were used in the validation study. This may explain why nine participants in the derivation cohort had detectable C‐peptide only after MMTT. In contrast, the 112 participants in the validation cohort who had detectable C‐peptide had it detected in both the fasting and stimulated states. Given the wide use of sensitive C‐peptide assays 2, it is unlikely that failure to detect fasting C‐peptide will prevent calculation of the BETA‐2 score in patients with functioning islet grafts. It is important to interpret C‐peptide in the context of blood glucose concentrations. The BETA‐2 score should not be calculated if the patient is hypoglycemic because this would erroneously suggest no graft function when, in fact, C‐peptide is merely suppressed by exogenous insulin.
Our study includes the largest number of participants in an islet function scoring system study published to date 30, 31. The other notable strength of the study is the heterogeneity of the participants, including ITx‐alone and islet‐after‐kidney recipients who received a variety of induction agents and maintenance immunotherapy 6, 7, 32, 33, 34 and who represented a broad spectrum of graft function.
The close correlation of the BETA‐2 score with other measures of graft function including the AIRs to glucose and arginine 18 and with the beta score further corroborates the robustness of the scoring system.
Use of insulin is associated with graft dysfunction and lower beta scores 18. A relative contraindication to ITx is insulin resistance with pretransplant insulin requirements ≥0.9 U/kg of body weight. Our formula included insulin subtracted from unity and may not be extrapolated to situations in which the insulin dose is >1 U/kg; this may be breached in auto‐ITx and if indications for cell transplant therapy are expanded to include higher insulin users in the future. In these scenarios, further validation studies will be necessary.
The utility of any scoring system depends on its ability to detect clinically relevant scenarios. A beta score ≥3 is associated with protection from hypoglycemia, ≥5 indicates improved glycemic control and ≥7 indicates normalized glycemic control and insulin independence 10. Similarly, a SUITO index ≥26 can predict insulin independence with a positive predictive value of 84% and a negative predictive value of 89%, with values ≤10 representing poor graft function and intermediate values indicative of partial graft function 17. We confirmed that a BETA‐2 score <20 detects glucose intolerance (90‐min MMTT glucose level ≥8 mmol/L) with sensitivity and specificity of 82%. Importantly, the BETA‐2 score showed superiority over the beta score for the detection of glucose intolerance, with greater dispersion of the BETA‐2 scores versus the beta scores reflecting better discrimination of poor versus good graft function. Given that the BETA‐2 score is an improved iteration of the original score but uses all continuous data from the variables, it is highly likely that the BETA‐2 score will relate at least as well to hypoglycemia and continuous glucose‐monitoring measures, but this should be formally confirmed.
The BETA‐2 score may be more sensitive to small changes in graft function compared with the beta score because it is based on continuous variables, and we showed in the case study that graft function may be followed more frequently and thus more closely compared with the beta score with graft dysfunction identified earlier. The increased discriminative power of the BETA‐2 score compared with the beta score in ROC analysis, despite the wider spread of BETA‐2 scores, emphasizes that it may reflect graft function with more resolution.
A disadvantage of the BETA‐2 score is the somewhat complicated calculation required compared with many other scores 18; however, once the BETA‐2 formula has been entered into a simple spreadsheet, the calculation may be iterated rapidly. The score has already been integrated into our local clinical database with ease, and we have developed a BETA‐2 score Web‐based calculator (https://sites.google.com/a/islet.ca/beta-2/). Calculation of the original beta score, which required the categorization of four continuous variables, can be laborious.
In addition, the BETA‐2 score requires information on insulin use and weight that is not required for other scores, including SUITO 17, and C‐peptide:glucose ratio 16, 31, which has been used (although generally not validated) in ITx. We believe that including insulin use is necessary to assess beta cell function in groups containing both insulin‐independent and ‐dependent participants. The inclusion of HbA1c avoids the potential bias that could result if insulin were withheld to maintain “insulin independence” but with hyperglycemia.
The BETA‐2 score, unlike the beta score, does not consider the use of oral hypoglycemic agents or noninsulin antihyperglycemic agents. Although insulin was preferred previously because of adverse effects of antihyperglycemics (side effects, metabolic burnout, potential drug interactions [unpublished observations]), newer therapies (dipeptidyl peptidase 4 inhibitors) are well tolerated 35. The use of antidiabetic drugs may serve to either increase or decrease the BETA‐2 score, although it is difficult to predict the magnitude of change. Further studies are needed to validate the score in these circumstances.
Although developed and validated in ITx as a tool to estimate graft function and to predict insulin independence, the BETA‐2 score has a number of potential applications as an intermediate or surrogate outcome in ITx (e.g. in clinical trials testing new strategies to enhance engraftment and comparing strategies to prevent graft loss) and may be used potentially in beta cell replacement from emerging cell sources and pancreas transplantation. It may also find utility beyond ITx for situations in which regular monitoring of beta cell function is required, perhaps in trials of beta cell preservation in new onset type 1 diabetes.
In summary, the BETA‐2 score is a unique validated composite score of beta cell function that incorporates the continuous variables glucose, C‐peptide, HbA1c and insulin dose and that correlates strongly with other validated measures of graft function. The score has the advantage of being highly discriminatory, uses fasting variables only and performs better at detecting abnormal glucose tolerance and insulin independence following ITx than the original beta score. We demonstrated the clinical applicability of this scoring system in tracking islet engraftment over time, including its utility for the early detection of graft dysfunction. Further longitudinal studies may focus on its utility for predicting graft failure.
Author Contributions
S.F., P.S., and R.O. drafted the manuscript and analyzed and interpreted the data. S.I. and S.F. researched the data. All authors contributed to revision of the article and approved the final version of the article. P.S. is guarantor of the data. We thank the staff of the Clinical Islet Transplant Program at the University of Alberta/Alberta Health Services.
Disclosure
The authors of this manuscript have no conflicts of interest to disclose as described by the American Journal of Transplantation.
Supporting information
Figure S1: Relationship between stimulated glucose and components of the BETA‐2 score.
Table S1: Components of the beta score.
Table S2: Induction and immunosuppression agents used in participants.
Acknowledgments
The Clinical Islet Transplant Program receives funding from Juvenile Diabetes Foundation International, Alberta Innovates Health Solutions, National Institutes for Health. Some of this data was presented at Diabetes UK 2014 and the International Pancreas and Islet Transplantation Association meeting 2015.
Forbes S, Oram RA, Smith A, Lam A, Olateju T, Imes S, Malcolm AJ, Shapiro AMJ, Senior PA. Validation of the BETA‐2 Score: An Improved Tool to Estimate Beta Cell Function After Clinical Islet Transplantation Using a Single Fasting Blood Sample. Am J Transplant 2016; 16: 2704–2713
[The copyright line for this article was changed after original online publication on April 21, 2016]
References
- 1. Ryan EA, Lakey JR, Paty BW, et al. Successful islet transplantation: Continued insulin reserve provides long‐term glycemic control. Diabetes 2002; 51: 2148–2157. [DOI] [PubMed] [Google Scholar]
- 2. Brooks AM, Walker N, Aldibbiat A, et al. Attainment of metabolic goals in the integrated UK islet transplant program with locally isolated and transported preparations. Am J Transplant 2013; 13: 3236–3243. [DOI] [PubMed] [Google Scholar]
- 3. Shapiro AM, Lakey JR, Ryan EA, et al. Islet transplantation in seven patients with type 1 diabetes mellitus using a glucocorticoid‐free immunosuppressive regimen. N Engl J Med 2000; 343: 230–238. [DOI] [PubMed] [Google Scholar]
- 4. Forbes S, McGowan NW, Duncan K, et al. Islet transplantation from a nationally funded UK centre reaches socially deprived groups and improves metabolic outcomes. Diabetologia 2015; 58: 1300–1308. [DOI] [PMC free article] [PubMed] [Google Scholar]
- 5. NICE . Allogeneic pancreatic islet cell transplantation for type 1 diabetes mellitus. 2008. [cited 2016 Apr 12]. Available from: http://publications.nice.org.uk/allogeneic-pancreatic-islet-celltransplantation-for-type-1-diabetes-mellitus-ipg257. NICE interventional procedure guidance [IPG257].
- 6. Barton FB, Rickels MR, Alejandro R, et al. Improvement in outcomes of clinical islet transplantation: 1999‐2010. Diabetes Care 2012; 35: 1436–1445. [DOI] [PMC free article] [PubMed] [Google Scholar]
- 7. Rickels MR, Liu C, Shlansky‐Goldberg RD, et al. Improvement in beta‐cell secretory capacity after human islet transplantation according to the CIT07 protocol. Diabetes 2013; 62: 2890–2897. [DOI] [PMC free article] [PubMed] [Google Scholar]
- 8. Vantyghem MC, Kerr‐Conte J, Arnalsteen L, et al. Primary graft function, metabolic control, and graft survival after islet transplantation. Diabetes Care 2009; 32: 1473–1478. [DOI] [PMC free article] [PubMed] [Google Scholar]
- 9. Leitao CB, Tharavanij T, Cure P, et al. Restoration of hypoglycemia awareness after islet transplantation. Diabetes Care 2008; 31: 2113–2115. [DOI] [PMC free article] [PubMed] [Google Scholar]
- 10. Vantyghem MC, Raverdy V, Balavoine AS, et al. Continuous glucose monitoring after islet transplantation in type 1 diabetes: An excellent graft function (beta‐score greater than 7) Is required to abrogate hyperglycemia, whereas a minimal function is necessary to suppress severe hypoglycemia (beta‐score greater than 3). J Clin Endocrinol Metab 2012; 97: E2078–E2083. [DOI] [PMC free article] [PubMed] [Google Scholar]
- 11. Robertson RP, Raymond RH, Lee DS, et al. Arginine is preferred to glucagon for stimulation testing of beta‐cell function. Am J Physiol 2014; 307: E720–E727. [DOI] [PMC free article] [PubMed] [Google Scholar]
- 12. Ferrannini E, Gastaldelli A, Miyazaki Y, Matsuda M, Mari A, DeFronzo RA. Beta‐cell function in subjects spanning the range from normal glucose tolerance to overt diabetes: A new analysis. J Clin Endocrinol Metab 2005; 90: 493–500. [DOI] [PubMed] [Google Scholar]
- 13. Robertson RP, Bogachus LD, Oseid E, et al. Assessment of beta‐cell mass and alpha‐ and beta‐cell survival and function by arginine stimulation in human autologous islet recipients. Diabetes 2015; 64: 565–572. [DOI] [PMC free article] [PubMed] [Google Scholar]
- 14. Ryan EA, Lakey JR, Rajotte RV, et al. Clinical outcomes and insulin secretion after islet transplantation with the Edmonton protocol. Diabetes 2001; 50: 710–719. [DOI] [PubMed] [Google Scholar]
- 15. Marcelli‐Tourvieille S, Hubert T, Pattou F, Vantyghem MC. Acute insulin response (AIR): Review of protocols and clinical interest in islet transplantation. Diabetes Metab 2006; 32: 295–303. [DOI] [PubMed] [Google Scholar]
- 16. Faradji RN, Monroy K, Messinger S, et al. Simple measures to monitor beta‐cell mass and assess islet graft dysfunction. Am J Transplant 2007; 7: 303–308. [DOI] [PubMed] [Google Scholar]
- 17. Matsumoto S, Noguchi H, Takita M, et al. Excellence of suito index for assessing clinical outcome of islet transplantation. Transplant Proc 2010; 42: 2062–2064. [DOI] [PubMed] [Google Scholar]
- 18. Ryan EA, Paty BW, Senior PA, Lakey JR, Bigam D, Shapiro AM. Beta‐score: An assessment of beta‐cell function after islet transplantation. Diabetes Care 2005; 28: 343–347. [DOI] [PubMed] [Google Scholar]
- 19. Palmer JP, Fleming GA, Greenbaum CJ, et al. C‐peptide is the appropriate outcome measure for type 1 diabetes clinical trials to preserve beta‐cell function: Report of an ADA workshop, 21‐22 October 2001. Diabetes 2004; 53: 250–264. [DOI] [PubMed] [Google Scholar]
- 20. Greenbaum CJ, Mandrup‐Poulsen T, McGee PF, et al. Mixed‐meal tolerance test versus glucagon stimulation test for the assessment of beta‐cell function in therapeutic trials in type 1 diabetes. Diabetes Care 2008; 31: 1966–1971. [DOI] [PMC free article] [PubMed] [Google Scholar]
- 21. Rickels MR, Naji A, Teff KL. Acute insulin responses to glucose and arginine as predictors of beta‐cell secretory capacity in human islet transplantation. Transplantation 2007; 84: 1357–1360. [DOI] [PubMed] [Google Scholar]
- 22. Koh A, Imes S, Dinyari P, Malcolm A, Shapiro AMJ, Senior PA. Mixed meal tolerance test (MMTT) vs. oral glucose tolerance test (OGTT) after successful clinical islet transplantation (CIT). Diabetes 2014; 58 (Supp 1): 1955. [DOI] [PubMed] [Google Scholar]
- 23. Baidal DA, Faradji RN, Messinger S, et al. Early metabolic markers of islet allograft dysfunction. Transplantation 2009; 87: 689–697. [DOI] [PMC free article] [PubMed] [Google Scholar]
- 24. Meier JJ, Baller B, Menge BA, Gallwitz B, Schmidt WE, Nauck MA. Excess glycaemic excursions after an oral glucose tolerance test compared with a mixed meal challenge and self‐measured home glucose profiles: Is the OGTT a valid predictor of postprandial hyperglycaemia and vice versa? Diabetes Obes Metab 2009; 11: 213–222. [DOI] [PubMed] [Google Scholar]
- 25. Vasir B, Aiello LP, Yoon KH, Quickel RR, Bonner‐Weir S, Weir GC. Hypoxia induces vascular endothelial growth factor gene and protein expression in cultured rat islet cells. Diabetes 1998; 47: 1894–1903. [DOI] [PubMed] [Google Scholar]
- 26. Bonner‐Weir S. Morphological evidence for pancreatic polarity of beta‐cell within islets of Langerhans. Diabetes 1988; 37: 616–621. [DOI] [PubMed] [Google Scholar]
- 27. Bonner‐Weir S, Sullivan BA, Weir GC. Human islet morphology revisited: Human and rodent islets are not so different after all. J Histochem Cytochem 2015; 63: 604–612. [DOI] [PMC free article] [PubMed] [Google Scholar]
- 28. Olsson R, Carlsson PO. Oxygenation of cultured pancreatic islets. Adv Exp Med Biol 2006; 578: 263–268. [DOI] [PubMed] [Google Scholar]
- 29. Florkowski CM. Sensitivity, specificity, receiver‐operating characteristic (ROC) curves and likelihood ratios: Communicating the performance of diagnostic tests. Clin Biochem Rev 2008; 29(Suppl 1): S83–S87. [PMC free article] [PubMed] [Google Scholar]
- 30. Caumo A, Maffi P, Nano R, et al. Comparative evaluation of simple indices of graft function after islet transplantation. Transplantation 2011; 92: 815–821. [DOI] [PubMed] [Google Scholar]
- 31. Caumo A, Maffi P, Nano R, et al. Transplant estimated function: A simple index to evaluate beta‐cell secretion after islet transplantation. Diabetes Care 2008; 31: 301–305. [DOI] [PubMed] [Google Scholar]
- 32. Kaufman DB, Leventhal JR, Gallon LG, Parker MA. Alemtuzumab induction and prednisone‐free maintenance immunotherapy in simultaneous pancreas‐kidney transplantation comparison with rabbit antithymocyte globulin induction ‐ long‐term results. Am J Transplant 2006; 6: 331–339. [DOI] [PubMed] [Google Scholar]
- 33. Froud T, Baidal DA, Faradji R, et al. Islet transplantation with alemtuzumab induction and calcineurin‐free maintenance immunosuppression results in improved short‐ and long‐term outcomes. Transplantation 2008; 86: 1695–1701. [DOI] [PMC free article] [PubMed] [Google Scholar]
- 34. Larsen JL, Bennett RG, Burkman T, et al. Tacrolimus and sirolimus cause insulin resistance in normal sprague dawley rats. Transplantation 2006; 82: 466–470. [DOI] [PubMed] [Google Scholar]
- 35. Senior P, Koh A, Yau J, et al. Sitagliptin plus pantoprazole can restore but not maintain insulin independence after clinical islet transplantation: Results of a pilot study. Diabetic Med. In press 2016. [DOI] [PubMed] [Google Scholar]
Associated Data
This section collects any data citations, data availability statements, or supplementary materials included in this article.
Supplementary Materials
Figure S1: Relationship between stimulated glucose and components of the BETA‐2 score.
Table S1: Components of the beta score.
Table S2: Induction and immunosuppression agents used in participants.