

Abstract
Combinatorial magnetron sputter deposition from elemental targets was used to create Fe–B composition spread type thin film materials libraries on thermally oxidized 4-in. Si wafers. The materials libraries consisting of wedge-type multilayer thin films were annealed at 500 or 700 °C to transform the multilayers into multiphase alloys. The libraries were characterized by nuclear reaction analysis, Rutherford backscattering, nanoindentation, vibrating sample magnetometry, x-ray diffraction (XRD) and transmission electron microscopy (TEM). Young's modulus and hardness values were related to the annealing parameters, structure and composition of the films. The magnetic properties of the films were improved by annealing in a H2 atmosphere, showing a more than tenfold decrease in the coercive field values in comparison to those of the vacuum-annealed films. The hardness values increased from 8 to 18 GPa when the annealing temperature was increased from 500 to 700 °C. The appearance of Fe2B phases, as revealed by XRD and TEM, had a significant effect on the mechanical properties of the films.
Keywords: combinatorial materials science, multifunctional coatings, Fe–B compounds, magnetic nanocomposites, thin films
Introduction
Multifunctional nanocomposite thin films combining mechanical, protective and other functional properties are of interest for applications as sensors in harsh environments. Usually, thin films used in harsh environments are protected by capping layers, such as amorphous hydrogenated carbon thin films (a-C:H), diamond layers produced by microwave plasma-assisted chemical vapor deposition (CVD) or sputtered Si3N4 thin films [1–4]. An alternative concept is the development of multifunctional coatings combining protective (e.g. wear resistance) and functional (e.g. ferromagnetic) properties in one material. This promises several advantages; for example, the integrity of such a film is improved in comparison to that of capped layer systems because the removal of top layers during operation does not necessarily lead to the loss of functionality. Klever et al investigated ferromagnetic FeCo/TiN multilayers deposited from alloy targets as a model system for the multifunctional multilayer coatings mentioned above [5, 6]. Brunken et al reported high-temperature activation by annealing metallic-precursor multilayer thin films containing FeCo and Ti in N2 atmosphere to form a multiphase nanocomposite as another model system [7]. Furthermore, transition metal borides are of interest as materials for hard, wear-resistant and chemically inert coatings [8–12]. The combination of transition metals and B ensures a high valence-electron density and a pronounced covalent bonding resulting in a high hardness [13]. For example, ReB2 has been reported as the first transition-metal-based material that can scratch diamond [8, 12]. Iron borides have important industrial applications. Homogeneously dispersed secondary-phase particles of Fe2B improve the tensile strength of low-carbon steels [14], and pseudo-binary Fe3(B,C) and Fe23(B,C)6 [15, 16] precipitates harden high-carbon steels [17]. Fe-B-based hard protective coatings are produced directly on the surface of steel by boriding [18–20]. During this thermochemical process, B diffuses into steel forming either a single Fe2B phase or a duplex-phase consisting of Fe2B and FeB phases [19]. Next to their interesting mechanical properties, iron borides show ferromagnetic behavior that can be exploited for sensing applications in harsh environments, as mentioned above. Fe2B and Fe3B show soft magnetic properties and have saturation magnetization values of 1.51 and 1.62 T, respectively [13, 21, 22]. High Curie temperatures of 350, 540 and 720 °C were reported in sputtered FeB, Fe2B and Fe3B thin films, respectively [23, 24].
As Fe–B thin-film compounds have the potential of combining wear resistance and intrinsic magnetic sensor function properties, this work investigates Fe–B thin-film nanocomposites by a combinatorial approach and are discussed as a model system for the aforementioned functionalities. The films were prepared in the form of Fe/B multilayer composition spreads using a combinatorial sputtering system and were annealed after deposition.
Experimental details
Thin film preparation
The Fe/B multilayer materials libraries (MLs) were fabricated in the form of a continuous composition spread, applying a wedge-type multilayer approach [25]. The composition spread was deposited in a combinatorial magnetron sputtering system (DCA, Finland) [26]. The sputtering chamber used in the experiment is equipped with five magnetron sources that are arranged in a circular geometry (angle with respect to the substrate ∼45°) and have the focal point at the center of the substrate. The center-to-center target-to-substrate distance was 187 mm. The base pressure was <5×10⁻⁶ Pa prior to deposition; during deposition, the Ar (6N) pressure was 0.66 Pa. A 4-in. thermally oxidized Si (100) wafer (oxide thickness 1.5 μm) was used as the substrate. Prior to the deposition, the Si wafer was photolithographically structured into 301 square openings (3×3 mm) for lift off. The MLs were sputtered from Fe and B elemental targets (purity 99.99% for both) with a sputter rate of 0.016 and 0.003 nm s−1, respectively. Both targets were pre-sputtered for 30 min to minimize contamination. The individual layer thicknesses were chosen as 5 to 25 nm for the Fe wedge-type layer and 5 nm for the uniform B layer (figure 1). With 40 repetitions, the total nominal thickness varied between 0.4 and 1.2 μm on the MLs. A subsequent lift-off process was used to define the samples on the 4-in. Si wafer. After the deposition, the Fe/B multilayer MLs was diced into 4.5 mm×4.5 mm pieces for subsequent heat treatments and characterization.
Figure 1.

(a) Illustration of thin film architecture. (b) B concentration in as-deposited MLs as a function of the sample position along the compositional gradient over the MLs (indicated by an arrow). Solid symbols represent the NRA results and open symbols correspond to the values calculated from deposition rates.
All MLs were annealed in batches of 10 to 15 samples, at 500 or 700 °C, for 1, 5, 10 or 50 h, in vacuum (base pressure 2.4×10⁻⁷ Pa) or H2 atmosphere (H2 pressure 105 Pa, H2 flow rate 200 cm3 min−1).
Thin film composition and microstructure
Film thickness was measured automatically with a mechanical profilometer (Ambios XP2) using the steps created by the lift-off process. The intended composition variation of the MLs was verified by nuclear reaction analysis (NRA) and Rutherford backscattering spectroscopy (RBS) to quantify the B content. RBS was carried out with a 2 MeV He+ beam (incident angle 7°, scattering angle 160°). With the known solid angle of the detector (1.911sr), the resulting energy spectrum was fitted to deduce the concentrations of Fe and B. Since the B content cannot be accurately quantified by RBS, an additional NRA measurement was applied, using the reaction:
The H-beam energy was 700 keV. The geometry factors were taken into account using a reference sample (26-nm-thick B film on Si/SiO2). As described in [27], the resulting spectrum has a well-resolved α0 peak. Assuming a homogeneous B concentration in the deposited films, the integral of α0 is a measure of the B content.
X-ray diffraction (XRD) measurements were performed with an X'Pert PRO MRD system (Cu Kα radiation, spot size ∼2 mm, 2Θ=30–90°) to characterize the crystalline state and phases present. To further clarify the microstructure of the thin films, transmission electron microscopy (TEM) was carried out using an FEI Tecnai F20 system operating at 200 kV. The TEM samples were prepared by focused ion beam (FIB) milling using a dual-beam FEI Quanta 200 3D station.
Mechanical and magnetic characterization
Nanoindentation measurements (MTS Nanoindenter XP system, Berkovich indenter) were performed to determine the room-temperature hardness and Young's moduli of the MLs thin films. Up to 49 indents (array of 7×7, Δx=Δy=50 μm) per composition were measured to improve statistics. A serpentine positioning of the indents across the samples allowed to eliminate long translations of the motorized stage and reduced associated drift effects. Special care was taken in determining the optimal indentation depth and loading rates to yield accurate data and minimize the substrate influence [28]: the maximum indentation depth was <12.5% of the respective total film thickness. Load–displacement (P–h) curves were recorded using the continuous stiffness method and analyzed for hardness and Young's modulus as described in [29–31]. The strain was applied at a rate of 0.05 s−1. Prior to analysis, the P–h curves were corrected for residual zero-point errors (e.g. sample surface) and thermal drift. A fused quartz sample was used as the reference material to calibrate the indenter area function (projected contact area Ac versus contact depth hc) and determine the machine compliance [32]. Vibrating sample magnetometry (Quantum Design PPMS) was used to record magnetic hysteresis loops and deduce the coercive field Hc and saturation magnetization Ms. All measurements were carried out at room temperature and in the in-plane geometry (direction of the external field in the film plane).
Results
Chemical composition and structural analysis
Figure 1(a) shows a schematic cross section of the studied wedge-type multilayers. The results of NRA measurements from the as-deposited Fe/B MLs and a schematic outline of the 301-sample MLs are shown in figure 1(b). The arrow shows the direction of compositional gradient. The overall B content varies between 18 and 43 at.% in the gradient direction, whereas it is practically constant in the perpendicular direction. Due to the time-consuming measurement and data analysis of NRA, only 6 samples along the compositional gradient were analyzed (red solid squares in figure 1(b). Prior to deposition of the MLs, the deposition rates of Fe and B were calculated by depositing Fe and B films and dividing their measured thicknesses by the sputtering time. Then, we mapped the deposition rates across the MLs and calculated the individual thicknesses of Fe and B layers taking into account the film composition and molar volumes of Fe and B. The open symbols in figure 1(b) indicate values calculated in this way from the nominal thicknesses of the individual layers. The calculated values fit well with the NRA data for the 6 measured samples. The slight nonlinearity of the composition gradient can be explained on the basis of the geometric relation between the exposed target surface relative to the substrate and the typically cosine distribution of material sputtered from the target surface.
Figure 2 shows the XRD patterns measured along the compositional gradient of the Fe/B MLs annealed at 700 °C for (a) 1 h and (b) 50 h; the identified phases are shown as a function of the overall Fe content. For both annealing times, the patterns show a decrease of intensity of the Fe (110) reflections with decreasing Fe content. For 1 h annealing, the Fe2B (002) reflection appears at Fe contents below 78 at.%, and the intensities of Fe2B (002) and Fe (110) peaks are almost equal in the Fe65B35 sample. Three Fe2B reflections appear in samples with 67–79 at.% Fe annealed for 50 h: (200), (002) and (210). They become stronger and the Fe (110) reflections weaken with increasing B concentrations.
Figure 2.

XRD patterns of Fe/B MLs annealed at 700 °C for (a) 1 h and (b) 50 h. The detected phases are Fe (110) at 2Θ=44.8° and Fe2B (211), (002) and (200) at 2Θ=45.2°, 43.2° and 35.21°, respectively. Remaining reflections belong to the substrate. The patterns are offset for clarity.
TEM measurements were performed to further characterize the microstructure and phases present. Figure 3 shows a high-angle annular dark-field (HAADF) image of a Fe67B33-sample annealed at 700 °C for 1 h in H2 atmosphere (a) or in vacuum (b). Fe grains and Fe2B particles with characteristic dimensions of 500–700 nm and ∼100 nm, respectively, are present in the H2-annealed sample. Some Fe grains contain amorphous B particles detected by selected area diffraction measurements. A thin Fe-O layer (probably formed during the sample preparation and transfer) and a B particle are seen at the surface. The top W layer was deposited during the FIB milling to reduce the sample damage. The substrate–film interface has a wavy shape indicating an unstable SiO2 diffusion barrier during the annealing.
Figure 3.

HAADF images of an Fe67B33 sample annealed for 1 h at 700 °C in H2 atmosphere (a) or in vacuum (b); (c) magnified bright-field image of the vacuum-annealed sample.
For the sample annealed in vacuum, the image shows that the initial precursor multilayer was transformed into a nanocomposite consisting of pure Fe and B particles and Fe2B precipitates with characteristic dimensions of 10–120 nm. The magnified bright-field image of figure 3(c) shows the nanocomposite structure as well as the remaining multilayer at the SiO2/film interface. From these observations, we conclude that the annealing time of 1 h was insufficient to completely transform the precursor multilayer into a nanocomposite. Again, the rough SiO2/film interface indicates an unstable SiO2 diffusion barrier, and a thin Fe-O surface layer remains after annealing.
Magnetic and mechanical properties
Magnetization measurements show that the thin films are ferromagnetic and soft magnetic after annealing (figure 4). The values of coercive field μ0Hc and saturation magnetization μ0MS are plotted as functions of the overall Fe content. As expected, the saturation magnetization values of the annealed films correlate with the Fe content. The μ0MS values of vacuum-annealed samples vary between 1.2 and 1.66 T, while the H2-annealed samples show slightly higher values for samples with 63 to 76 at.% Fe. The coercive field values show a different trend. For the MLs annealed in vacuum, they linearly decrease from 18 to 9 mT with increasing Fe content, whereas after H2 annealing, the films are magnetically softer and μ0Hc varies between 1.25 and 0.8 mT.
Figure 4.

Saturation magnetization μ0Ms (red squares) and coercive field μ0Hc (black triangles) values of vacuum-annealed and H2-annealed MLs as a function of overall Fe concentration.
Figure 5 shows the results of nanoindentation measurements of annealed Fe/B MLs. The Young's modulus of the 500 °C annealed MLs shows a small, linear increase from 160 to 180 GPa when the Fe content is increased from 60 to 85%, whereas the hardness decreases from 12.5 to 9.5 GPa. For samples annealed at 700 °C, the Young's modulus and hardness values increase for Fe concentrations between 67 and 72 at.% up to 235 and 18 GPa and then decrease by 40 and 100%, respectively, at higher Fe contents. The values for the Fe72B28 sample annealed at 700 °C for 1 h are comparable to the reported Young's modulus (210 GPa) and hardness (21 GPa) of Fe2B.
Figure 5.
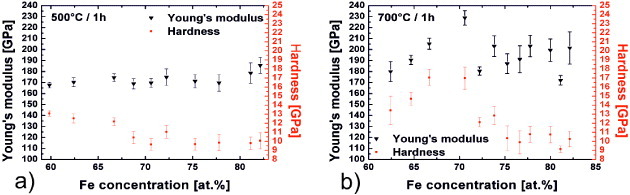
Compositional dependences of hardness and Young's modulus of Fe/B MLs annealed for 1 h in vacuum at (a) 500 °C and (b) 700 °C. Error bars indicate the standard deviation over 49 indents.
Discussion
The marked decrease in the coercive field to about 0.8 mT can be related to purification due to annealing in H2 atmosphere and to grain size effects. It is assumed that O contamination in the as-deposited films is minimized by H2-induced reduction processes. Our value agrees well with the coercive field of high-purity Fe (0.2–1.2 mT) [33]. Furthermore, the TEM image (figure 3(a)) shows larger Fe grains in the H2-annealed than in the vacuum-annealed sample, which can explain the magnetic softening.
The increase in the Young's modulus and hardness of the MLs annealed at 700 °C for 1 h in comparison to those of the samples annealed at 500 °C is related to the appearance of the Fe2B phase, which is detected by XRD in samples with 65–75 at.% Fe (figure 2(a)). The hardest samples have an Fe content of 67–72 at.% (figure 5(b)). High hardness values are expected for the Fe2B phase. For higher Fe concentrations the nanocomposite structure (Fe particles and Fe2B precipitates with dimensions of 10–120 nm), which was confirmed by TEM, can explain the indentation results. Small precipitates affect the initial yield strength and dominate the hardening behavior of ferritic steels [34–36]; they also strengthen off-stoichiometric compounds [35, 37]. The hardness values of Fe2B films (2–5 μm) vary between 15 and 21 GPa [13, 38] and are slightly higher than those values measured in this study (18 GPa or less). Our values can be explained on the basis of the multiphase structure of the films, containing Fe, Fe2B and amorphous B. Furthermore, the XRD patterns of the MLs annealed at 700 °C for 50 h suggest that the volume fraction of the Fe2B phase can be increased using a longer annealing time and/or higher annealing temperatures.
Conclusions
A wedge-type multilayer approach was used to fabricate Fe/B composition spreads as a model system for multifunctional nanocomposites for applications in harsh environments. The phases present in annealed films within the compositional range of 51 to 82 at.% Fe were investigated. TEM measurements revealed a nanocomposite structure for the Fe/B MLs annealed at 700 °C for 1 h consisting of Fe, B and Fe2B particles with characteristic dimensions of 10–120 nm. XRD patterns of the annealed Fe/B MLs show the appearance of Fe2B phases for samples with 62–79 at.% Fe and a weakening of the Fe (100) reflection with increasing B content in the MLs. The formation of Fe2B phases depends on the annealing time. The Young's modulus and hardness values were determined and related to the structure and composition of the films. The magnetic properties are improved by annealing in H2 atmosphere, and the hardness values increase from 8 to 18 GPa when the annealing temperature is increased from 500 to 700 °C. The appearance of Fe2B phases has a significant effect on the mechanical properties of the films. Heat treatment in H2 atmosphere lowers the coercivity by more than tenfold compared with those of films annealed in vacuum. We conclude that the presented Fe–B system can be used as a model for multifunctional nanocomposite thin films combining protective (e.g. hard) and functional (e.g. magnetic) properties.
Acknowledgments
The authors gratefully acknowledge financial support from DFG within the priority program 1299 ‘HAUT’ and the Heisenberg programme (AL). The authors thank Dr Ch Somsen for TEM measurements, as well as Dr X Wei and Professor Dr M Muhler (Ruhr-Universität Bochum) for access to the H2 furnace.
References
- Bhushan B. and Koinkar V N. Surf. Coat. Technol. 1995;76:655. [Google Scholar]
- Casiraghi C, Ferrari A C. and Robertson J. Diam. Relat. Mater. 2005;14:913. doi: 10.1016/j.diamond.2005.01.023. [DOI] [Google Scholar]
- Matson D W, Martin P M, Bennet W D, Johnston J W, Stewart D C. and Bonham C C. J. Vac. Sci. Technol. 2000;18(A):1998. doi: 10.1116/1.582461. [DOI] [Google Scholar]
- Csorbai H, Kovats A, Katai S, Hars G, Dücso C, Kalman E. and Deak P. Diam. Relat. Mater. 2002;11:519. doi: 10.1016/S0925-9635(02)00027-4. [DOI] [Google Scholar]
- Klever C, Stüber M, Leiste H, Nold E, Seemann K, Ulrich S, Brunken H, Ludwig A, Thede C. and Quandt E. Adv. Eng. Mater. 2009;12:969. [Google Scholar]
- Klever C, Seemann K, Stüber M, Ulrich S, Brunken H, Ludwig A. and Leiste H. J. Phys. D: Appl. Phys. 2010;43:395406. doi: 10.1088/0022-3727/43/39/395406. [DOI] [Google Scholar]
- Brunken H, Somsen C, Savan A. and Ludwig A. Thin Solid Films. 2010;519:770. doi: 10.1016/j.tsf.2010.09.008. [DOI] [Google Scholar]
- Chung H Y, Weinberger M B, Levine J B, Kavner A, Yang J M, Tolbert S H. and Kaner R B. Science. 2007;316:436. doi: 10.1126/science.1139322. [DOI] [PubMed] [Google Scholar]
- Chung H Y, Weinberger M B, Yang J M, Tolbert S H. and Kaner R B. Appl. Phys. Lett. 2008;92:261904. doi: 10.1063/1.2946665. [DOI] [Google Scholar]
- Gu Q, Krauss G. and Steurer W. Adv. Mater. 2008;20:3620. doi: 10.1002/adma.v20:19. [DOI] [Google Scholar]
- Weinberger M B, Levine J B, Chung H Y, Cumberland R W, Rasool H I, Yang J M, Kaner R B. and Tolbert S H. Chem. Mater. 2009;21:1915. doi: 10.1021/cm900211v. [DOI] [Google Scholar]
- Levine J B, Tolbert S H. and Kaner R B. Adv. Funct. Mater. 2009;19:3519. doi: 10.1002/adfm.v19:22. [DOI] [Google Scholar]
- Xiao B, Xing J D, Feng J, Zhou C T, Li Y F, Su W, Xie X J. and Cheng Y H. J. Phys. D: Appl. Phys. 2009;42:115415. doi: 10.1088/0022-3727/42/11/115415. [DOI] [Google Scholar]
- Jimenez J A, Gonzalez-Doncel G. and Ruano O A. Adv. Mater. 1995;7:130. doi: 10.1002/(ISSN)1521-4095. [DOI] [Google Scholar]
- Lanier L, Metauer G. and Moukassi M. Mikrochim. Acta. 1994;114/115:353. doi: 10.1007/BF01244562. [DOI] [Google Scholar]
- Watanabe S. and Ohtani H. Trans. ISIJ. 1983;23:39. [Google Scholar]
- Watanabe S, Ohtani H. and Kunitake T. Trans. ISIJ. 1983;23:121. [Google Scholar]
- Campos I, Oseguera J, Figueroa U, García J A, Bautista O. and Kelemenis G. Mater. Sci. Eng. 2003;352(A):261. doi: 10.1016/S0921-5093(02)00910-3. [DOI] [Google Scholar]
- Sen S, Sen U. and Bindal C. Vacuum. 2005;77:195. doi: 10.1016/j.vacuum.2004.09.005. [DOI] [Google Scholar]
- Culha O, Toparli M. and Aksoy T. Adv. Eng. Softw. 2009;40:1140. doi: 10.1016/j.advengsoft.2009.05.005. [DOI] [Google Scholar]
- Coene W, Hakkens F, Coehoorn R, de Mooij D B, de Waard, Fidler J. and Grössinger R. J. Magn. Magn. Mater. 1991;96:189. doi: 10.1016/0304-8853(91)90627-M. [DOI] [Google Scholar]
- Candolfo D, Malizia F, Ronconi F. and Zini G. J. Magn. Magn. Mater. 1994;133:463. doi: 10.1016/0304-8853(94)90596-7. [DOI] [Google Scholar]
- Stobiecki T. and Stobiecki F. J. Magn. Magn. Mater. 1983;35:217. doi: 10.1016/0304-8853(83)90499-7. [DOI] [Google Scholar]
- Vincze I, Boudreaux D S. and Tegze M. Phys. Rev. 1979;19(B):4896. doi: 10.1103/PhysRevB.19.4896. [DOI] [Google Scholar]
- Loebel R, Thienhaus S, Savan A. and Ludwig A. Mater. Sci. Eng. 2008;481(A):151. doi: 10.1016/j.msea.2007.02.168. [DOI] [Google Scholar]
- Ludwig A, Zarnetta R, Hamann S, Savan A. and Thienhaus S. Int. J. Mater. Res. 2008;99:1144. [Google Scholar]
- Vollmer M, Meyer J D, Michelmann R W. and Bethge K. Nucl. Instrum. Methods. 1996;117(B):21. doi: 10.1016/0168-583X(96)00235-2. [DOI] [Google Scholar]
- Pharr G M, Strader J H. and Oliver W C. J. Mater. Res. 2009;24:653. doi: 10.1557/jmr.2009.0096. [DOI] [Google Scholar]
- Oliver W C. and Pharr G M. J. Mater. Res. 1992;71:564. [Google Scholar]
- Pharr G M. and Oliver W C. Mater. Res. Soc. 1992;17:28. [Google Scholar]
- Oliver W C. and Pharr G M. J. Mater. Res. 2004;19:3. doi: 10.1557/jmr.2004.19.1.3. [DOI] [Google Scholar]
- Pfetzing J. Nanoindentation von NiTi-Formgedächtnislegierungen PhD Thesis Institute for Materials, Ruhr-University Bochum, Germany 2010 [Google Scholar]
- Springer G. 21st edn. Wuppertal Germany/Europa Lehrmittel Verlag; 1989. Fachkunde Elektrotechnik. [Google Scholar]
- Abel A. and Ham R K. Acta Metall. 1966;14:1489. doi: 10.1016/0001-6160(66)90170-2. [DOI] [Google Scholar]
- Han C S, Wagoner R H. and Barlat F. Int. J. Plast. 2004;20:477. doi: 10.1016/S0749-6419(03)00098-6. [DOI] [Google Scholar]
- Preininger D. J. Nucl. Mater. 2002;307–311:514. doi: 10.1016/S0022-3115(02)01210-2. [DOI] [Google Scholar]
- Yao X X. Mater. Sci. Eng. 1999;271(A):353. doi: 10.1016/S0921-5093(99)00280-4. [DOI] [Google Scholar]
- Dehlinger A S, Pierson J F, Roman A. and Pichon L. Surf. Coat. Technol. 2003;174–175:331. doi: 10.1016/S0257-8972(03)00399-2. [DOI] [Google Scholar]