Abstract
This work explores functional, fundamental and applied aspects of naturally harvested spider silk fibers. Natural silk is a protein polymer where different amino acids control the physical properties of fibroin bundles, producing, for example, combinations of β-sheet (crystalline) and amorphous (helical) structural regions. This complexity presents opportunities for functional modification to obtain new types of material properties. Electrical conductivity is the starting point of this investigation, where the insulating nature of neat silk under ambient conditions is described first. Modification of the conductivity by humidity, exposure to polar solvents, iodine doping, pyrolization and deposition of a thin metallic film are explored next. The conductivity increases exponentially with relative humidity and/or solvent, whereas only an incremental increase occurs after iodine doping. In contrast, iodine doping, optimal at 70 °C, has a strong effect on the morphology of silk bundles (increasing their size), on the process of pyrolization (suppressing mass loss rates) and on the resulting carbonized fiber structure (that becomes more robust against bending and strain). The effects of iodine doping and other functional parameters (vacuum and thin film coating) motivated an investigation with magic angle spinning nuclear magnetic resonance (MAS-NMR) to monitor doping-induced changes in the amino acid-protein backbone signature. MAS-NMR revealed a moderate effect of iodine on the helical and β-sheet structures, and a lesser effect of gold sputtering. The effects of iodine doping were further probed by Fourier transform infrared (FTIR) spectroscopy, revealing a partial transformation of β-sheet-to-amorphous constituency. A model is proposed, based on the findings from the MAS-NMR and FTIR, which involves iodine-induced changes in the silk fibroin bundle environment that can account for the altered physical properties. Finally, proof-of-concept applications of functionalized spider silk are presented for thermoelectric (Seebeck) effects and incandescence in iodine-doped pyrolized silk fibers, and metallic conductivity and flexibility of micron-sized gold-sputtered silk fibers. In the latter case, we demonstrate the application of gold-sputtered neat spider silk to make four-terminal, flexible, ohmic contacts to organic superconductor samples.
Keywords: spider silk, electronic conductivity, pyrolization, flexible metallic wire
Introduction
Natural fibers from plant and animal origins have a long history as textile materials. More recently, attention has been directed towards multifunctional materials that serve several purposes, such as conducting mats or fabrics with combined thermal, toughness, elastic, electrical, optical and other properties. Generally, these are synthetically produced materials such as polyaniline-coated polyesters for radar-absorbing cloth covers or resin-impregnated carbon nanotube mats (‘buckypaper’) with both structural integrity and anisotropic thermal and electrical properties for wings, hulls, blades, etc. These materials generally have a relatively simple structure involving linear chain-type repeating monomer or nanocomponents. However, in the case of fibers produced by silk worms or spiders, a more complex, protein-based polymer structure is formed. In particular, for spider silk fiber, there are many different amino acid residues that populate the protein backbone, leading to a large variation in toughness, elasticity, strength, sensitivity to moisture and so on. The key to the structure of the spider protein repeating sequences (fibroins) is the combination of crystal-forming blocks (β-sheet crystals) and amorphous (sometimes helical) network chains that are part of the amino acid sequence motifs [1–3]. For instance, the percentages of alanine, glycine and proline affect the degree of crystallinity, helicity (amorphous structure) [4, 5], elasticity [6, 7], hygroscopicity and adhesiveness [8].
Mechanical function is presently the main area of inquiry in spider silk research, and most groups have focused on a few selected species such as Araneus diadematus and Nephila clavipes to systematically explore the structure and function of the silk fiber. For instance, in A. diadematus the dragline/web frame silk fiber is very stiff with small extensibility (∼30%), whereas its viscid orb-web silk fiber is very stretchable with large extensibility (∼300%) [4]. Depending on the hydration level (i.e. relative humidity RH), spider silk fiber experiences supercontraction [9]. This effect is one of the most important factors in tailoring the tensile behavior of spider silk fiber [10, 11]. Recent experiments [12] show that supercontraction occurs suddenly above a critical value of RH=70%. At higher RH exposures, water is retained in the silk fiber even after subsequent drying.
Here, we present new functionality of spider silk, in particular electrical conductivity under differing conditions of humidity, iodine (I2) doping, pyrolization and metallic thin film coating, while using the silks remarkable mechanical and biochemical properties. Several remarkable functions are realized, including sensitivity to polar solvents, I2-induced robustness of pyrolized spider fibers, incandescence, and applications as micron-sized, elastic, metallic wires that function even at cryogenic temperatures as ohmic contacts to organic crystals. The effects of this functionality are explored by thermal, optical, magnetic resonance and infrared spectroscopy methods.
Experimental details
Samples
Samples of spider silk fiber were harvested from the natural habitat of N. clavipes (common name: golden orb weaving spider) by removing only the dragline silk fiber from the web structures (see figure 1). No washing or special treatment was used to process the silk fiber. The single dragline silk is not adhesive and is the strongest type of silk fiber. The dragline silk fiber bundle used in this study had a diameter of ∼32 μm, with individual silk fibers having a diameter of ∼3.35 μm. Similar methods were used to harvest the much more extensive webs of the Kukulcania hibernalis (common name: southern house spider) and Pholcus phalangioides (common name: vibrating spider) whose webs are also not adhesive. Of note is that the K. hibernalis silk fiber does not have a distinct orb and dragline structure, but is frayed by the spider when constructing a random distribution of silk fiber in the web structure. Individual silk fibers were about 2 μm in diameter. Similar to K. hibernalis, the P. phalangioides silk also does not have distinct orb and dragline structure. The web generally hangs in a net-like fashion from overhanging structures. Individual silk fibers were about 0.5 μm thick. In webbed samples, silk strands were extracted and separated with tweezers on glass slides under a microscope. In most cases, bundles of silk fibers of 10–200 μm diameter were employed in this study.
Figure 1.
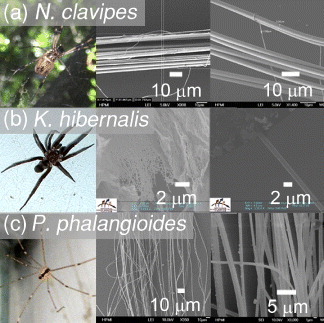
Spider species and silk fibers used in this study. Top: female N. clavipes, bundles of dragline silk fiber (diameter ∼32 μm) and individual dragline silk (diameter ∼3.35 μm). Middle: female K. hibernalis. The web has frayed silk structure and also single-strand fiber structure with diameter of ∼2 μm. Bottom: female P. phalangioides. The silk fiber has a diameter of ∼0.5 μm.
Solvent exposure
Solvents with different polarities were prepared in separate clean bottles, including an empty control bottle. Two holes were drilled into a bottle cap made of polytetrafluoroethylene (PTFE) to insert two platinum wires that were used to measure the resistance of the sample. PTFE was chosen owing to its highly non-reactive and insulating nature. A silk fiber bundle of P. phalangioides was mounted on to the platinum wires in a two-contact configuration using carbon paste. The resistance was monitored using an electrometer (Keithley 6517A). Each solvent exposure measurement was performed by monitoring the sample resistance while alternating the sample between the empty control bottle and a specific solvent bottle (with cap sealed) and back to the control bottle every 150 s. These measurements were carried out at ambient pressure and temperature of 22 °C.
Iodine doping
To study the effects of I2 doping on silk fiber bundles, we prepared individual bundles by attaching gold or platinum wire contacts to neat spider silk fiber bundles with carbon paste, neither of which interacted with I2. Then, the silk fiber was doped with I2 by putting the neat silk fiber inside a sealed vial together with solid I2 chunks, at 25 °C for 24 h (lightly I2-doped). Afterwards, the I2-doped silk fiber (now dark in color) was placed in vacuum for 12 h before being measured. The evacuation restored the original silk color. To clarify the effect of I2 doping, the silk fiber was further doped by exposing the silk fiber to I2 vapor at 70 °C for 3 h (heavily I2-doped), resulting in a permanent deep-brown color of the silk fiber.
PVA coating
Polyvinyl alcohol (PVA) solution was made by dissolving 5 wt% PVA in water at 90 °C for several hours. Next, the carbon fiber (pyrolized silk fiber) was immersed in the PVA solution for 60 s, followed by air-drying the carbon fibers on filter paper.
Electron microscopy
Scanning electron microscopy (JEOL JSM-7410F field-emission SEM) imaging of spider silk pyrolization was mostly performed in the secondary electron imaging mode at 10 keV. In some cases, it was necessary to use the lower secondary electron imaging (LEI) mode to improve the image quality. Imaging of the gold-sputtered spider silk fiber was carried out at 7 keV, whereas for the mandolin setup, the voltage was lowered to 5 keV (LEI mode) to reduce the risk of destroying the organic sample.
Raman spectroscopy
Raman spectroscopy was carried out with a 785 nm excitation wavelength and 10 s exposure on both the pyrolized neat and the pyrolized I2-doped silk fiber using a Renishaw Invia micro-Raman spectroscope.
Electrical conductivity
P. phalangioides and N. clavipes dragline silk fiber bundles were isolated from the web and connected in a two-terminal conductivity configuration using carbon paste. Current–voltage (I–V) measurements were performed for the neat silk fiber with a standard electrometer (Keithley 6517A) inside a humidity chamber (figures S1 and S2, available at ), monitored with a pressure-independent humidity sensor, model HIH-5030-001 (Newark). The sample and the humidity sensor were mounted side by side in the middle chamber. The left chamber was connected to the water reservoir, and the right chamber was connected to a vacuum pump. By turning the regulators in each chamber, it was possible to control the RH level at a desired rate; for example, closing the left valve and opening the right valve would decrease the RH. The time constant for I–V measurement was also taken into account (figure S3). The conductivity versus RH was carried out at 22 °C and a 4% RH/min rate to ensure consistent equilibration rates. The cross-section area of the N. clavipes dragline silk fiber bundle was determined by first measuring the diameter of the individual silk fibers and the overall diameter of the silk fiber bundles under SEM and then counting the total number of individual silk fiber in the bundle under microscope. There were 38 individual silk fibers in a bundle with overall diameter ∼32 μm that gives the cross-section of ∼3.34×10⁻⁶ cm−2. We found that this experimental value is 62% less than the ideal case where the bundle is composed of perfectly hexagonally packed silk fibers. Using this correction factor and by calculating the cross-section of ideal P. phalangioides silk fiber bundle, we estimated the cross-section of the P. phalangioides silk fiber bundle to be ∼1.09×10⁻⁴ cm2. The lengths of the silk fiber bundles were estimated under an optical microscope equipped with a scale bar.
Gold sputtering deposition and four-terminal resistance measurements
The `mandolin’ configuration was first prepared by aligning four neat dragline silk fibers between two toothpicks secured by GE varnish or enamel (figure S6(b) available at ). The fibers were gold-sputtered in an evacuated sputtering chamber (Denton Vacuum Desk II) for 30 s at 40 mA current, followed by a 15 s break, and then by a second 30 s deposition. The 15 s break minimized the risk of excessive heating during sputtering. The aligned gold-sputtered fibers were transferred to a substrate and secured using a hard Stycast 2850 epoxy (figure S6(c)). (We found that owing to the strength of the silk fibers, contraction during cryogenic cycling caused the fibers to pull away from softer adhesives such as varnishes and glues.) The organic crystal was then positioned on the top of a slide glass and pushed against the substrate and the aligned fibers (figure S6(d)). The substrate and slide glass were secured with GE varnish. Finally, the gold-sputtered silk fibers were connected to copper wires using silver paste. Four-terminal resistance measurements were carried out using an SR830 lock-in amplifier.
Cryogenic measurements
The temperature-dependent resistance of a single gold-sputtered K. hibernalis silk fiber was measured at the National High Magnetic Field Laboratory in a dilution refrigerator from 300 K down to ∼260 mK. The gold-sputtered silk fiber junctions were characterized in a vacuum-sealed container in a regular liquid N2 bath. The measurement of the κ-(BEDT-TTF)2Cu[N(CN)2]Br organic crystal using the mandolin method was performed in a vacuum-sealed container in a regular liquid 4He bath.
1H–13C CP-MAS-NMR
Solid-state nuclear magnetic resonance (NMR) in N. clavipes dragline silk fiber was measured with a Bruker Avance III 11.75 Tesla (500 MHz 1H NMR frequency) wide-bore solid-state NMR system with a 2.5 mm triple-resonance (1H-X-Y) NMR probe in the double resonance mode. 1H–13C cross polarization (CP) magic angle spinning (MAS) spectra were obtained at 25 kHz MAS using 2.27 μs 1H NMR pulse, 2 ms of CP contact, 110 kHz two-pulse phase-modulated (TPPM) decoupling and a 2 s recycle delay. 1H–13C CP MAS spectra were obtained for the neat silk fiber (both dry and hydrated), gold-sputtered silk fiber and I2-doped silk fiber. All spectra were normalized to the alanine Cα peak.
FTIR
Fourier transform infrared (FTIR) spectroscopy measurements were carried out at room temperature under attenuated total reflectance (ATR)-FTIR mode using the Smart Orbit diamond ATR accessory of the Thermo Scientific Nicolet 6700 spectrometer equipped with a thermoelectrically cooled deuterated triglycine sulfate (DTGS) detector. The spectra were recorded in absorption mode at 2 cm−1 resolution in the 4000–400 cm−1 region. The content of β-sheet was estimated by peak deconvolution in the amide II region (1480–1585 cm−1).
Results and discussion
In sections 3.1–3.4 below, we describe the functional and applied aspects of naturally harvested spider silk fibers, and in section 3.5, a qualitative model for the modification of the physical properties of spider silk with iodine is presented.
Properties of neat and I2-doped spider silk
Humidity-dependent conductivity
The I–V curve of the P. phalangioides neat silk fiber under ambient laboratory conditions (22 °C and RH∼ 50%) is shown in figure 2(a). Aside from a slight nonlinearity in the lower voltage region ∼0–4 V, the conductivity (σ) value extracted from the I-V curve and the geometrical factors (σ=G×l/A, where G is the conductance, l is the length=0.14 cm and A=1.09×10⁻⁴ cm2 is the estimated cross-section of the sample—see experimental section 2.7) is ∼44 nS cm−1, indicating the electrically insulating nature of neat silk fiber. The dependence of the conductivity on RH (below 70%) for neat silk fiber is shown in figure 2(b) for different bias voltages. We find that the conductivity scales very closely to σ=σ0 exp(0.23RH) (figure 2(b)). The exponential dependence of σ on RH indicates that the enhanced conductivity originates neither from a simple (linear) geometrical addition of the conductivity, due to adding water molecules to the silk structure, nor from percolation [13] effects which would involve a threshold RH (RHc) and a power law dependence of G on (RH–RHc)γ. Hence the RH dependence of G must involve some mechanism where the presence of water activates the conductivity. We will return to this point in section 3.3.1.
Figure 2.
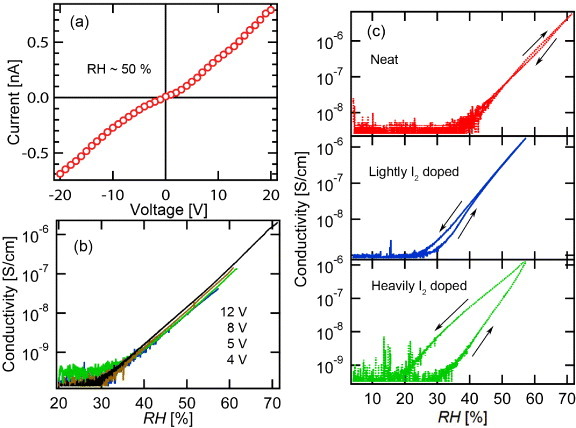
Humidity-dependent conductivity of spider silk fiber. (a) I-V curve of neat P. phalangioides silk fiber at RH ∼ 50 %. (b) Humidity-dependent conductivity for different applied voltages of P. phalangioides silk fiber. (c) Humidity-dependent conductivity of neat (top), lightly (middle) and heavily (bottom) I2-doped N. clavipes dragline silk fibers.
Under ambient laboratory RH conditions, an increase in conductivity of about 600% was observed with exposure to I2 for ‘lightly I2-doped’ silk fiber, but no additional increase was observed for ‘heavily I2-doped’ silk fiber (see section 2.3). The cyclic RH response of the conductivity of silk fiber was further explored in N. clavipes neat fiber and lightly I2-doped and heavily I2-doped dragline silk fiber as shown in figure 2(c) (l=0.12 cm and A=3.34×10⁻⁶ cm2). The response of neat silk fiber to RH was nearly reversible, but doping with I2 caused an increase in water retention, as manifested by the hysteretic behavior of the conductivity with RH, which was the highest for the heavily I2-doped material. The incremental increase in conductivity may come from an electron transfer to the conduction band of the protein backbone or from dissociation of water+iodine compound resulting in additional ionic transport. This is discussed further in section 3.5.
Polar-solvent-dependent conductivity
Previous work has shown that the effect of supercontraction is correlated with the polarity of the solvents used [14]. In the present case, we have made comparative measurements of the resistance of neat P. phalangioides silk fiber that has been exposed to the saturated vapors (under ambient conditions) of a variety of polar solvents, as shown in figure 3(a). A characteristic drop in resistance is observed versus time during exposure, which recovers after exposing the sample to air. Similar measurements were done for immersion of the bare electrodes into the liquid, and the changes in the resistance (ΔR) after establishing equilibrium for both vapor and liquid-electrode exposures are shown in figure 3(b) for the different polarity indices (PI). (Here we note that due to the stiffness of the electrodes, contraction of the sample length was not evident with liquid immersion, but densification of the sample thickness was clearly observable.) The changes in resistance for saturated vapor exposure clearly follow the changes in resistance of the bulk liquid versus solvent polarity. Simple absorption of the vapor by the porous fiber structure may account for the main effect observed (as opposed to chemical or polarization effects between the solvents and the silk fibers). Assuming a linear response of ln(G) to PI, we find that the resistance drop for either vapor or liquid immersion follows a G=G0 exp(C×PI) relationship (where C∼1.0 for vapor and ∼2 for liquid), indicating an activated dependence on solvent polarity. Since some water might be present in the starting solvents and vapors, the solubility of the solvents in water was considered, but no significant correlation between the conductivity change and the solubility in water was observed. Since pure, non-ionic solvents are electrical insulators, the increases in conductivity should be caused by the action of the solvents, which is to dissolve and make mobile impurities with ionic character, and this effect should increase with polarity index. Some deviations from this general rule are apparent, as is the case for dimethylsulfoxide (DMSO), which showed an anomalous interaction with the spider silk as evidenced by the resistance behavior. This may be due to the hygroscopic nature of DMSO, absorbing additional water from the air.
Figure 3.
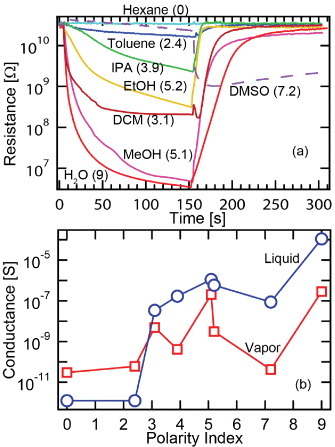
(a) Time dependence of resistance as the P. phalangioides silk fiber was exposed to solvent vapor followed by exposure to ambient air. Solvents (polarity index, % solubility in water): hexane (0, 0.001), toluene (2.4, 0.051), dichloromethane (3.1, 1.6), isopropanol (3.9, 100), methanol (5.1, 100), ethanol (5.2, 100), DMSO (7.2, 100) and H2O (9, 100). The DMSO response is distinctly different. (b) Conductance change versus solvent polarity index for vapor (square) and liquid (circle) exposures.
Thermal and structural analysis of pyrolized silk
Pyrolization of organic polymers results in the formation of graphitic fibers. Here, by heating to temperatures approaching 1000 °C, non-carbon components are preferentially driven off, leaving the carbon backbone to form a mixture of amorphous and crystalline carbon structures. This occurs also for protein-based polymers such as spider silk, where we find that as in the case of silkworm (Bombyx mori [15]) fibers, I2 doping plays an important role in the final morphology of pyrolized spider silk fibers. This motivated us to perform thermogravimetric analysis (TGA) of neat and heavily I2-doped P. phalangioides silk to quantify the effects of I2 on the pyrolization process. As is evident in figure 4, for I2 doping at 70 °C for 3 h, an ∼10% increase in weight was observed indicating that I2 is trapped in the silk structure (see section 3.5). I2 doping also increased the carbon yield by ∼7%, and reduced the weight reduction temperature (TC) by 25 °C. Most of the I2 evaporates below 200 °C, as seen from the intersection temperature (Ti) between the I2-doped and neat silk fiber TGA curves at ∼200 °C in figure 4. The accelerated weight loss in I2-doped spider silk is similar to that of I2-doped coal tar pitch (CTP) [16]. As in CTP, the main weight reduction process in I2-doped silk fiber starts and finishes at lower temperatures compared to undoped silk fiber. In CTP, this effect of the I2 doping is attributed to dehydrogenation and polymerization occurring in the temperature range 200–150 °C. Mass spectroscopy observes a significant amount of hydrogen iodide (HI) that is generated in this temperature range. It is argued that the removal of hydrogen from the CTP components via HI produces radicals that accelerate the polymerization process in CTP. In effect, the molecular weights of the components increase, and a higher amount of carbon is retained upon pyrolization compared to undoped CTP. A similar process is likely at work in the spider silk fibers, where increased iodine-induced polymerization reduces overall carbon loss that is due to evaporation of smaller molecular constituents.
Figure 4.
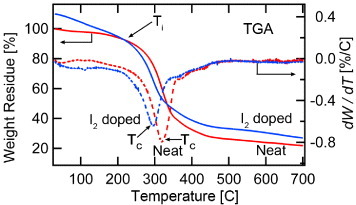
Thermogram (TGA) of P. phalangioides silk fibers. For heavily I2-doped silk fibers, the thermogram shows a reduction of TC from ∼319 °C to 294 °C and an ∼7% increase of carbon yield. For the heavily I2-doped silk fibers, the weight residue was normalized with respect to the initial weight of silk fibers before I2 doping. After I2 doping, the weight increased by ∼10%. Ti indicates the temperature at which the physisorbed I2 has evaporated; above Ti, the chemisorbed I2 starts to be removed.
Similar TGA behavior of spider silk and CTP leads to the following interpretation of iodine doping in silk. First, the heavily I2-doped spider silk fibers physisorb and chemisorb I2 into both the amorphous and β-sheet regions of the spider silk fibers (see sections 3.3.4 and 3.4). Upon heating to 200 °C, most of the physisorbed I2 evaporates. Above 200 °C, the chemisorbed I2 is removed via HI formation, turning the dehydrogenated components into radicals. This allows an accelerated polymerization as in the case of CTP, resulting in a higher carbon yield compared to undoped silk fibers.
SEM and Raman spectroscopy studies of pyrolized silk
The bulk structure of neat silk fiber (P. phalangioides) was compared to the heavily I2-doped silk fiber before and after pyrolization (figure 5). Pyrolization was carried out in a tube furnace by heating the silk fiber up to 800 °C at a 5 °C min−1 rate in Ar atmosphere. For neat silk (figures 5(a) and (b)), the fibers were 0.5–1 μm in diameter, and considerable disintegration of the fiber structure occurred after pyrolization. This resulted in a very brittle carbonized product. In contrast, the I2-doped silk fibers (figures 5(c) and (d)) formed large bundles and/or ribbon-like structures, each comprised of ∼5–10 silk fibers. After pyrolization, the bundle structure of I2-doped silk fibers remained intact and relatively flexible, with considerably less disintegration than for neat silk fibers (figure 5(a)). This is discussed further in section 3.5.
Figure 5.
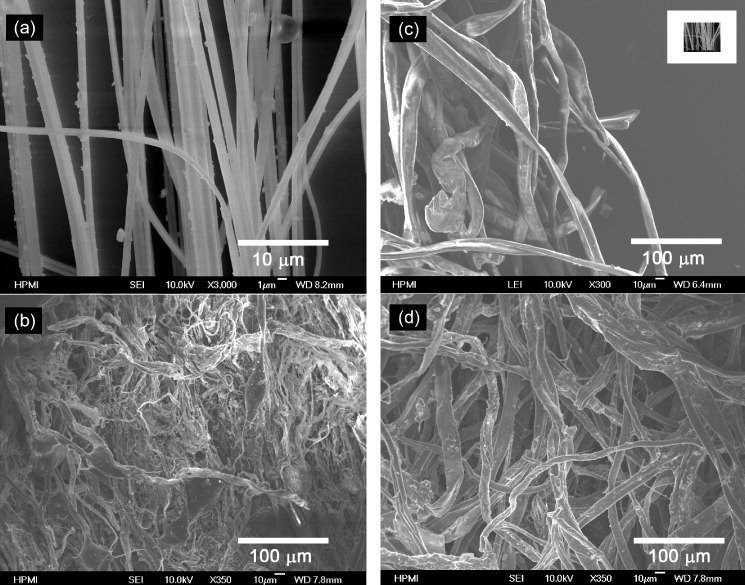
Comparison between neat and heavily I2-doped P. phalangoides silk fibers before and after pyrolization. Left: neat silk fibers before (a) and after (b) pyrolization. Before pyrolization, individual silk fibers of diameter ∼0.5 μm were separated. After pyrolization, fiber disintegration was apparent. Right: heavily I2-doped silk fibers before (c) and after (d) pyrolization. Before pyrolization, I2 doping formed silk fiber bundles with an average diameter of ∼10 μm. After pyrolization, only small amount of disintegration was observed, leaving the bundles intact. The inset of (c) emphasizes the difference between the neat (a) and heavily I2-doped silk fibers on the same scale.
Raman spectra of both the pyrolized neat and heavily I2-doped silk fiber are shown in figure 6(a). Both samples exhibit D-band (∼1300 cm−1) and G-band (∼1600 cm−1) peaks, which are associated with disordered and graphitized carbon, respectively. Aside from a relative increase in spectral intensity for the I2-doped silk fiber, the spectra are very similar, and the IG/ID intensity ratio, used to characterize the degree of crystallinity, does not change significantly with I2 doping. This is similar to the pyrolized I2-doped fiber from Bombyx mori [15], except that in the present case IG/ID indicates a higher percentage of amorphous carbon for P. phalangioides.
Figure 6.
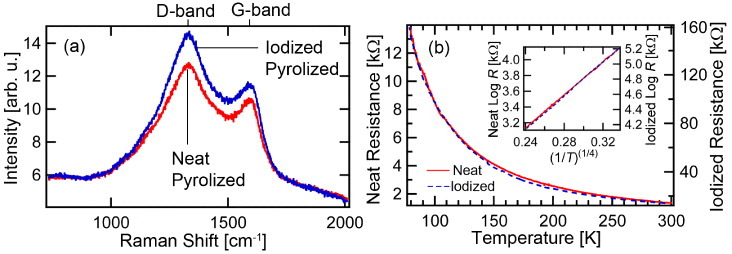
(a) Raman spectra of pyrolized neat and heavily I2-doped P. phalangioides silk fibers. (b) Temperature-dependent electronic transport of pyrolized neat (solid line) and I2-doped (dashed line) P. phalangioides silk fibers. Inset: log(R) versus (1/T)(1/4) fit, showing that the pyrolized silk fiber follows a variable range hopping (VRH) mechanism.
Electrical, thermoelectric and incandescent properties of pyrolized silk
The temperature dependence of the electrical resistance (R) of both the pyrolized neat and heavily I2-doped silk fiber were investigated in the range 77–300 K, and found to obey a variable range hopping (VRH) behavior R=R0 exp([T0/T]1/4) over the entire temperature range with a barrier energy T0 of ∼13 000 K (see figure 6(b)). Further improvement to the flexibility of the pyrolized carbon fiber bundles for handling was accomplished by coating the bundles with PVA that did not affect the electrical conductivity.
The semiconducting properties of the pyrolized spider silk fibers (see figure 8(a)) were investigated by thermoelectric measurements using a standard two-probe configuration at room temperature (see figure 7 and supplementary figure S4 available at ). Figure 7(a) shows that the thermally induced electric field opposes the thermal gradient (i.e. heating the fiber at the junction connected to the positive electrometer terminal produces a negative voltage). This negative voltage suggests that the pyrolized silk fiber is a p-type semiconductor with predominantly hole carriers. In contrast, under the same conditions, a carbon fiber made from polyacrylonitrile (PAN) produced a positive voltage, characteristic of an n-type semiconductor (figure 7(b)). To validate this very simple method of determining carrier type, more systematic thermopower (Seebeck) measurements were performed versus temperature as shown in figure 7(c). The thermopower studies confirmed the identification of the dominant carrier types obtained by the simple (figure S4) thermoelectric method.
Figure 8.

(a) Photographs of neat (top), heavily I2-doped (middle) and pyrolized (bottom) silk fiber bundles, as well as of incandescence from pyrolized neat (b) and pyrolized heavily I2-doped (c) P. phalangioides silk fibers.
Figure 7.
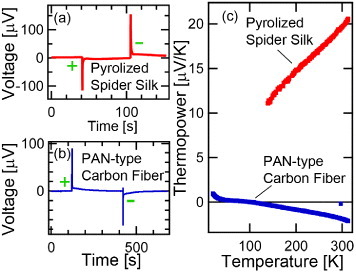
Thermoelectric properties of pyrolized fibers. (a) Voltage versus time for a P. phalangioides carbon fiber momentarily heated at each end (sequentially) of a two-terminal configuration. A heat pulse at the positive (negative) voltmeter terminal produces a negative (positive) voltage spike. (b) Voltage versus time of polyacrylonitrile (PAN)-type carbon fiber showing an opposite thermoelectric response to a heat pulse. (c) Comparison of the temperature-dependent thermopower for pyrolized silk and PAN fibers indicating hole-like and electron-like conductivity, respectively, at room temperature.
We discovered that it is possible to make an incandescent bulb from either pyrolized neat (figure 8(b)) or I2-doped (figure 8(c)) spider silk. To do this, the pyrolized silk bundle was connected to copper wires with carbon paste and placed inside a vacuum chamber. A variable ac (60 Hz) transformer was used to provide current to the filaments. Although not confirmed in detail, the light spectrum appeared to be conventional blackbody radiation.
Properties and applications of gold-sputtered silk
One main motivation for the present study was to consider the use of spider silk fiber as a flexible, metallic electrode material for the investigation of tiny organic crystals at low temperatures. We found that gold could be readily sputtered onto spider silk fibers and the deposited thin films appeared to adhere very well to the fibers. Sputtering is a diffusive process, and by inspection, the gold appears to coat the whole silk fiber. SEM images (figure 9(a)) show that the gold forms small round domains with an average diameter equal to the film thickness ∼20 nm. The surface electrical resistance (figure 9(b)) reveals metallic conductivity in the gold-sputtered spider silk fiber, down to the lowest temperatures studied (T ∼ 260 mK).
Figure 9.
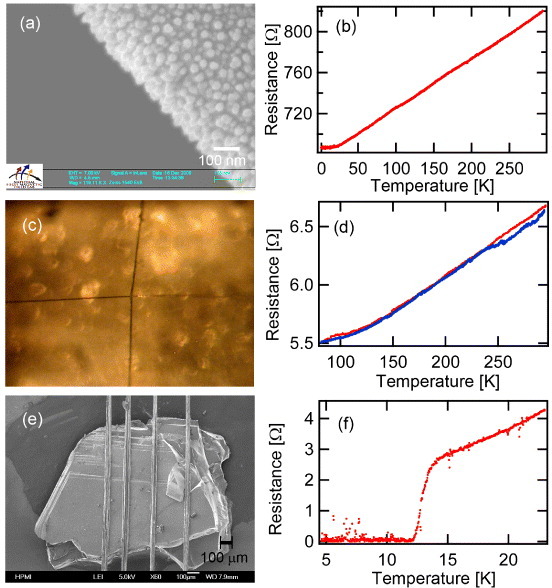
Top: (a) SEM and (b) temperature-dependent four-terminal resistance down to ∼260 mK of a single gold-sputtered K. hibernalis silk fiber. Middle: (c) electrical junctions from gold-sputtered K. hibernalis silk fiber and (d) temperature-dependent four-terminal junction resistance between two crossed gold-sputtered silk fibers. Bottom: (e) SEM of the gold-sputtered N. clavipes dragline silk fibers pressed against the sample in the mandolin method. The gold-sputtered silk fiber at the edges of the sample was broadened by ∼10% due to the tension. (f) Temperature-dependent four-terminal resistance of the resistive superconducting transition (∼12 K) in κ-(BEDT-TTF)2Cu[N(CN)2]Br measured by the mandolin technique.
The gold-sputtered silk fibers remained elastic; cross-junctions (see figure S5) under tension could be formed, and the junction contacts exhibited metallic conductivity versus temperature (figures 9(c) and (d)). In principle, for junctions involving p- and n-type coatings, diode characteristics should be possible.
The elastic properties of the gold-coated silk fibers also allowed their use as four-terminal contacts to small organic crystals (in this case for κ-(BEDT-TTF)2Cu[N(CN)2]Br) via the ‘mandolin’ method (see figure S6). The gold-sputtered dragline silk fiber was still electrically conducting even after bending the fiber at a relatively high angle (figure S6(f)). Because of the non-elastic nature of annealed gold wires or the stiffness of work-hardened metal wires, it is not possible to sustain ohmic contacts to soft organic crystal using just pure gold or work-hardened metal wires.
The resistance versus temperature measurement for the organic superconductor κ-(BEDT-TTF)2Cu[N(CN)2]Br was very stable and robust for most temperature range (figure 9(f), figures S7(a) and (b)). Using this technique, we were able to reproduce the resistive superconducting transition at ∼12 K reported in the literature for a sample from the same batch [17]. Multiple warming/cooling cycles were done to ensure repeatability, and since the sample has not been contaminated by conventional silver/carbon paste contacts, it could be saved for future measurements in other setups.
1H–13C CP-MAS-NMR analysis of functionalized neat spider silk
The behavior of neat silk fiber when exposed to water, I2, and gold sputtering raises questions as to the associated effects on the silk protein structure itself. In this respect, MAS-NMR has proven to be a powerful tool of probing the individual amino acid sites on the protein backbone [18–21], to look for differences with functionalization. It is generally accepted that there are two main types of proteins that constitute dragline silk, namely, spidroin 1 and spidroin 2. Spidroin 1 [1] and spidroin 2 [2] contain mostly amorphous chains (sometimes 31 helix [3]) with GXG and GPGXX amino acid patterns, respectively (where X is the amino acid—the structure and labeling used for the amino acids detected in the NMR spectra are given in figure S8) accompanied by alanine (Ala)-rich crystal-forming β-sheet blocks [3]. Many NMR studies on spider silks have been performed to understand its structure and the relation of structure to the mechanical properties, thus providing guidance for the effects of functionalization of concern to the present work.
Neat (ambient) and hydrated silk
As a control, the MAS-NMR spectra for neat silk fiber under ambient conditions was obtained and labeled according to the literature [21]. The sample was then hydrated and the resulting spectra compared with that for ambient neat silk fiber as shown in figure 10(a). The effects of hydration decrease the intensity of most of the peaks except for the two Ala peaks, Ala Cα and Ala Cβ (β-sheet), which are generally attributed to the poly-Ala located in the β-sheet crystal-forming blocks. The overall intensity decrease of the spectra in the hydrated sample is thought to result from the increasing mobility of the protein backbone and side-chain mobility with hydration [22, 23]. Of the affected peaks, the largest intensity drops were observed for the glycine (Gly) Cα, and glutamate or glutamine (both labeled as Glx), serine (Ser) and proline (Pro) peaks. This indicates that at lower humidity, most of the water only enters the Gly site. As the humidity increases, more sites are filled by water, first, going into the Glx sites and then into the Ser and Pro sites. This sequential water absorbance might be correlated to the exponential increase in conductivity with humidity (section 1.1).
Figure 10.
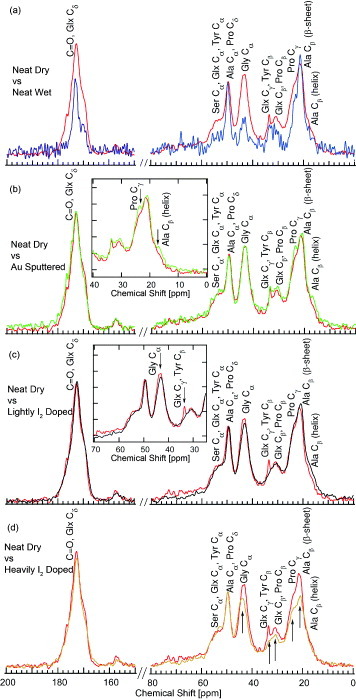
1H–13C CP-MAS spectra of N. clavipes dragline silk fibers. (a) Neat silk fibers in dry (upper red curve) and hydrated (lower blue curve) state. The results of Creager et al [21] were used to make the amino acid assignments. Except for the Ala Cα and Ala Cβ (β-sheet) peaks, the hydrated spectra are lower in intensity. (b) Neat (red) and gold-sputtered (green) silk fibers. Inset: detail of slight intensity increase in Pro Cγ and Ala Cβ (helix) peaks after gold sputtering. (c) Neat (upper red curve) and lightly I2-doped (lower black curve) silk fibers. Inset: detail of decrease in Gly Cα and Glx Cγ (Tyr Cβ) peaks after I2 doping. (d) Neat (upper red curve) and heavily I2-doped (lower orange curve) silk fibers. Intensity reduction in most peaks is indicated by the arrow.
Gold-sputtered silk
Following our observation of the apparent affinity for gold to adhere to the surface of silk fibers, we measured the spectra for the gold-sputtered silk fiber for comparison with neat dry silk as shown in figure 10(b). We found that the spectra are not strongly affected, and hence most of the gold particles adhere to the surface of the silk fiber without disturbing its internal structure. However, there was slight enhancement of Pro Cγ and Ala Cβ (helix) peaks. This may be due to a decrease in the NMR relaxation time (T1) in these regions due to gold conduction electrons. The reduced width of the Pro and Ala lines, and hence the intensity enhancement, may evidence the good adherence of gold particles to the silk fiber surface via the Pro and Ala sites.
Lightly I2-doped silk
In the third MAS-NMR study, the spectra for lightly I2-doped silk fiber were obtained and compared to that of the neat dry silk fiber (figure 10(c)). Like in the gold-sputtered case, the overall structure of the spectra was not strongly affected. However, there is a significant loss of intensity for the Glx Cγ peak and a slight drop for the Gly Cα signal. We noted that in this lightly I2-doped sample, the sample color recovers after evacuation for 12 h. Therefore, in the MAS-NMR experiment, where the sample was under ambient conditions, there is only a minimal amount of I2 present, probably around the Gly Cα and Glx Cγ sites.
Heavily I2-doped silk
With respect to the heavily I2-doped silk fiber, the MAS-NMR spectra showed intensity reduction not only in the components of the amorphous region, indicated by the Gly Cα, Glx Cγ, Glx Cβ and Pro Cγ peaks, but also in the components of the crystalline region such as Ala Cβ (β-sheet) peak (figure 10(d)). The intensity reduction of Gly Cα and Glx Cγ peaks was systematic and more pronounced at heavier doping. This is an indication that heavy I2 doping introduces chemisorbed I2 into the amorphous, and to a certain degree, the crystalline regions. This is in contrast with the case of lightly I2-doped silk where only the amorphous regions are affected, and only minimally.
FTIR spectroscopy of spider silk
FTIR spectra of the original and I2-treated silk provide information of conformational changes with heavy I2 doping, as shown in figure 11. The spectrum of the I2-doped silk fiber lacks any C–I stretching signature bands in the 500–600 cm−1 region. The most significant conformational changes are observed in the  stretching amide I region (1700–1600 cm−1), and the region of C–N stretching and N–H in-plane bending or amide II region (1600–1500 cm−1), both associated with secondary structure. The amide I region envelopes a multitude of single bands with different frequencies due to secondary structure elements from hydrogen bonding of
  to the peptide N–H group [24]. However, generally this region is associated with three major vibrational components: α-helices (1649–1658 cm−1), intermolecular β-strands or β-sheets (1620–1635 cm−1), and turns (1665–1690 cm−1) [25]. β-sheets and α-helices are associated with bands at ∼1515 and ∼1550 cm−1 of the amide II region, respectively. While doping at room temperature (light I2 doping) did not change the secondary structure, doping at 70 °C (heavy I2 doping) caused a major decrease in the content of β-sheets, approximately from 54% to 42%, as shown by the decrease of the ∼1515 and ∼1625 cm−1 bands.
Figure 11.
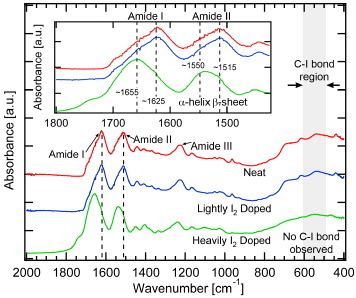
FTIR spectra of neat (top red curve), lightly I2-doped (middle blue curve) and heavily I2-doped (bottom green curve) N. clavipes silk fibers. Inset: reduction of β-sheet band relative intensity at ∼1625 (I) and ∼1515 cm−1 (II) and increase of α-helix band relative intensity at ∼1655 (I) and ∼1550 cm−1 (II), in the amide I and II regions. No C–I bond is observed within the expected region (gray area) in any case.
It is likely that at 70 °C, there is a water-induced thermal glass-transition that enables chain mobility such as in case of Bombyx mori [26]. At this temperature the water molecules act as plasticizers for the fiber. Hence, while at room temperature the iodide ions were mainly reaching the outer surface of the silk fibers, doping at 70 °C allows diffusion through the intermolecular chains of the amorphous regions and partially into the β-sheet layers. I2 (possibly in multiple forms of anions and molecular iodine) initially trapped within the β-sheets regions made some of the β-sheets unstable, most probably via association around the N–H… hydrogen bonding, converting part of the β-sheets into amorphous phases. The FTIR spectra in figure 11 support the notion that hydrogen bonding in the silk structure is partially suppressed by heavy I2 doping. This is also consistent with the observed intensity reduction for the Ala Cβ (β-sheet) peak in the MAS-NMR spectra (figure 10(d)).
Qualitative I2-spider silk interaction model
Based on the TGA, MAS-NMR and FTIR results, we propose a qualitative model for the interaction between I2 and the spider silk structure that includes these scenarios (shown schematically in figure 12): (a) I2 forms complexes in between the amorphous chains; (b) hydrogen-bond breaking by I2 diffusion into the β-sheet partially destabilizes and amorphizes some of β-sheets. Both (a) and (b) can lead to improved properties of the pyrolized I2-doped silk fiber. (c) Because of the naturally absorbed water in the spider silk, iodine may interact with the absorbed water in the amorphous part of the silk fiber to generate additional ions. This is consistent with the improvement of the conductivity of I2-doped silk fiber.
Figure 12.
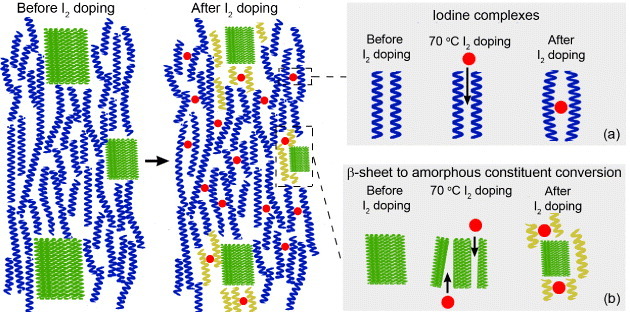
Schematic of neat and I2-doped spider silk, and proposed I2-silk interaction mechanisms. Left: general spider fibroin structure before I2 doping showing β-sheet crystallites (green rectangles) connected by amorphous chains composed of 31 helices (blue coils). Right: spider fibroin structure after I2 doping showing (a) iodine (red dots) complexes between the amorphous chains, and (b) conversion of some part of β-sheet into additional amorphous constituents (yellow coils).
Implicit in the model above is the assumption that I2 mostly remains in the amorphous regions of the silk fiber structure after partial destabilization of β-sheet regions. This view is supported by MAS-NMR where I2 is mainly present in the amorphous part of the silk fiber, only partially affecting the β-sheet region; and FTIR where the β-sheet content is reduced and the amorphous content increases. Therefore, only the resulting amorphous region remains doped. This is in contrast to other systems such as Nylon-6, where the I2 doping affects the system homogeneously throughout the backbone chain [27, 28]. In the case of Nylon-6, the doping increased the conductivity up to ∼10−3 S cm−1. The overall resistance of spider silk may therefore be qualitatively modeled as having a random resistor network consisting of the tunable resistivity R1 of the amorphous part and non-tunable resistivity R2 of the β-sheet crystallites. Even though R1 can be tuned, if R2 remains high then the overall conductivity is limited by R2.
The iodine complex that forms in the amorphous chains leads to a larger bundle and/or ribbon-like structure. The trapped iodine can effectively change the interchain hydrogen bonding into iodine complexes that favor interchain van der Waals C–C interactions upon pyrolization. Hence, after pyrolization, the heavily I2-doped silk will have a more intact structure with more flexibility than for pyrolized neat silk.
Conclusions
One objective of the present work is to address the use of native spider silk fibers for the purpose of sensing and electrical conductivity applications. A number of properties including the conductivity response to humidity and polar solvents, metal coating to produce μm-sized elastic metallic wires, the effects of I2 doping, pyrolization for incandescent filament materials, and thermoelectricity were explored. We found that the adherence of thin sputtered gold films to the surface of spider silk bundles was unusually strong, allowing their use as flexible, conducting electrodes for the measurements of solid-state phenomena such as the superconducting transition in an organic superconductor. Functional relationships were developed to describe the enhanced conductivity of neat silk fiber in response to polar solvents, including the exponential dependence on relative humidity, and polarity index for polar solvents. Some specific effects of I2 doping of spider silk, namely the small incremental increase of conductivity, and the higher yield and more robust nature of the carbonized product, stimulated a number of fundamental questions. These properties of silk fiber were correlated with MAS-NMR and FTIR spectra to determine changes in the amino-acid configurations on the protein backbone and in the secondary structure, respectively. On the basis of the MAS-NMR and FTIR spectra, some of the observed effects can be qualitatively explained by considering the preferential interaction model of external molecules with the amorphous (helical) structure, which is enhanced after partial transformation of the crystalline (beta) regions. For the slight improvement of I2-doped silk fiber, we considered a random resistor network model with two types of resistors where only one type of resistor (the amorphous region of the silk) is tunable by I2 doping. The improvement of carbon yield and flexibility of pyrolized I2-doped silk observed from TGA and SEM analysis was attributed to the presence of iodine complex in between the amorphous chains and to the partial destabilization of β-sheet region, as observed in MAS-NMR and FTIR spectra, which accelerates the polymerization process through dehydrogenation similar to the case of coal tar pitch. Finally, there was an indication that the strong gold adherence was facilitated by Pro Cγ and Ala Cβ (helix) sites within the amorphous region of the silk. This work should serve as a roadmap for future studies on functionalized natural and synthetic protein polymers for use in unconventional applications.
Acknowledgment
ES is supported by NSF-DMR 1005293. A portion of this work was performed at the National High Magnetic Field Laboratory, which is supported by NSF Cooperative Agreement No. DMR-0654118, by the State of Florida and by the DOE. We like to thank HPMI for the access to the SEM and TGA facilities. We also thank Dr Jhunu Chatterjee for the support in conducting the TGA experiments and the suggestion for PVA coating. Finally, we thank Johan Torres for taking the SEM image of the gold-sputtered spider silk.
References
- Xu M. and Lewis R V. Proc. Natl Acad. Sci.USA. 1990;87:7120. doi: 10.1073/pnas.87.18.7120. [DOI] [PMC free article] [PubMed] [Google Scholar]
- Hinman M B. and Lewis R V. J. Biol. Chem. 1992;267:19320. [PubMed] [Google Scholar]
- van Beek, Hess S, Vollrath F. and Meier B H. Proc. Natl Acad. Sci.USA. 2002;99:10266. doi: 10.1073/pnas.152162299. [DOI] [PMC free article] [PubMed] [Google Scholar]
- Gosline J M, Guerette P A, Ortlepp C S. and Savage K N. J. Exp. Biol. 1999;202:3295. doi: 10.1242/jeb.202.23.3295. [DOI] [PubMed] [Google Scholar]
- Savage K N. and Gosline J M. J. Exp. Biol. 2008;211:1937. doi: 10.1242/jeb.014217. [DOI] [PubMed] [Google Scholar]
- Liu Y, Sponner A, Porter D. and Vollrath F. Biomacromolecules. 2008;9:116. doi: 10.1021/bm700877g. [DOI] [PubMed] [Google Scholar]
- Liu Y, Shao Z. and Vollrath F. Biomacromolecules. 2008;9:1782. doi: 10.1021/bm7014174. [DOI] [PubMed] [Google Scholar]
- Hawthorn A C. and Opell B D. Biol. J. Linn. Soc. 2002;77:1. doi: 10.1046/j.1095-8312.2002.00099.x. [DOI] [Google Scholar]
- Work R W. J. Arachnol. 1981;9:299. [Google Scholar]
- Perez-Rigueiro J, Elices M. and Guinea G V. Polymer. 2003;44:3733. doi: 10.1016/S0032-3861(03)00245-3. [DOI] [Google Scholar]
- Liu Y, Shao Z. and Vollrath F. Nat. Mater. 2005;4:901. doi: 10.1038/nmat1534. [DOI] [PubMed] [Google Scholar]
- Agnarsson I, Boutry C, Wong S C, Baji A, Dhinojwala A, Sensenig A T. and Blackledge T A. Zoology. 2009;112:325. doi: 10.1016/j.zool.2008.11.003. [DOI] [PubMed] [Google Scholar]
- Kirkpatrick S. Rev. Mod. Phys. 1973;45:574. doi: 10.1103/RevModPhys.45.574. [DOI] [Google Scholar]
- Shao Z. and Vollrath F. Polymer. 1999;40:1799. doi: 10.1016/S0032-3861(98)00266-3. [DOI] [Google Scholar]
- Khan M M R, Gotoh Y, Morikawa H, Miura M, Fujimori Y. and Nagura M. Carbon. 2007;45:1035. doi: 10.1016/j.carbon.2006.12.015. [DOI] [Google Scholar]
- Kajiura H, Tanabe Y. and Yasuda E. Carbon. 1997;35:169. doi: 10.1016/S0008-6223(96)00133-9. [DOI] [Google Scholar]
- Stalcup T F, Brooks J S. and Haddon R C. Phys. Rev. 1999;60(B):9309. doi: 10.1103/PhysRevB.60.9309. [DOI] [Google Scholar]
- Simmons A, Ray E. and Jelinski L W. Macromolecules. 1994;27:5235. doi: 10.1021/ma00096a060. [DOI] [Google Scholar]
- Hijirida D H, Do K G, Michal C, Wong S, Zax D. and Jelinski L W. Biophys. J. 1996;71:3442. doi: 10.1016/S0006-3495(96)79539-5. [DOI] [PMC free article] [PubMed] [Google Scholar]
- Simmons A H, Michal C A. and Jelinski L W. Science. 1996;271:84. doi: 10.1126/science.271.5245.84. [DOI] [PubMed] [Google Scholar]
- Creager M S, Jenkins J E, Thagard-Yeaman L A, Brooks A E, Jones J A, Lewis R V, Holland G P. and Yarger J L. Biomacromolecules. 2010;11:2039. doi: 10.1021/bm100399x. [DOI] [PMC free article] [PubMed] [Google Scholar]
- Yang Z, Liivak O, Seidel A, LaVerde G, Zax D B. and Jelinski L W. J. Am. Chem. Soc. 2000;122:9019. doi: 10.1021/ja0017099. [DOI] [Google Scholar]
- Holland G P, Lewis R V. and Yarger J L. J. Am. Chem. Soc. 2004;126:5867. doi: 10.1021/ja031930w. [DOI] [PubMed] [Google Scholar]
- Barth A. Biochim. Biophys. Acta. 2007;1767:1073. doi: 10.1016/j.bbabio.2007.06.004. [DOI] [PubMed] [Google Scholar]
- Rabotyagova O S, Cebe P. and Kaplan D L. Biomacromolecules. 2009;10:229. doi: 10.1021/bm800930x. [DOI] [PubMed] [Google Scholar]
- Hu X, Kaplan D. and Cebe P. Macromolecules. 2008;41:3939. doi: 10.1021/ma071551d. [DOI] [Google Scholar]
- Hishinuma M. and Yamamoto T. J. Mater. Sci. Lett. 1984;3:799. doi: 10.1007/BF00727977. [DOI] [Google Scholar]
- Yamamoto T, Sugimoto H. and Hishinuma M. J. Mater. Sci. 1986;21:604. doi: 10.1007/BF01145530. [DOI] [Google Scholar]


