

Abstract
Successful climate change mitigation will involve not only technological innovation, but also innovation in how we understand the societal and individual behaviors that shape the demand for energy services. Traditionally, individual energy behaviors have been described as a function of utility optimization and behavioral economics, with price restructuring as the dominant policy lever. Previous research at the macro‐level has identified economic activity, power generation and technology, and economic role as significant factors that shape energy use. However, most demand models lack basic contextual information on how dominant social phenomenon, the changing demographics of cities, and the sociocultural setting within which people operate, affect energy decisions and use patterns. Here we use high‐quality Suomi‐NPP VIIRS nighttime environmental products to: (1) observe aggregate human behavior through variations in energy service demand patterns during the Christmas and New Year's season and the Holy Month of Ramadan and (2) demonstrate that patterns in energy behaviors closely track sociocultural boundaries at the country, city, and district level. These findings indicate that energy decision making and demand is a sociocultural process as well as an economic process, often involving a combination of individual price‐based incentives and societal‐level factors. While nighttime satellite imagery has been used to map regional energy infrastructure distribution, tracking daily dynamic lighting demand at three major scales of urbanization is novel. This methodology can enrich research on the relative importance of drivers of energy demand and conservation behaviors at fine scales. Our initial results demonstrate the importance of seating energy demand frameworks in a social context.
Keywords: Energy Use, Climate Change Mitigation, Human Dimensions, Remote Sensing
Key Points
Science‐quality VIIRS night‐sky products can capture short‐term changes in energy service demand
We explore the influence of cultural, socioeconomic, and geopolitical groupings on energy use patterns
We conclude that energy decision‐making and demand is both an individual and sociocultural process
1. Introduction
Much attention has been given to the role of technology, economics, and individual behavior in the attenuation of global energy demand [Lijesen, 2007; Stern, 2007; Wilson and Dowlatabadi, 2007; Gillingham et al., 2009; Popp et al., 2009; Stern, 2014], a key component of cost‐effective climate change mitigation scenarios [Clarke et al., 2014]. Empirical research from economics and psychology primarily focuses on energy decision making as a rational, individual process [Wilson and Dowlatabadi, 2007]. Factors such as income, demographics, life stage, and ethnicity have been identified as having a statistically significant impact on energy use [Lutzenhiser, 1993; O'Neill et al., 2010]. However, individual decision models are insufficient to explain energy use [Lutzenhiser, 2002; Shove, 2003]. Energy consumption—both total and peak demands—is also the result of energy behaviors shaped by the routines [Lutzenhiser, 1993], social norms [Schultz, 2002], habits [Steg and Vlek, 2009], and values of a culture [Shove, 2003]. Sociological theoretical frameworks are founded on this distinction [Lutzenhiser, 1993; Wilhite et al., 2000], but measurement of the embeddedness of energy service demand in social and cultural contexts has been empirically elusive [Chester et al., 2014; Romero‐Lankao et al., 2014].
During holidays aggregate energy behaviors change, which in turn affects the timing and location of demand for energy services. For lighting, these changes in demand are now apparent from night‐sky imagery. Here, we examine variations in urban lighting patterns across cultural and social boundaries for cities in the Southern United States (US), Northern Mexico, and the Middle East during two major holiday periods: (1) Christmas and New Year's and (2) the Holy Month of Ramadan.
We processed 36 months of daily night‐lights data, from early 2012 to late 2014, based on remotely sensed estimates acquired from the visible infrared imaging radiometer suite (VIIRS) day/night band onboard the Suomi National Polar Orbiting Partnership (NPP) satellite [Miller et al., 2013; Cao and Bai, 2014]. In previous studies, the magnitude of satellite‐derived nighttime lights have served as a spatial proxy for total electricity use [Elvidge et al., 1997; Townsend and Bruce, 2010], energy consumption [Letu et al., 2010], and greenhouse gas emissions [Elvidge et al., 1997; Doll et al., 2000]. Here, we take advantage of a new algorithm to estimate daily patterns of total lighting electricity usage (TLEU). The approach integrates cloud‐free, atmospheric‐, terrain‐, fire‐, lightning‐, snow‐, lunar‐ and straylight‐corrected radiances to estimate the nighttime luminosity at the time of the Suomi‐NPP satellite overpass. We used daily electric load profiles for different energy service sectors to convert the corresponding luminosity values to daily measures of total outdoor lighting electricity demand. Finally, we aggregated these estimates for all economic sectors to derive daily estimates of TLEU. The multilevel processing approach is described in Appendices B and C, and its quality and validity were established through comparisons with multi‐year time series data. This suite of science‐quality nighttime environmental products provides new information on the magnitude and signature of daily, weekly, and seasonal energy service demand, at the native VIIRS resolution (750 m), and with rigorous quality assurance and uncertainty information.
2. Patterns of Energy Service Demand During Christmas and New Years
At the national scale, the U.S. cyclical holiday TLEU signal (ΔCS)—obtained using a seasonal‐trend decomposition procedure based on Loess [Cleveland et al., 1990]—is shown to uniformly increase across cities (Figures 1a and 2a–c). Despite being ethnically and religiously diverse, the United States has a holiday increase in TLEU that is present across most communities—indicative that it is a civil holiday, as well as a religious one. Lighting patterns, therefore, track this national shared tradition. Although a larger portion of sampled cities in Northern Mexico (33%) experienced significant changes in TLEU (>5%) compared to the United States (22%) (Figure 3), Northern Mexico's cyclical signal (Figure 1b) was not as ubiquitous as the U.S. signal.
Figure 1.

Normalized annual signature of cyclical component of total light energy usage TLEU (solid‐blue line) across sampled cities (filled black circles) in six regions: (a) Southern United States (n = 70); (b) Northern Mexico (n = 30); (c) Saudi Arabia (n = 9); (d) Turkey (n = 26); (e) Egypt (n = 22); and (f) Iraq (n = 21). The corresponding holiday period range is also shown by dashed red lines for comparison.
Figure 2.

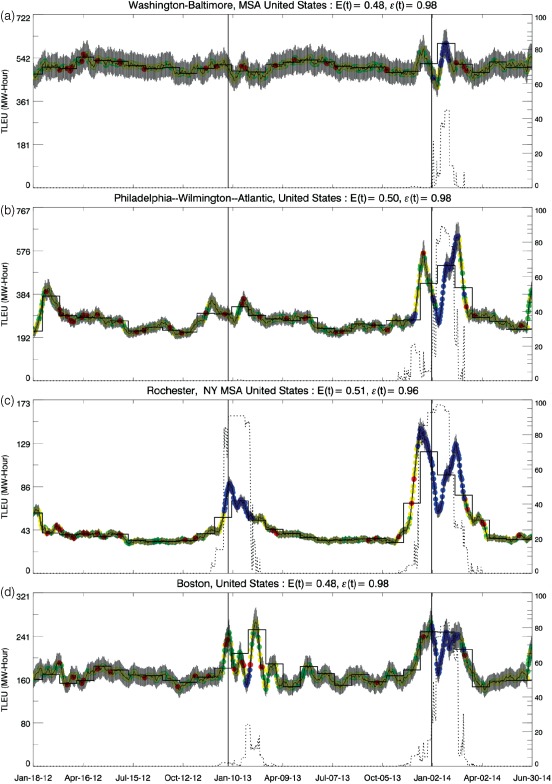
(Left‐axis) Time series of total lighting electricity usage (TLEU) for a selection of cities in the South Continental U.S. and Northern Mexico. Green and yellow circles indicate snow‐free daily TLEU retrievals using the primary (full‐inversion) and backup (magnitude‐inversion) algorithms, respectively. Red circles indicate poor‐quality spatial‐temporal gap filled values. New Years' day (1 January 2013 and 2014) is shown by solid black lines. (Right‐axis) MODIS‐derived daily snow cover fraction shown in black dotted lines. Summary statistics [E,ϵ ] are provided for each city (see Appendix C).
Figure 3.

Relative changes in total light electricity use (ΔTLEU = TLEUHoliday ÷ TLEURest of Year ) during the Christmas and New Years' season for sampled cities in the Southern United States and Northern Mexico.
Variations in urban lighting patterns during the Christmas and New Year holidays also differ across residential contexts. We illustrate this effect in Figures 4 and 5, where holiday activity is shown to peak in the suburbs and peri‐urban areas of major Southern US cities (ΔTLEU > 1.0), where Christmas lights are prevalent. In contrast, most central urban districts, with compact dwelling types affording less space for light displays, experience a slight decrease or no change in energy service demand (ΔTLEU ≤ 1.0).
Figure 4.

Regional subset of relative change in TLEU shown for Christmas and New Years in the South Eastern United States.
Figure 5.

Regional subset of relative change in TLEU shown for Christmas and New Years in the South Western United States.
3. Patterns of Energy Service Demand During Ramadan
In contrast to Western Holidays, the Holy Month of Ramadan does not involve a shift in setting or location as much as a shift of daily activities in time. This makes Ramadan in the Middle East an ideal setting for the observation of energy behaviors occurring at the same time of Suomi‐NPP's satellite overpass (01:30 A.M., local time). Electricity usage for lighting is therefore expected to change as prayer and eating during the Holiday shifts later into the night. We show that variations in energy use between cities during Ramadan indicate different religions as well as cultural observance practices. Cities in majority‐Muslim countries have different TLEU signatures than cities in Middle‐Eastern Jewish countries, typified by lighting peaks during and slightly after the 30 days of Ramadan (Figures 6, 7, 8). The cyclical Ramadan signal was also found to vary significantly across Muslim countries. For example, Saudi Arabia's cities consistently peaked during both the Ramadan period and the Hajj (Figure 1c); but light signals in Turkey varied between cities (Figures 1d and 9).
Figure 6.
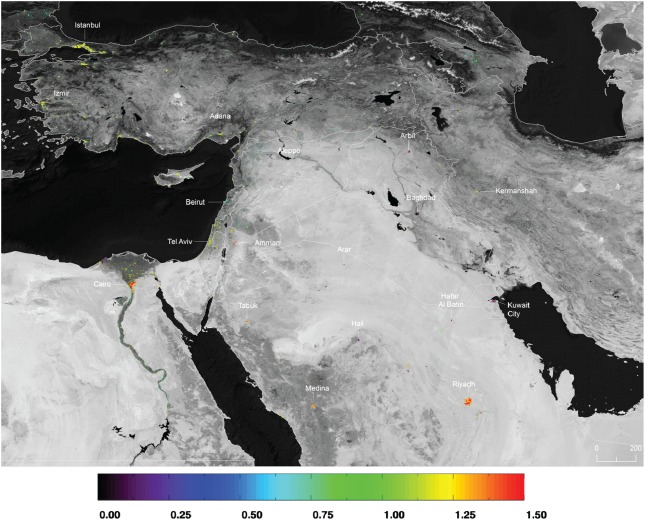
Regional subset of relative change in TLEU shown for the Holy Month of Ramadan in the Middle East.
Figure 7.
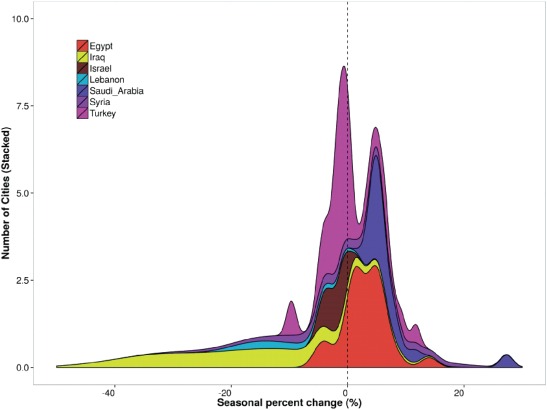
Stacked histogram of relative changes in total light electricity use (ΔTLEU = TLEUHoliday ÷ TLEURest of Year) for sampled cities in : (a) the United States and Mexico during Christmas and New Years; and (b) Middle Eastern countries during Ramadan.
Figure 8.

Relative changes in total light electricity use (ΔTLEU = TLEUHoliday ÷ TLEURest of Year) during Ramadan for sampled cities in the Middle East.
Figure 9.

Time series of total lighting electricity usage (TLEU) for a selection of cities in the Middle East. Green and yellow circles indicate snow‐free daily TLEU retrievals using the primary (full‐inversion) and backup (magnitude‐inversion) algorithms, respectively. Red circles indicate poor‐quality spatial‐temporal gap filled values. New Years' day (1 January 2013 and 2014) is shown by solid black lines. (Right‐axis) MODIS‐derived daily snow cover fraction shown in black dotted lines. Summary statistics [E,ϵ] are provided for each city (see Appendix C).
In contrast to daytime satellite measurements and derived products, the VIIRS TLEU patterns not only reveal information about infrastructure use and availability, but also its location. For instance, muslim middle‐eastern cities with no consistent Ramadan signal (ΔTLEU < 1.0) had complicating factors that interrupted energy service demand signals. Negative cyclical trends during Ramadan were prevalent in middle‐eastern cities with highly vulnerable electrical power infrastructure. For example, cities across Lebanon and Iraq have uniform cyclical summer decreases in TLEU (average ΔCS = −15%) that are likely related to increases in demand for air‐conditioning and appliance loads (Figure 1f) [Kharrufa, 2008; Dagher and Ruble, 2011]. In Syria, Iraq, and Palestinian cities, regional conflict also played a major role in changes in energy service supply and demand (Figures 10a, 11, and 12).
Figure 10.

Time series of total lighting electricity usage (TLEU) for a selection of cities in the Israel and Palestinian Territories. Green and yellow circles indicate snow‐free daily TLEU retrievals using the primary (full‐inversion) and backup (magnitude‐inversion) algorithms, respectively. Red circles indicate poor‐quality spatial‐temporal gap filled values. New Years' day (1 January 2013 and 2014) is shown by solid black lines. (Right‐axis) MODIS‐derived daily snow cover fraction shown in black dotted lines. Summary statistics [E,ϵ] are provided for each city (see Appendix C).
Figure 11.

Time series of total lighting electricity usage (TLEU) for a selection of cities in the Syria. Green and yellow circles indicate snow‐free daily TLEU retrievals using the primary (full‐inversion) and backup (magnitude‐inversion) algorithms, respectively. Red circles indicate poor‐quality spatial‐temporal gap filled values. New Years' day (1 January 2013 and 2014) is shown by solid black lines. (Right‐axis) MODIS‐derived daily snow cover fraction shown in black dotted lines. Summary statistics [E,ϵ] are provided for each city (see Appendix C).
Figure 12.

Time series of total lighting electricity usage (TLEU) for a selection of cities in the Iraq. Green and yellow circles indicate snow‐free daily TLEU retrievals using the primary (full‐inversion) and backup (magnitude‐inversion) algorithms, respectively. Red circles indicate poor‐quality spatial‐temporal gap filled values. New Years' day (1 January 2013 and 2014) is shown by solid black lines. (Right‐axis) MODIS‐derived daily snow cover fraction shown in black dotted lines. Summary statistics [E,ϵ] are provided for each city (see Appendix C).
Striking downturns in TLEU occurred in 2012 in the Syrian cities of Damascus (−50%) and Aleppo (−94%), corresponding to the onset of major military confrontations (7/15 and 7/23, respectively) (Figure 11). These declining patterns are consistent with regional assessments performed across Syrian cities using monthly nighttime lights composites acquired from the Defense Meteorological Satellite Program's Operational Linescan System (DMSP‐OLS) [Li and Li, 2014]. However, the VIIRS results indicate a more pronounced decline in energy service demand (−20%) compared to the DMSP‐OLS estimates for the same time period (2012–2014). This shows qualitative similarity in response to the energy declines across Syria, with quantitative differences indicating higher sensitivity of the VIIRS TLEU data to sub‐pixel nighttime lights sources. Iraq cities captured by the Islamic State in Iraq and Syria (ISIS) in 2014 (e.g., Mosul, Tikrit, Tal Afor, Ramadi) also showed marked average decreases in energy service provision (−84% since 1 April 2014) compared to their unoccupied counterparts, for example, Baghdad and Sulaimaniya (+6%) (Figure 12).
4. Patterns in Energy Behaviors Across Different Sectors in Egypt
In Egypt, communities with similar political affiliations were found to have similar TLEU patterns, demonstrating that energy patterns cluster based on sociopolitical groupings. We examined the correlation between variations in TLEU and the vote share for three major political blocs that participated in the Egyptian parliamentary elections that were held in 2011–2012. These included: (1) the Al‐Nour Party, an ultra‐conservative Islamist party maintaining a strict version of Islam, known as the Salafi methodology; (2) the religiously moderate Freedom and Justice Party (FJP) (better known as the Muslim Brotherhood); and (3) the main liberal parties (Egyptian Bloc and Al‐Wafd). To obtain a better understanding of the impact of the sociodemographic profile of Egypt's electoral constituencies, we used a classification scheme created by Erle et al. [2011], which partitions Egypt's proportional system districts [SJCE, 2011] into clusters based on voting outcomes, sanitation, and illiteracy (Table 1). We then performed a multiple linear regression using the voting and socioeconomic variables to predict average change in TLEU over 21 electoral districts in Egypt during three Ramadan periods (2012–2014, Figure 13). Results in Table 2 show that social clusters with shared voting preferences and socioeconomic standing in Egypt also shared similar lighting patterns during Ramadan (R 2 = 0.5038, P < 2.83 × 10⁻⁵). The Ramadan time series of TLEU profiles reveal how different socioeconomic groups use energy differently. For instance, districts classified as “Rich” (Figure 13a) observed an early and sustained Ramadan peak signal, while “Poor” and “Very Poor” voting districts (Figures 13d and 13e) did not show a peak signal until the end of Ramadan, when the “Eid ul‐Fitr” (or Feast of Breaking the Fast) takes place. Patterns of energy service demand are therefore capturing a diverse range of sociopolitical influences; whereas physically driven patterns of infrastructure existence (e.g., urban land cover and impervious area distribution maps) are naturally binary.
Table 1.
Egypt Proportional System Districts Organized by Clusters of Electoral Constituencies [Erle et al., 2011], and Percentage of Parliamentary Election (2011–2012) Votes Received by Major Party Blocs Out of Votes Cast in Each District [SJCE, 2011]
| Social Cluster | Election District | Al‐Nour (%) | FJP (%) | Egyptian Block and Al‐Wafd (%) | % Illiteracy | % Non‐Public Sanitation |
|---|---|---|---|---|---|---|
| Rich | Alexandria (1) | 29.85 | 34.41 | 22.42 | 14 | 1 |
| Cairo (1) | 15.39 | 39.45 | 29.73 | 22 | 5 | |
| Cairo (2) | 11.31 | 35.65 | 31.98 | 19 | 1 | |
| Cairo (4) | 19.35 | 40.48 | 20.46 | 16 | 1 | |
| Middle One | Daqahliyya (1) | 26.91 | 30.43 | 14.07 | 27 | 5 |
| Gharbiya (1) | 29.73 | 28.67 | 21.19 | 27 | 40 | |
| Gharbiya (2) | 28.90 | 37.59 | 22.02 | 27 | 30 | |
| Ismailia | 27.63 | 38.19 | 14.05 | 23 | 50 | |
| Port Said | 20.69 | 32.66 | 23.54 | 16 | 5 | |
| Sharqiya (1) | 26.55 | 37.99 | 17.21 | 27 | 25 | |
| Middle Two | Alexandria (2) | 32.96 | 35.32 | 11.70 | 25 | 19 |
| Cairo (3) | 14.52 | 39.94 | 33.00 | 30 | 5 | |
| Damietta | 38.58 | 31.14 | 7.91 | 22 | 12 | |
| Giza (1) | 29.10 | 41.09 | 18.32 | 27 | 45 | |
| Giza (2) | 28.12 | 37.83 | 14.65 | 24 | 10 | |
| Poor | Beheira (1) | 40.01 | 35.69 | 13.16 | 39 | 40 |
| Sharqiya (2) | 20.80 | 36.54 | 17.76 | 36 | 53 | |
| Very Poor | Assiut (1) | 20.84 | 39.77 | 24.04 | 38 | 76 |
| Minya (2) | 28.09 | 35.77 | 26.27 | 44 | 85 | |
| Qena (2) | 19.16 | 26.03 | 12.62 | 40 | 87 | |
| Sohag (2) | 8.19 | 22.70 | 10.33 | 44 | 86 |
The values in Bold indicate the majority party that won each particular districts.
Percentage of parliamentary election (2011–2012) votes received by major party blocs out of votes cast in each district [SJCE, 2011]. These included: (1) the religiously conservative Al‐Nour Party, where Salafis represented its core constituency; (2) the religiously moderate Freedom and Justice Party (FJP), supported by the Muslim Brotherhood; and (3) the main liberal parties (Egyptian Bloc & Al‐Wafd). Poor districts were identified by a high share of illiteracy and a high share of non‐access to public sanitation. Conversely, the rich cluster of constituencies was characterized by a low share of illiteracy and a high share of access to public sanitation. The overall voter turnout was 54%.
Figure 13.

Normalized estimates of TLEU for 21 electoral districts in Egypt for the Ramadan periods of 2012–2014. Districts were divided into five sociopolitical clusters and the most populous six districts in each cluster are shown: (a) “Rich”; (b) “Middle One”; (c) “Middle Two”; (d) “Poor”; and (e) “Very Poor”. Population‐weighted averages for each cluster are also shown (solid black lines). The bottom right figure (f) shows the corresponding quality assurance results for all electoral districts. The latter is based on values associated with retrieval performance—i.e., “Full Inversion”, “Magnitude Inversion”, and “Gap Filled” (see Appendix C).
Table 2.
Summary Statistics of Multiple Linear Regression Model for Predicting TLEU During Ramadan Over 3 Years (2012–2014) From Voting and Socioeconomic Variables Available in 21 Electoral Districts in Egypt
| Multiple Regression Statistics | |
|---|---|
| R Square | 0.5605 |
| Adjusted R Square | 0.5038 |
| Standard Error | 3.66 |
| F‐statistic | 9.884 |
| P value | 2.83E‐05 |
| Coefficients | Standard Error | t Statistics | P value | |
|---|---|---|---|---|
| Intercept | −2.076 | 4.886 | −0.428 | 0.6738 |
| FJP | 27.059 | 10.384 | 2.606 | 0.014 |
| Illiteracy | 37.318 | 10.964 | 2.492 | 0.0183 |
| Sanitation | −15.232 | 3.1 | −4.914 | 2.75E‐05 |
| Al Nour | −13.614 | 7.877 | −1.728 | 0.0939 |
P values for each variable are shown in the last bottom column. Non‐access to public sanitation and conservative‐leaning voting preferences Al‐Nour had negative coefficients, while illiteracy rates and moderate‐leaning voting preferences FJP had positive coefficients.
5. Conclusions
The latest Intergovernmental Panel on Climate Change Working Group III report states that reducing energy demand is the key to minimize climate mitigation costs [Seto and Dhakal, 2014]. However, recent reviews emphasize a research “blindspot” in the human dimensions of global environmental change, including urban development pathways and public policies as drivers of and responses to climate change [Chester et al., 2014; Romero‐Lankao et al., 2014]. Accurate energy demand forecasting requires attention to the broader social contexts within which people operate, especially as these contexts change with globalization, economic development, and urbanization. We illustrate how the uniformities and variations between nighttime light signatures, as observed by the VIIRS instrument on Suomi NPP, can provide new insights into how energy behaviors, motivated by social incentives, vary across cultural boundaries. Our results also suggest that energy is providing services that enable social and cultural activities, and thus energy decision‐making patterns reflect social and cultural identities.
We demonstrate that individual factors such as poverty and irregular access to infrastructure services also affect energy behavior patterns, alongside macro‐cultural forces. The daily dynamic VIIRS TLEU retrievals are thus capturing the parts of a community's energy portfolio that are not only associated with individual behavior and decision‐making, but also with the energy required to live in a certain cultural context and to participate in the social and economic activities within that context. We conclude that research on energy conservation and energy decision‐making needs to be coupled with research about lifestyles, cultural norms, and demographics to better account for the broad societal forces impacting energy demand across all scales of urbanization.
Beyond the results of this study, the methodology developed in this paper has broader impacts on traditional energy demand research. Effective energy policies are currently limited by a lack of data that is both global in extent and local in resolution for understanding how the drivers of energy use and the available policy levers for reducing energy consumption may vary. A globally systemic assessment of these activity patterns will lead to improved understanding of neighborhood‐level energy intelligence, as well as conservation strategies that can be tailored to specific communities and sociocultural contexts.
Acknowledgments
The authors would like to thank Peter Ma and Jesse Allen (NASA/GSFC/SSAI) for their support on the figures; to Virginia Kalb (NASA/GSFC) and Zhuosen Wang (NASA/GSFC/ORAU) for their advice on the Suomi‐NPP VIIRS Day/Night Band algorithms; and to Adi Grief, Qingling Zhang, and Karen Seto (YALE/FES) for much useful discussions. The authors gratefully acknowledge support provided by NASA's Office of the Chief Scientist under the Science Innovation Fund (SIF); as well as NASA's Minority University Research and Education Program under grant NASA‐NNX13AR88H.
Remote Sensing Datasets
The latest science reprocessing (Collection V1.1) of the Suomi‐NPP VIIRS Sensor Data Records (SDRs), Land Intermediate Products (IPs), and Environmental Data Records (EDRs) was used in this study. These data sets employ the best available VIIRS instrument calibration and characterization results, as well as the latest available algorithm changes applied to the beginning of the VIIRS science mode operation (19 January 2014). The purpose of this reprocessing is to produce a suite of climate‐quality land data records that can provide observation continuity with NASA's Earth Observing System's Moderate Resolution Imaging Spectroradiometer (MODIS) instruments and further research in Earth System Science [Justice et al., 2013]. Developed as part of the Suomi‐NPP Land Collection V1.1 reprocessing are: (1) the VIIRS stray light corrected Day/Night Band Level 1B SDR (NPP_VDNE_L1); and (2) its corresponding Terrain‐Corrected Geolocation Swath IP (NPP_DNFT_L1). Both products are stored at the native VIIRS resolution (0.742 km) in 5‐min (∼2280 × 3000 km) data granules. The available Suomi‐NPP VIIRS day/night band data record—January 2012 to October 2014—was used in this study. All VIIRS data sets, quality assessment reports, and processing tools are publicly available (http://viirsland.gsfc.nasa.gov/).
Various Collection 5 (V005) data products from the MODIS instruments aboard NASA's Terra and Aqua satellites were also used as intermediate or ancillary data sources. The MODIS time series were selected because of their wide use as climate‐quality global land science products and/or the current lack of comparable data sets being generated from Suomi‐NPP VIIRS data. All MODIS data sets, quality assessment reports, and processing tools used in this study are publicly available (http://modis‐land.gsfc.nasa.gov/). The MODIS V005 BRDF/Albedo product suite (MCD43) [Schaaf et al., 2002; Schaaf et al., 2011] was used to quantify the relative contribution of natural versus anthropogenic sources and sinks of nighttime lights (NTL). The MODIS/Aqua V005 daily snow cover product [Hall et al., 2010] was used as a quality indicator of varying snow fraction. This was done to exclude snow‐contaminated samples from the final analysis. Both the MODIS V005 Land Cover product (MCD12) [Friedl et al., 2010] and the National Land Cover Database 2011 percent developed imperviousness products [Wickham et al., 2013; Xian et al., 2011] were used to estimate the proportion of urban land cover across the study locations.
Algorithm Theoretical Basis
Based on the previous techniques for estimating the surface upward radiance from artificial nighttime light sources [Cao et al., 2013; Johnson et al., 2013; Walther et al., 2013; Cao and Bai, 2014], a new retrieval approach to generate high‐quality daily time series of TLEU was created. The overarching hypothesis surrounding the retrieval of TLEU is that the Suomi‐NPP VIIRS day/night band's at‐sensor radiances, when corrected for the effects of the Earth's atmosphere, instrument artifacts, as well as extraneous light emission sources and sinks (e.g., lightning strikes, nighttime fires, and gas flares), act as snapshots on a predictable lighting electricity hourly load demand curve for the VIIRS pixel's energy service sector. This assumption is necessary because it is not known a priori what is the character and infrastructure base representing the satellite measurement, or how those patterns will change over time. The TLEU estimates obtained at the Suomi‐NPP time of overpass were then used to scale the magnitudes of the hourly load demand curves and compute time‐domain integrals to provide total daily estimates of TLEU. The multilevel processing approach is described in the following sections.
B1. Correction of Surface Reflectance Anisotropy Effects
The quantification of surface reflectance anisotropy effects is a critical step in ensuring accurate, stable, and traceable nighttime environmental products corrected for the effects of an illuminated scene throughout the entire lunar phase cycle. In order to fully exclude background noise resulting from a moon‐lit VIIRS scene, the Miller and Turner [2009] top‐of‐atmosphere (TOA) spectral irradiance model of the Suomi‐NPP VIIRS Day/Night Band (MT2009) was used to quantify the moon‐lit radiance contribution. The approach, introduced by Cao et al. [2013], and amended here to account for reflectance anisotropy effects (the original approach assumed a Lambertian surface without an atmosphere), expresses the spectral lunar radiance, L m(λ, Ω v, Ω m) (units of Watts m−2 sr−1) as follows:
where θm is the lunar zenith angle, and Em(λ) (units of Watts m−2) is the downwelling TOA sensor response function‐weighted lunar irradiance derived from the MT2009 model:
where IMT(λ) is the lunar irradiance spectra calculated from the MT2009 model and SRF(λ) is the spectral response function of the VIIRS Day/Night Band. The lunar bidirectional reflectance factor (BRF), BRF(λ, Ω v, Ω m), is dependent on wavelength (λ) and the viewing and lunar geometries (Ωv, Ωm), which are each defined by zenith and azimuthal angles (θ, ϕ ). Here, we define the lunar BRF as the ratio of the bidirectional reflectance distribution function (BRDF), an intrinsic quantity that describes the directional way radiation reflects from the surface to that of a perfect Lambertian reflector (i.e., BRF ≈ πBRDF) [Nicodemus, 1977; Schaepman‐Strub et al., 2006]. This quantity can be approximated from some set of satellite measurements of spectral radiance. More usefully, the satellite measurements can be used to parameterize a model of the surface BRDF. In this study, we adopted the “kernel‐driven” linear BRDF model named the RossThickLiSparse‐Reciprocal model, which relies on the weighted sum of an isotropic parameter and two kernels of viewing and illumination geometry [Roujean et al., 1992; Lucht et al., 2000; Schaaf et al., 2002]:
where K vol is the coefficient for the RossThick volume scattering kernel, K geo is the coefficient of the LiSparse‐Reciprocal geometric scattering kernel; and f x, are the RTLSR BRDF kernel model parameters obtained on a per‐pixel basis. RTLSR model parameters obtained over the visible spectral region (0.5–0.9 µm) were extracted from the MODIS V005 BRDF/Albedo product (MCD43)29 to match the Day/Night Band's SRF. Thus, L m(λ, Ω v, Ω m) is no longer strictly spectral lunar BRF, but rather an approximation to this over the particular band set. The lunar spectral BRF here is assumed to be an intrinsic surface property fully capable of describing the directional distribution of surface‐leaving lunar radiation [Schaepman‐Strub et al., 2006]. With this approach—routinely used in MODIS standard processing to correct the instrument's solar reflective bands to a standard view solar geometry—it is then possible to estimate the lunar radiance contribution at any point in time and under specific atmospheric conditions.
B2. Estimation of Nighttime Lights
The surface upward radiance from artificial nighttime light sources, L NTL (i.e., comprising nighttime lights from cities, suburban areas, rural villages, etc.) can be estimated using the following relationship [Johnson et al., 2013]:
where LDNB is the VIIRS Day/Night Band radiance at TOA, L path is the path radiance (i.e., the radiance generated by scattering within the atmosphere along the path of sight), a(θm) is the actual surface albedo (i.e., incorporating the directional influence of sky radiance and the multiple scattering effects between ground and atmosphere) [Román et al., 2010], ρa is the atmospheric backscatter, L m is the spectral lunar radiance, L m(λ, Ω v, Ω m), and T ↑(τ, θ m) and T ↑(τ, θ v) are the total transmittances (including direct and diffuse radiation) along the ground‐sensor and lunar‐ground paths, respectively. The latter two are a function of view‐lunar geometry and the total atmospheric column optical depth (τ ) due to mixed gases (i.e., CO2, CO, CH4, N2O, and O2), water vapor, and aerosol particles. The MODTRAN®5 radiative transfer code [Berk et al., 2004] was used to estimate the values of L path, ρa, T ↑(τ, θ m), and T ↑(τ, θ v) for a given set of nighttime surface and atmospheric conditions. MODTRAN®5 input parameters included the MODIR RTLSR BRDF model parameters and actual surface albedo values (extracted from MCD43), the 0.550 µm aerosol optical depth, and aerosol model retrievals (based on the 8‐day climatology) available from the VIIRS surface reflectance climate modeling grid product (NPP_SRFLIP_CMG) [Vermote et al., 2014], and atmospheric profiles obtained from the National Centers for Environmental Prediction (NCEP) Global Forecast System (GFS) (i.e., water vapor, ozone, and surface pressure) [Moorthi et al., 2001].
B3. Snow Masking and Adjustment for Seasonal Effects
The final step in the estimation of L NTL involves the use of a seasonally adjusted correction factor to account for the effects of vegetation phenology, and a fractional snow mask used to filter contaminated cases. For a large number of cities at mid‐to‐high latitudes, the presence of highly reflective snow introduces large positive biases during the winter season (see example cases in Figure B1). To ensure a uniform record of NTL, the MODIS/Aqua V005 daily snow cover product (MYD10) was used to select predominantly snow‐free cities—defined here as having a majority fractional snow cover <20% for the entire Suomi‐NPP observing period [Hall et al., 2010]. With this snow filter, the increase in artificial sky brightness by snow reflection of NTL is estimated to be within an error margin of <6% [Cinzano et al., 2000]. Additional quality‐assurance checks were also performed to ensure that the VIIRS NTL values affected by residual snow cover were flagged as poor‐quality retrievals.
Figure B1.
Time series of total lighting electricity usage (TLEU) for a selection of cities in the Northeast United States. Green and yellow circles indicate snow‐free daily TLEU retrievals using the primary (full‐inversion) and backup (magnitude‐inversion) algorithms, respectively. Red circles indicate poor‐quality spatial‐temporal gap filled values. New Years' day (1 January 2013 and 2014) is shown by solid black lines. (Right‐axis) MODIS‐derived daily snow cover fraction shown in black dotted lines. Summary statistics [E,ϵ] are provided for each city (see Appendix C). In addition, blue circles indicate snow‐contaminated TLEU values. For the purposes of this study, only cities that did fell under a MODIS fractional snow cover threshold of <20% were used in the analysis.
Another source of measurement error in the retrieval of TLEU is the increase in canopy‐level foliage during the spring and summer months. In contrast to snow‐covered surfaces, this effect results in a negative bias in L NTL relative to the rest of the year; particularly for observed radiances where deciduous broadleaf canopies are present [Elvidge et al., 1999]. In this study, a modified version of the vegetation‐adjusted NTL urban index (VANUI) [Zhang et al., 2013] was developed based on monthly composites of the MODIS V005 Nadir BRDF‐adjusted (Red and NIR) reflectance product (NDVINBAR) [Schaaf et al., 2002]:
where
This seasonally adjusted VANUI index eliminates retrieval biases by normalizing L NTL by the annual (L NTL(a 0)) and monthly minimums (L NTL(a 1)), and constraining the latter as a function of the normalized difference vegetation index (NDVI) [Tucker, 1979]. The VANUI factor has also been shown to improve mapping of within‐city variations in NTL values [Zhang et al., 2013] .
B4. Retrieval of Total Lighting Electricity Usage
The luminosity of human settlements at the time of the Suomi‐NPP satellite overpass, YNTL(t0) (units of Watts), was estimated using the inverse‐square law:
where γ is the area of a native VIIRS Day/Night Band pixel (0.742 × 0.742 km). To relate luminosity to TLEU, the latter was normalized by Y NTL(t 0) using hourly estimates of outdoor lighting electricity usage at the Suomi‐NPP VIIRS overpass time. The results were then used to scale the magnitude of lighting load demand curves available for different service sectors [CEC, 2013; National Grid, 2013; NREL, 2013] (Figure B2). These functions were weighted by their prevalence in the U.S. lighting sector, and were integrated over 24 h to give an estimate of total daily lighting lumens per sector. Each sector's total lumens were then converted to watts, using the average luminous efficacy of each U.S. infrastructure sector, and then aggregated for all sectors to compute estimates of TLEU [units of Watt · hr]:
where t0 is the time of the Suomi‐NPP satellite overpass, F out is the proportion of total outdoor lighting demand, and F tot is the proportion of total lighting demand; both integrated over a 24‐h period. Since U.S.‐specific electric load curves were used, the accuracy of actual wattage estimates will vary across urban settings. Previous work that uses nighttime lights to approximate energy use has relied on a spatial proxy method, where the distribution of light is correlated to the distribution of electricity consumption [Small et al., 2011]. As an alternative, this study attempts to measure lighting electricity use directly by fusing regional utility TLEU data with VIIRS NTL data, and is currently constrained by the lack of available end‐use disaggregated utility data in other parts of the world. Note that the VIIRS TLEU retrievals are not intended to capture the full complexity of energy portfolios that make up a city's infrastructure. Instead, these measurements allow for a detailed assessment of the broader forces that shape energy consumption behaviors and patterns and the scales at which they operate.
Figure B2.

Total and sectoral daily lighting load curves. Daily electric load profiles for U.S. economic sectors. Overpass estimates of total outdoor lighting (as seen from the VIIRS) are used to scale load profiles, estimating hourly and total lighting electricity usage for hours not captured.
Quality Assessment and Uncertainty Metrics
VIIRS TLEU time series quality was established by providing incremental values associated with retrieval performance; i.e., “Full Inversion”, “Magnitude Inversion”, “Snow‐Contaminated”, and “Gap Filled”. The following four measures were used to estimate the sensitivity of the TLEU retrieval process to errors in the upstream input parameters: (1) the model‐fits errors and angular sampling uncertainty of the MODIS BRDF/albedo inversion [Shuai et al., 2008]; (2) the uncertainty of the MT2009 lunar irradiance model for Day/Night Band observations [Miller and Turner, 2009; Walther et al., 2013]; (3) the quality of the VIIRS Cloud Mask (NPP_CMIP_L2) nighttime cloud detection layer; and (4) the uncertainties in the VIIRS Land Surface Reflectance aerosol and model retrievals [Vermote et al., 2014].
When insufficient observations are available to apply a “Full Inversion” or “Magnitude Inversion”, a combined spatial and temporal gap filling technique [Tan et al., 2011] was used to obtain a low‐quality TLEU result. The technique employs autoregressive forecasting and backcasting [Von Storch and Zwiers, 2001] to extrapolate residual gaps in the time series and compute a 14‐day moving average for each grid cell and emphasizing the middle date of observations. The primary reasons for the latter are to remove within‐week fluctuations (e.g., weekday versus weekend trends), to ensure that each TLEU value retains a correct trajectory (i.e., high‐quality retrievals must be present on both dates preceding and following each target observation), and to constrain temporal outliers nested in the data. Retrieval gaps can result from a combination of factors, including: (1) cloud‐contaminated radiances, (2) poor‐quality Lunar BRDF, aerosol optical properties, and/or surface reflectance values (e.g., due to persistent clouds or heavy aerosol loadings), (3) outliers from residual stray‐light contamination, and/or (4) short‐term periods of missing data due to instrument anomalies (e.g., spacecraft maneuvers). Results in Figures 2, 9, 10, 11, 12, 13f and B1 illustrate how the quality assurance scheme is applied at the daily temporal scales across a range of sampled cities of different urban form, scale, and economic base.
Finally, for each sample, the availability and distribution of high‐quality TLEU estimates were estimated using two summary statistics:
where E is the proportion of best quality TLEU estimates over period n (where n = the entire Suomi‐NPP data record), and ϵ is the corresponding measure sampled every 7 days. From a statistical analysis of TLEU retrievals over a broad range of conditions, we established an upper range threshold of [E,ϵ] = [0.50, 0.80] for majority “Best Quality” TLEU retrievals. For the purposes of this study, only cities that fell under these thresholds were used in the final analysis.
References
- Berk, A. , et al. (2004), MODTRAN5: A reformulated atmospheric band model with auxiliary species and practical multiple scattering options, sensors, systems, and next‐generation satellites, paper presented at VIII. Proceedings of the Society of Photographic Instrumentation Engineers (SPIE), Honolulu, Hawaii.
- Cao, C. , and Bai Y. (2014), Quantitative analysis of VIIRS DNB nightlight point source for light power estimation and stability monitoring, Remote Sens., 6(12), 11,915–11,935. [Google Scholar]
- Cao, C. , Shao X., and Uprety S. (2013), Detecting light outages after severe storms using the S‐NPP/VIIRS day/night band radiances, IEEE Geosci. Remote Sens. Lett., 10(6), 1582–1586. [Google Scholar]
- CEC (2013), California commercial end‐use survey. Rep., CEC‐400‐2013‐005, 28 Jun. [Available at http://www.energy.ca.gov/ceus/].
- Chester, M. V. , Sperling J., Stokes E., Allenby B., Kockelman K., Kennedy C., Baker L. A., Keirstead J., and Hendrickson C. T. (2014), Positioning infrastructure and technologies for low‐carbon urbanization, Earth's Future, 2(10), 533–547, doi:10.1002/2014EF000253. [Google Scholar]
- Cinzano, P. , Falchi F., Elvidge C., and Baugh K. (2000), The artificial night sky brightness mapped from DMSP satellite operational linescan system measurements, Mon. Not. R. Astron. Soc., 318(3), 641–657. [Google Scholar]
- Clarke, L. , et al. (2014), Assessing transformation pathways, in Climate Change 2014: Mitigation of Climate Change. Contribution of Working Group III to the Fifth Assessment Report of the Intergovernmental Panel on Climate Change, Cambridge Univ. Press, Cambridge, U. K. [Google Scholar]
- Cleveland, R. B. , Cleveland W. S., McRae J. E., and Terpenning I. (1990), STL: A seasonal‐trend decomposition procedure based on loess, J. Off. Stat., 6(1), 3–73. [Google Scholar]
- Dagher, L. , and Ruble I. (2011), Modeling Lebanon's electricity sector: Alternative scenarios and their implications, Energy, 36(7), 4315–4326. [Google Scholar]
- Doll, C. H. , Muller J.‐P., and Elvidge C. D. (2000), Night‐time imagery as a tool for global mapping of socioeconomic parameters and greenhouse gas emissions, Ambio, 29(3), 157–162. [Google Scholar]
- Elvidge, C. D. , Baugh K. E., Kihn E. A., Kroehl H. W., Davis E. R., and Davis C. W. (1997), Relation between satellite observed visible‐near infrared emissions, population, economic activity and electric power consumption, Int. J. Remote Sens., 18(6), 1373–1379. [Google Scholar]
- Elvidge, C. D. , Baugh K. E., Dietz J. B., Bland T., Sutton P. C., and Kroehl H. W. (1999), Radiance calibration of DMSP‐OLS low‐light imaging data of human settlements, Remote Sens. Environ., 68(1), 77–88. [Google Scholar]
- Erle, J. , Wichmann J. M., and Kjærum A. (2011), Egypt Electoral Constituencies: Socio‐economic classification of Egypt's party electoral constituencies. Rep., 17 pp, Danish‐Egyptian Dialogue Institute, Cairo, Egypt.
- Friedl, M. A. , Sulla‐Menashe D., Tan B., Schneider A., Ramankutty N., Sibley A., and Huang X. (2010), MODIS Collection 5 global land cover: Algorithm refinements and characterization of new datasets, Remote Sens. Environ., 114(1), 165–182, doi:10.1016/j.rse.2009.08.016. [Google Scholar]
- Gillingham, K. , Newell R. G., and Palmer K. (2009), Energy efficiency economics and policy. Rep. 15031, National Bur. Econ. Res., Cambridge, Mass.
- Hall, D. K. , Riggs G. A., Foster J. L., and Kumar S. V. (2010), Development and evaluation of a cloud‐gap‐filled MODIS daily snow‐cover product, Remote Sens. Environ., 114(3), 496–503. [Google Scholar]
- Johnson, R. S. , Zhang J., Hyer E. J., Miller S. D., and Reid J. S. (2013), Preliminary investigations toward nighttime aerosol optical depth retrievals from the VIIRS day/night band, Atmos. Meas. Tech. Discuss., 6(1), 587–612. [Google Scholar]
- Justice, C. O. , et al. (2013), Land and cryosphere products from Suomi NPP VIIRS: Overview and status, J. Geophys. Res., 118, 1–13, doi:10.1002/jgrd.50771. [DOI] [PMC free article] [PubMed] [Google Scholar]
- Kharrufa, S. N. (2008), Evaluation of basement's thermal performance in Iraq for summer use, J. Asian Archit. Building Eng., 7(2), 411–417. [Google Scholar]
- Letu, H. , Hara M., Yagi H., Naoki K., Tana G., Nishio F., and Shuhei O. (2010), Estimating energy consumption from night‐time DMPS/OLS imagery after correcting for saturation effects, Int. J. Remote Sens., 31(16), 4443–4458. [Google Scholar]
- Li, X. , and Li D. (2014), Can night‐time light images play a role in evaluating the Syrian Crisis?, Int. J. Remote Sens., 35(18), 6648–6661. [Google Scholar]
- Lijesen, M. G. (2007), The real‐time price elasticity of electricity, Energy Econ., 29(2), 249–258. [Google Scholar]
- Lucht, W. , Schaaf C. B., and Strahler A. H. (2000), An algorithm for the retrieval of albedo from space using semiempirical BRDF models, IEEE Trans. Geosci. Remote Sens., 38(2), 977–998, doi:10.1109/36.841980. [Google Scholar]
- Lutzenhiser, L. (1993), Social and behavioral aspects of energy use, Annu. Rev. Energy Environ., 18, 247–289. [Google Scholar]
- Lutzenhiser, L. (2002), Marketing household energy conservation: The message and the reality, in New Tools for Environmental Protection: Education, Information, and Voluntary Measures, pp. 49–65 , National Academic Press, Washington, D. C. [Google Scholar]
- Miller, S. D. , and Turner R. E. (2009), A dynamic lunar spectral irradiance data set for NPOESS/VIIRS day/night band nighttime environmental applications, IEEE Trans. Geosci. Remote Sens., 47(7), 2316–2329. [Google Scholar]
- Miller, S. D. , Straka W., Mills S. P., Elvidge C. D., Lee T. F., Solbrig J., Walther A., Heidinger A. K., and Weiss S. C. (2013), Illuminating the capabilities of the Suomi National Polar‐Orbiting Partnership (NPP) visible infrared imaging radiometer suite (VIIRS) day/night band, Remote Sens., 5(12), 6717–6766. [Google Scholar]
- Moorthi, S. , Pan H.‐L., and Caplan P. (2001), Changes to the 2001 NCEP operational MRF/AVN global analysis/forecast system, Tech. Procedure Bull. 484, US Department of Commerce, National Oceanic and Atmospheric Administration, National Weather Service, Office of Meteorology, Program and Plans Division, Silver Spring, Md.
- National Grid (2013), Load profiles. Rep, 28 June, [Available at http://www.nationalgridus.com/niagaramohawk/business/rates/5_load_profile.asp].
- Nicodemus, F. E. (1977), Geometrical Considerations and Nomenclature for Reflectance, National Bureau of Standards Monograph, 160, pp. 1–52 , US Government Printing Office, Washington, D. C. [Google Scholar]
- NREL (2013), Commercial and Residential Hourly Load Profiles for all TMY3 Locations in the United States, made available under the ODC‐BY 1.0 Attribution License. Rep [Available at http://en.openei.org/datasets/node/961.
- O'Neill, B. C. , Dalton M., Fuchs R., Jiang L. W., Pachauri S., and Zigova K. (2010), Global demographic trends and future carbon emissions, Proc. Natl. Acad. Sci. U. S. A., 107(41), 17,521–17,526. [DOI] [PMC free article] [PubMed] [Google Scholar]
- Popp, D. , Newell R. G., and Jaffe A. B. (2009), Energy, the environment, and technological change. Rep. 14832, National Bureau of Economic Research, Cambridge, Mass.
- Román, M. O. , Schaaf C. B., Lewis P., Gao F., Anderson G. P., Privette J. L., Strahler A. H., Woodcock C. E., and Barnsley M. (2010), Assessing the coupling between surface albedo derived from MODIS and the fraction of diffuse skylight over spatially‐characterized landscapes, Remote Sens. Environ., 114(4), 738–760, doi:10.1016/j.rse.2009.11.014. [Google Scholar]
- Romero‐Lankao, P. , et al. (2014), A critical knowledge pathway to low‐carbon, sustainable futures: Integrated understanding of urbanization, urban areas, and carbon, Earth's Future, 2(10), 515–532, doi:10.1002/2014EF000258. [Google Scholar]
- Roujean, J. , Leroy M., and Deschanms P. (1992), A bidirectional reflectance model of the Earth's surface for the correction of remote sensing data, J. Geophys. Res., 97(D18), 20,455–20,468, doi:10.1029/92JD01411. [Google Scholar]
- Schaaf, C. B. , et al. (2002), First operational BRDF, albedo and nadir reflectance products from MODIS, Remote Sens. Environ., 83(1–2), 135–148, doi:10.1016/S0034-4257(02)00091-3. [Google Scholar]
- Schaaf, C. B. , Liu J., Gao F., and Strahler A. H. (2011), MODIS albedo and reflectance anisotropy products from Aqua and Terra, in Land Remote Sensing and Global Environmental Change: NASA's Earth Observing System and the Science of ASTER and MODIS, edited by Ramachandran B., Justice C., and Abrams M., Springer‐Verlag, New York. 873 pp. [Google Scholar]
- Schaepman‐Strub, G. , Schaepman M. E., Painter T. H., Dangel S., and Martonchik J. V. (2006), Reflectance quantities in optical remote sensing‐definitions and case studies, Remote Sens. Environ., 103(1), 27–42, doi:10.1016/j.rse.2006.03.002. [Google Scholar]
- Schultz, P. W. (2002), Environmental attitudes and behaviors across cultures, Online Readings Psychol. Culture, 8(1), 1–12, doi:10.9707/2307-0919.1070. [Google Scholar]
- Seto, K. , and Dhakal S. (2014), Chapter 12: Human settlements, infrastructure, and spatial planning, in Climate Change 2014: Mitigation of Climate Change. Contribution of Working Group III to the Fifth Assessment Report of the Intergovernmental Panel on Climate Change, pp. 67–76, Cambridge Univ. Press, Cambridge, U. K. [Google Scholar]
- Shove, E. (2003), Comfort, Cleanliness and Convenience: The Social Organization of Normality, Berg, Oxford, U. K. [Google Scholar]
- Shuai, Y. , Schaaf C. B., Strahler A. H., Liu J., and Jiao Z. (2008), Quality assessment of BRDF/albedo retrievals in MODIS operational system, Geophys. Res. Lett., 35, L05407, doi:10.1029/2007GL032568. [Google Scholar]
- SJCE (2011), Supreme Judicial Committee for Elections: Egypt elections: Listing of results on the map. Rep [Available at http://parliament2011.elections.eg/index.php/statistics/lists‐results‐on‐map] (in Arabic).
- Small, C. , Elvidge C. D., Balk D., and Montgomery M. (2011), Spatial scaling of stable night lights, Remote Sens. Environ., 115(2), 269–280. [Google Scholar]
- Steg, L. , and Vlek C. (2009), Encouraging pro‐environmental behaviour: An integrative review and research agenda, J. Environ. Psychol., 29(3), 309–317. [Google Scholar]
- Stern, N. (2007), The Economics of Climate Change: The Stern Review, Cambridge Univ. Press, Cambridge, U. K. [Google Scholar]
- Stern, P. (2014), Individual and household interactions with energy systems: Toward integrated understanding, Energy Res. Social Sci., 1, 41–48. [Google Scholar]
- Tan, B. , Morisette J. T., Wolfe R. E., Gao F., Ederer G. A., Nightingale J., and Pedelty J. A. (2011), An enhanced TIMESAT algorithm for estimating vegetation phenology metrics from MODIS data, IEEE J. Selected Topics Appl. Earth Obs. Remote Sens., 4(2), 361–371, doi:10.1109/Jstars.2010.2075916. [Google Scholar]
- Townsend, A. C. , and Bruce D. A. (2010), The use of night‐time lights satellite imagery as a measure of Australia's regional electricity consumption and population distribution, Int. J. Remote Sens., 31(16), 4459–4480. [Google Scholar]
- Tucker, C. J. (1979), Red and photographic infrared linear combinations for monitoring vegetation, Remote Sens. Environ., 8(2), 127–150. [Google Scholar]
- Vermote, E. , Justice C. O., and Csiszar I. (2014), Early evaluation of the VIIRS calibration, cloud mask and surface reflectance earth data records, Remote Sens. Environ., 148, 134–145, doi:10.1016/j.rse.2014.03.028 [Google Scholar]
- Von Storch, H. , and Zwiers F. W. (2001), Statistical Analysis in Climate Research, Cambridge Univ. Press, Cambridge, U. K.. [Google Scholar]
- Walther, A. , Heidinger A. K., and Miller S. (2013), The expected performance of cloud optical and microphysical properties derived from Soumi NPP VIIRS day/night band lunar reflectance, J. Geophys. Res., 118, 13,230–13,240, doi:10.1002/2013JD020478. [Google Scholar]
- Wickham, J. D. , Stehman S. V., Gass L., Dewitz J., Fry J. A., and Wade T. G. (2013), Accuracy assessment of NLCD 2006 land cover and impervious surface, Remote Sens. Environ., 130, 294–304. [Google Scholar]
- Wilhite, H. , Shove E., Lutzenhiser L., and Kempton W. (2000), The legacy of twenty years of energy demand management: we know more about individual behaviour but next to nothing about demand, in Society, Behaviour, and Climate Change Mitigation, pp. 109–126, Springer, Dordrecht, The Netherlands: [Google Scholar]
- Wilson, C. , and Dowlatabadi H. (2007), Models of decision making and residential energy use, Annu. Rev. Environ. Resour., 32, 169–203. [Google Scholar]
- Xian, G. , Homer C., Dewitz J., Fry J., Hossain N., and Wickham J. (2011), The change of impervious surface area between 2001 and 2006 in the conterminous United States, Photogramm. Eng. Remote Sens., 77(8), 758–762. [Google Scholar]
- Zhang, Q. , Schaaf C., and Seto K. C. (2013), The vegetation adjusted NTL urban index: A new approach to reduce saturation and increase variation in nighttime luminosity, Remote Sens. Environ., 129, 32–41. [Google Scholar]