Abstract
We combine cryoreduction/annealing/EPR measurements of nitrogenase MoFe protein with results of earlier investigations to provide a detailed view of the electron/proton transfer events and conformational changes that occur during early stages of [e−/H+] accumulation by the MoFe protein. This includes reduction of (i) the non-catalytic state of the iron-molybdenum cofactor (FeMo-co) active site that is generated by chemical oxidation of the resting-state cofactor (S = 3/2)) within resting MoFe (E0), and (ii) the catalytic state that has accumulated n =1 [e−/H+] above the resting-state level, denoted E1(1H) (S ≥ 1) in the Lowe-Thorneley kinetic scheme. FeMo-co does not undergo a major change of conformation during reduction of oxidized FeMo-co. In contrast, FeMo-co undergoes substantial conformational changes during the reduction of E0 to E1(1H), and of E1(1H) to E2(2H) (n = 2; S = 3/2). The experimental results further suggest that the E1(1H) → E2(2H) step involves coupled delivery of a proton and electron (PCET) to FeMo-co of E1(H) to generate a non-equilibrium S = ½ form E2(2H)*. This subsequently undergoes conformational relaxation and attendant change in FeMo-co spin state, to generate the equilibrium E2(2H) (S = 3/2) state. Unexpectedly, these experiments also reveal conformational coupling between FeMo-co and P-cluster, and between Fe protein binding and FeMo-co, which might play a role in gated ET from reduced Fe protein to FeMo-co.
Keywords: Enzyme catalysis
Introduction
Nitrogenase catalyzes the reduction of dinitrogen (N2) to two ammonia (NH3) molecules, and is the dominant contributor of fixed nitrogen in the biogeochemical nitrogen cycle.[1] The reduction of N2 by Mo-dependent nitrogenase occurs at the FeMo-cofactor (7Fe-9S-1Mo-1C-1homocitrate) contained within the nitrogenase MoFe protein.[2–3] Substrate reduction involves the transfer of electrons, one-at-a-time, from the [4Fe-4S] cluster of the reduced nitrogenase Fe protein (Fered) to FeMo-co, each transfer being associated with the hydrolysis of two ATP.[2] The catalytic cycle has been described by the Lowe-Thorneley (LT) kinetic scheme[2, 4–5] in which each electron-transfer (ET) step involves the coupled transfer of a proton to FeMo-co from an adjacent proton-delivery network.
The LT catalytic cycle involves multiple steps of electron transfer from Fered to the MoFe protein, in which the stages are denoted as En, and posits that the nth stage MoFe protein has accumulated n protons as well as n electrons. Hence the more complete notation of En(nH), which is incorporated in a representation of the first two steps, Fig 1. We recently established[3, 6–9] that nitrogen fixation by nitrogenase is driven by the obligatory reductive elimination (re) of H2 in order to activate FeMo-co for N2 binding and reduction.[10] [11] This finding implies an optimal (limiting) stoichiometry for nitrogen fixation by nitrogenase,
| (1) |
with the accumulation of n equals eight electrons and protons, rather than the six required for chemical reduction of N2.
Figure 1.
First two steps of the LT MoFe protein cycle showing the accumulation of electrons/protons as well as the possible loss of H2 by relaxation.
Four steps of electron/proton accumulation are required prior to N2 reduction, which begins at E4, and the understanding of these processes is incomplete. We have shown[12–16] that the E0→E1(H) reduction through ET from reduced Fe protein (Fered) to MoFe protein involves a ‘deficit-spending’ process in which the first step is the transfer of an electron from the MoFe protein auxiliary P cluster (8Fe7S) to FeMo-co. This process is kinetically gated by a rate-limiting conformational change, likely at the Fe/MoFe interface, that does not involve correlated proton transfer (no KIE), with follow-up ‘reimbursement’ of the oxidized P cluster through rapid ET from Fered.[12–16] The LT kinetic scheme incorporates the same electron-transfer ‘Fe-protein cycle’ at each step of electron/proton delivery, and thus would incorporate this process at each stage of the catalytic cycle.
Regarding changes at FeMo-co itself, it has been shown that one-electron oxidized MoFe protein contains a diamagnetic (S = 0) non catalytically active form of FeMo-co, denoted Mox,[17] and that its reduction to the resting state cofactor, with its EPR-active (S = 3/2) FeMo-co, denoted MN, involves a form of proton-coupled electron transfer (PCET[18–19]). (For clarity, we emphasize here that it is necessary in this study to employ parallel notations. When a state of MoFe protein is being linked to the LT kinetic scheme we use the ‘En’ notation defined above. When the text focuses on the redox state of FeMo-co, as is frequently necessary, we use the Mox/N notation.) There is indeed a thermodynamically coupled uptake of a proton in this reduction, as incorporated in the LT scheme for steps in the catalytic cycle (eg., Fig 1),[20] but early ENDOR spectroscopic studies long ago showed that this proton must bind at a site remote from the paramagnetic metal ions of FeMo-co[21] Later Mossbauer studies showed that the equilibrium E1(1H) state prepared by electron transfer from Fered to the resting state MoFe protein, E0, generates an integer-spin reduced FeMo-co (S ≥ 1, denoted MR) without a major change in spin coupling among the Fe ions.[17] FeMo-co of E1(H) appears to accept the electron at Mo to generate an integer-spin cluster, S ≥ 1.[17] FeMo-co of E2(2H) has spin, S =3/2,[2] but nothing is known directly about FeMo-co of E3(3H). In contrast E4(4H), which has an S = ½ FeMo-co has been trapped and extensive study by ENDOR spectroscopy has shown it contains two [Fe-H-Fe] bridging hydrides. Perhaps surprisingly, of the four steps of electron/proton accumulation in the catalytic cycle prior to N2 reduction, En, n ≤ 4, direct experiment has only verified the delivery of a total of n H+ to FeMo-co for n = 2, which state can decay to E0 in the frozen solution by loss of its two protons/electrons in the form of H2, and for n = 4, which state can decay to E0 by loss of two H2.[2, 4–5] The impediment to the study of FeMo-co in electron-accumulation intermediates (as well as the others) is that reduction of MoFe protein is rate-limited by the off-rate of the oxidized Fe protein subsequent to electron delivery.[22] As a result solution-kinetic measurements provide little insight into the nature of the coupling between proton and electron delivery to the MoFe protein, and of electron/proton delivery to FeMo-co itself, while the difficulty of trapping intermediates has precluded study of conformational changes that might be undergone by FeMo-co during electron and/or proton delivery.
It appeared to us that radiolytic cryoreduction/annealing/EPR[23] studies of nitrogenase offered a possible means of decoupling and revealing the details of proton and electron delivery to FeMo-co itself, and of disclosing possible attendant conformational changes that occur at this multimetallic cluster. Cryoreduction of a metal center such as FeMo-co in 77 K frozen solution involves the direct injection of a radiolytically generated mobile electron into the center, and thus may decouple electron and proton transfer. The cryoreduced FeMo-co is trapped in the conformation of its precursor state, and step-annealing to higher temperature typically allows it to structurally relax, revealing any conformational changes between FeMo-co in the reduced state, and in the precursor MoFe protein state; the occurrence of a KIE during relaxation signals that the rate-limiting step in the process involves a proton transfer.[23–24] However, in some cases, when the protein environment is well-poised for proton delivery, such proton transfer is ‘hidden’ during 77 K reduction/annealing, because it can accompany electron injection even at 77 K or below; in one case it was found that 6 K cryoreduction was coupled to proton tunneling.[25]
To explore proton delivery to FeMo-co and conformational changes at FeMo-co that accompany reduction of the MoFe protein and proton delivery to FeMo-co, we begin by examining cryoreduction/annealing of preparations in which most of the resting-state FeMo-co, MN has been chemically oxidized to Mox, using EPR to monitor the the Mox→MN cryoreduction/annealing. However, the main focus is the cryoreduction/annealing conversion of E1(H) to E2(2H). We have carried out cryoreduction/annealing/EPR measurements on MoFe protein containing high populations of E1(H) generated in multiple ways. In each case the state formed by 77K cryoreduction of E1(1H) is first examined by EPR, then cryoannealed at higher temperatures in the frozen state while its relaxation to the equilibrium E2(2H) form is monitored.
By combining the results from the present study with those of an earlier cryoreduction/Mossbauer investigation[17] and studies of ET during turnover,[12–16] we arrive at a provisional view of the electron/proton transfer events and conformational changes that occur during accumulation of [e−/H+] by the MoFe protein, starting from the non-catalytic Mox state and proceeding through the E2(2H) stage of the LT scheme, a view that likely extends at least through the E4(4H) state. This study further reveals conformational coupling between FeMo-co and P-cluster, and between FeMo-co and the binding of Fe protein, which might well play a role in the gated ET from reduced Fe protein to FeMo-co.
Materials and Methods
Materials and Protein purification
All reagents were obtained from SigmaAldrich (St. Louis, MO) or Fisher Scientific (Fair Lawn, NJ) and were used without further purification. Argon and dinitrogen gases were purchased from Air Liquide America Specialty Gases LLC (Plumsteadville, PA) and were passed through an activated copper catalyst to remove any traces of dioxygen before use. Azotobacter vinelandii strain DJ995 (wild-type MoFe protein with a His tag) was grown, and the corresponding nitrogenase MoFe protein, having a seven-His tag addition near the carboxyl-terminal end of the α-subunit, was expressed and purified as described.[26] Protein concentrations were determined by the Biuret assay. The purities of these proteins were >95% based on SDS/PAGE analysis with Coomassie staining. Handling of proteins and buffers was done in septum-sealed serum vials under an argon atmosphere or on a Schlenk vacuum line. All liquid were transferred using gas-tight syringes.
Preparation of cryoreduction samples
Mox/Pox samples were made using methylene blue (MB) as oxidant (Em = +11 mV). Wild type MoFe protein was passed through a column packed with Dowex/G25 resin to remove residual dithionite. The protein was eluted with 200 mM MOPS pH=7.4 containing 150 mM NaCl and the concentration was determined using Biuret assay. 800 µM MB (10 mM MB stock made in 100 mM MOPS pH=7.4) was added to 400 µL of 200 mM MOPS buffer pH=7.4 containing 110 µM MoFe, 150 mM NaCl and 11% glycerol. The mixture was kept at room temperature for 30 min and 350 µL of samples was transferred to a 18.5 cm long and 4 mm diameter calibrated quartz EPR tube and rapidly frozen in liquid nitrogen.
The resting state samples, used for E0⟹E1 study, were made at room temperature in 200 mM MOPS buffer at pH 7.3 with 50 mM dithionite. MoFe protein was at a final concentration of ~100 µM. About 300 µL of samples (out of a total volume ~400 µL) was transferred to a calibrated quartz EPR tube and rapidly frozen in liquid nitrogen. All turnover samples were prepared in a dioxygen free buffer (total volume ~400 µL) containing a MgATP regeneration system with final concentrations of 13 mM ATP, 15 mM MgCl2, 20 mM phosphocreatine, 2.0 mg/mL bovine serum albumin, and 0.3 mg/ mL phosphocreatine kinase in a 200 mM MOPS buffer at pH 7.3 (or pD = 7.3 with a pH meter reading of 6.9 in D2O buffer[27]) with 50 mM dithionite. Glycerol (10% glycerol (v/v)) was added in the buffer where noted. Low-flux samples were made by adding MoFe protein at ~100 µM final concentration and initiating the reaction by adding Fe protein at ~2 µM concentration. The reaction was allowed to run for 10 min at room temperature at which point ~300 µL of sample was transferred to the EPR tubes and frozen as described above. High-flux samples were made with ~100 µM MoFe proteins and ~150 µM Fe protein. After the addition of the Fe protein, the reaction was allowed to run at room temperature under Ar or N2 atmosphere for 20–25 s before freezing the samples.
Cryoreduction
γ-irradiation of the nitrogenase samples at 77 K typically was performed for ~ six hours (dose rate of 0.5 Mrad/h, total dose 3 Mrad) using a Gammacell 220 60Co source. Annealing at temperatures over the range 77 K-270 K was performed by placing the EPR samples in the appropriate bath (n-pentane or methanol cooled with liquid N2) and then refreezing in liquid nitrogen. As discussed, cryoreduction of the E1 state produces an S = ½ intermediate that converts to the equilibrium S=3/2 E2 state during cryoannealing. The kinetic progress curves for these processes are measured as the amplitudes of these species’ EPR spectra at their maximum g-value: S = 3/2, gmax = 4.23; S = ½, gmax = 2.23.
EPR
EPR spectra were recorded on an X-band Bruker ESP 300 spectrometer equipped with an Oxford Instruments ESR 900 continuous He flow cryostat. 2 K 35 GHz EPR spectra were measured on an instrument described elsewhere.[28–29]
Results
Cryoreduction/Annealing of Mox
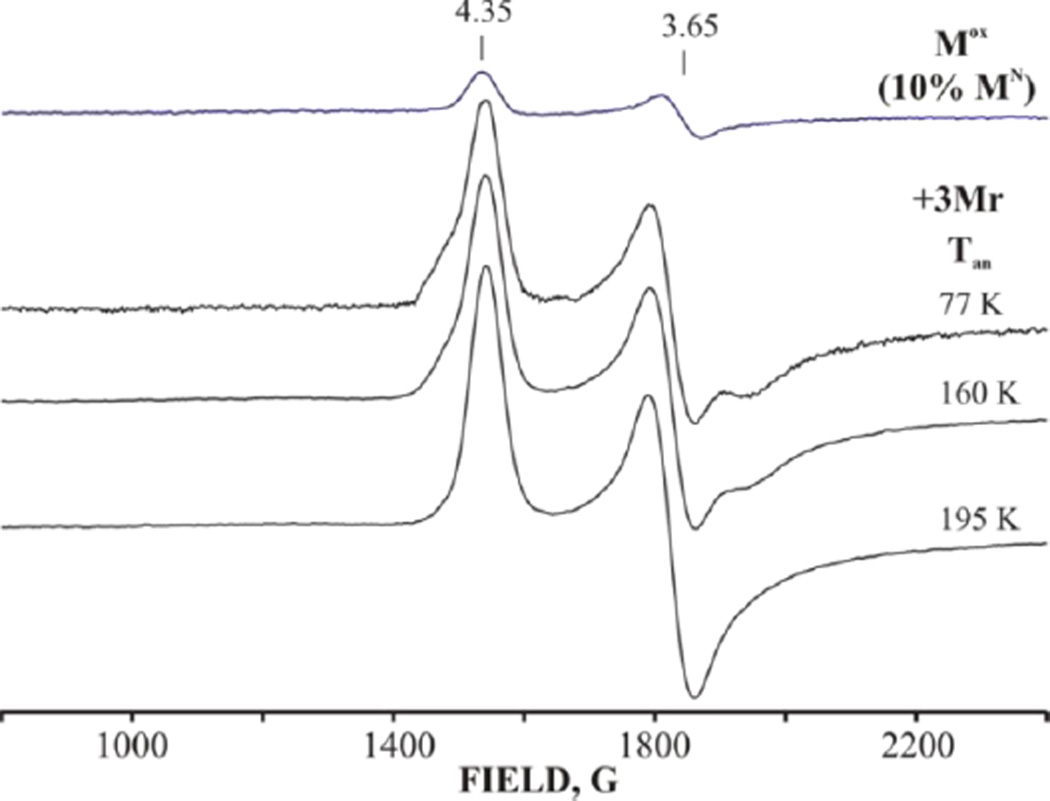
To extend the earlier studies of Mox, and for comparison with the present results for cryoreduction/annealing of the E0 and E1 stages of the catalytic cycle, we chemically oxidized resting-state E0 MoFe protein to a state that contains the EPR-silent, singly oxidized FeMo-co, denoted Mox, cryoreduced it, and examined the transformation to E0 (MN). As usual, the E0 MoFe protein shows the S = 3/2 EPR signal, g = [4.35, 3.65, 2.0], associated with resting-state FeMo-co, MN, plus variable small amounts of a conformer(s) with somewhat higher rhombicity eg., (g ~ [4.5, 3.5, 2.0]).[2, 30–31] The chemical oxidation converts roughly 90% of MN to Mox, as shown by the loss of the S = 3/2 MN signal, Figure 2. Cryoradiolysis at 77 K directly reduces roughly one-half of the Mox back to MN, as seen by the reappearance of the S = 3/2 MN EPR signal, Figure 2, although with a somewhat increased population of the more rhombic conformers of MN.
Figure 2.
X-band EPR spectra of nitrogenase MoFe protein oxidized to the (primarily) Mox state with loss of 90% of MN signal (upper) and then cryoreduced at 77K and annealed at progressively higher temperatures for 2 minutes each. Conditions: Microwave power 5 mW, modulation amplitude 10 G, microwave frequency, 9.375 GHz, T=10 K.
During stepwise annealing of the cryoreduced sample for 2 min at each of several temperatures up to 260 K, these MN conformers relax to the majority resting MN form of the cluster by Tan ~ 180 K without loss of net signal; upon further annealing at T > 180K the S = 3/2 signal does not change at all, and no new high-spin (Figure 2) or low-spin (not shown) signal appears. These observations imply that the structure of Mox (epr-silent) differs little from that of MN (S = 3/2) and that Mox undergoes direct 77K cryoreduction to the MN resting state of the cofactor.
Generation of high populations of E1(H)
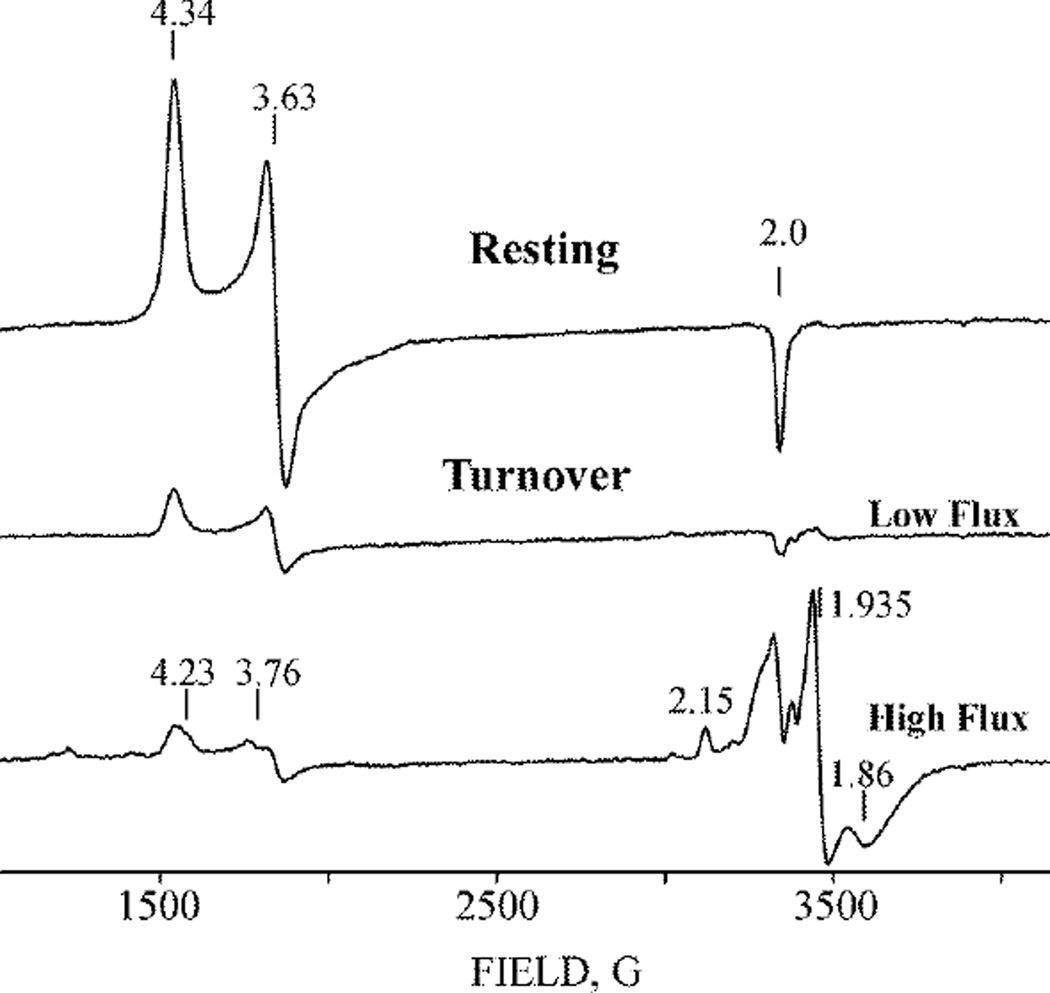
We have employed three procedures to generate high populations of the E1(H) state for subsequent cryoreduction: turnover under low electron flux (MoFe protein:Fe protein = 50:1); turnover under high flux (MoFe protein:Fe protein = 1:1.5); cryoreduction of resting (E0) state MoFe protein (not undergoing TO), followed by cryoannealing at 235 K. Figure 3 presents the EPR spectra of resting (E0) state MoFe protein as well as of samples prepared during TO under Ar with concentrations of Fe protein that generate conditions of either low or high electron flux. As reported,[30] reduction of MoFe protein during turnover under Ar can convert a high percentage of the S = 3/2 E0 state to the EPR-silent E1(H) state. This is seen in Figure 3, where turnover at low flux causes the intensity of the E0 signal to decrease to ~20% of the resting-state value through conversion to E1, and where turnover at high flux decreases the E0 signal to less than 10% of resting. The high-flux Ar TO sample in addition shows a weak S = 3/2 signal from FeMo-co with g = [4.23, 3.76, ~2.0], which overlaps that of E0 and is assigned to E2(2H).[31] The low-field region of the spectra obtained for samples of high-flux TO under N2 are similar to those from high-flux TO under Ar.
Figure 3.
X-band EPR spectra of nitrogenase in resting state and freeze-quenched during TO under low electron flux and high electron flux under Ar (see Materials and Methods). Instrument conditions: Microwave power 5 mW, modulation amplitude 10 G, microwave frequency, 9.375 GHz, T=10 K.
At fields around g ~ 2, Fig 3, the spectrum of the low-flux samples exhibits only a weak signal from the low concentration of reduced Fe protein (g = 1.935 and 1.86) and the g3 ~ 2 feature of the S=3/2 E0 signal, whereas high flux samples show well-resolved features from the high concentrations of reduced Fe protein. In addition, high-flux Ar TO shows a well-resolved signal at g1 = 2.15 from an intermediate that may be E4(4H), whereas high-flux N2 TO shows the signal from the E4(2N2H) intermediate (not shown). Interference by the strong signals in the g-2 region that appear in high-flux samples, lead us to focus on low-flux samples.
Neither high nor low-flux TO creates a new signal at fields lower than g1 = 4.34 of E0, fields where non-Kramers signals from an integer-spin reduced FeMo-co state are sometimes seen.[9] This is consistent with the earlier Mössbauer study, which showed that the E1(H) state produced by TO contains an EPR-silent (integer-spin; S ≥ 1) reduced form of FeMo-co that was denoted MR.[17]
In addition to making high populations of E1(H) through TO, we have also reduced resting state MoFe protein (not under turnover with Fe protein) through radiolytic cryoreduction. Cryoradiolysis of resting-state MoFe protein in 10% glycerol/buffer at 77 K with a dose of 3 meharad (Mrad) causes ~50% decrease in the intensity of the S = 3/2 E0 (MN) signal without appearance of other high-spin signals or non-Kramers signals (Fig S1) in agreement with the previous report.[17] In the earlier report, Mössbauer spectroscopy showed that cryoreduction produces an alternative, non-Kramers (integer-spin) form of FeMo-co, which was denoted as MI; we here also denote the MoFe protein that contains this cluster with the LT notation, as E1'.[17]
As cryogenic radiolysis of an odd-electron Kramers center such as FeMo-co of the E0 resting state can generate an even-electron non-Kramers state not only by cryoreduction, but less commonly by cryooxidation, we carried out measurements to confirm we are indeed cryoreducing the MN FeMo-co of E0. These two processes can be distinguished experimentally: cryoreduction is greatly enhanced, and cryooxidation is suppressed, in samples containing glycerol, the reverse being true in the absence of glycerol.[32] To determine whether the radiation-induced loss of E0 signal represents cryoreduction or cryooxidation of FeMo-co, we cryo-irradiated a frozen aqueous buffer solution of resting-state MoFe protein without added glycerol. We observed no noticeable decrease in the intensity of the E0 S = 3/2 signal (not shown), confirming that the loss of S = 3/2 intensity in Fig S1 occurs through one-electron cryoreduction of MN to MI.[17]Careful examination of the low-field region of the 2 K 35 GHz EPR spectrum of the cryoreduced enzyme again fails to show a new EPR signal for the irradiated MoFe protein in glycerol buffer, Fig S1b, as expected from the Mössbauer study.[17]
We have demonstrated[30] the E1(H) state of MoFe protein produced during TO does not relax to the resting state E0 during extended cryoannealing in the frozen state at temperatures as high as 253 K (Fig S1a) Stepwise annealing of the cryoreduced resting-state nitrogenase at temperatures up to 235 K (Fig S1a) or higher (not shown) likewise does not cause recovery of the E0 signal through relaxation of E1' to E0, as expected.
Cryoreduction /annealing of E1(H)
The above results show that high populations of the E1(H) state can be generated in multiple ways: by reduction of E0 during TO with Fe protein in the presence of ATP under conditions of low and high electron flux (MoFe/Fe protein 50/1 and 1/1.5 respectively) under either Ar or N2, or by cryoreduction/annealing of the E0 MoFe protein. All three types of E1(H), samples were cryoirradiated (3 Mrad) and annealed as a means of examining electron injection and proton transfer into the E1(H) state. It will now be shown that the results of cryoreduction/annealing of E1(H) are independent of the way E1(H) was generated.
Cryoreduction/annealing of low-flux TO samples
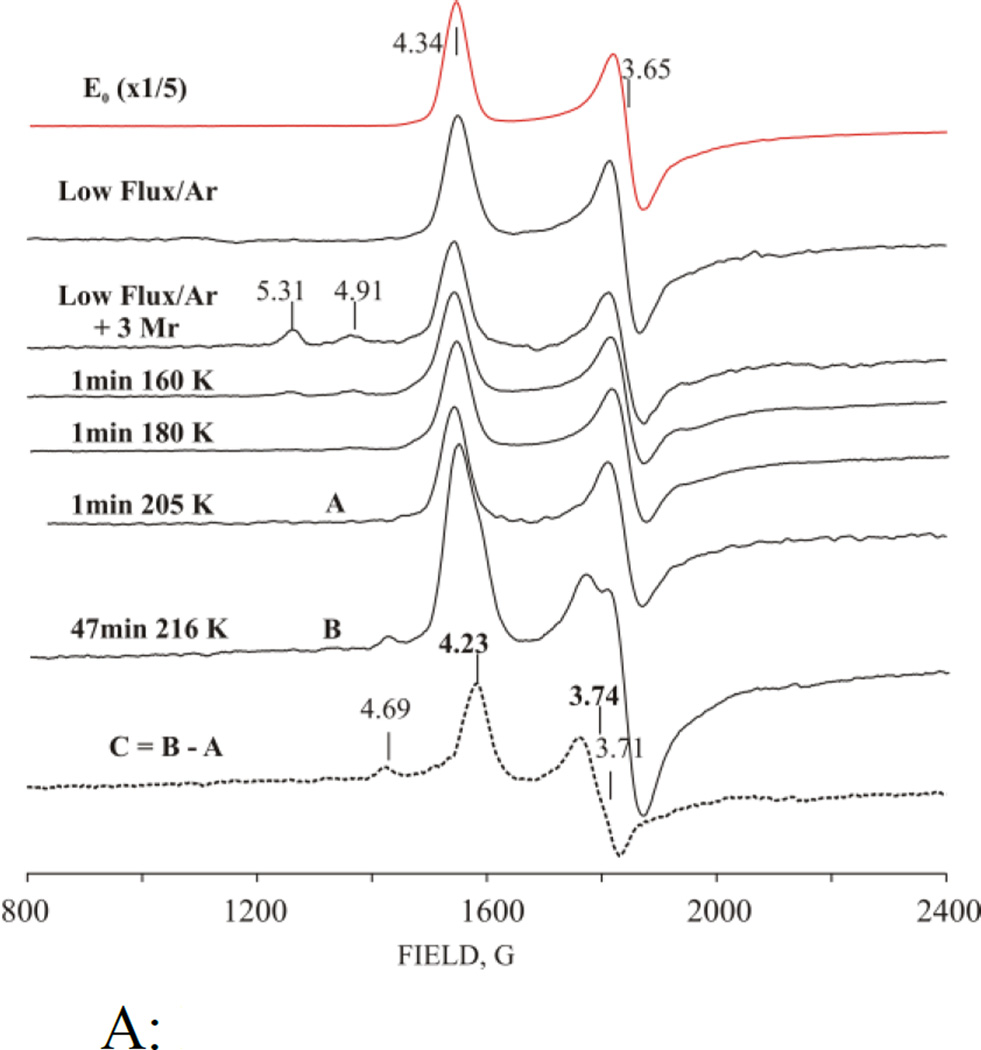
Fig 4A shows the EPR spectrum of resting-state nitrogenase (E0) and nitrogenase that had been cryoreduced subsequent to generation of E1(H) by turnover under low electron flux/Ar conditions with glycerol-containing buffer. The intensity of the S = 3/2 E0 EPR signal is decreased five-fold relative to resting state by TO, and undergoes a small additional decrease in intensity from the irradiation.[33]
Figure 4.
A: Low-field EPR spectra of nitrogenase freeze-trapped under low-flux/Ar TO, cryoreduced (3 Mrad) and annealed at indicated temperatures. Upper two spectra - resting state and low flux/Ar TO before radiolytic cryoreduction; C – difference spectrum between cryoreduced nitrogenase annealed at 216 K for 47 min (B) and 205 K for 1 min (A). Instrument conditions as in Fig 2.
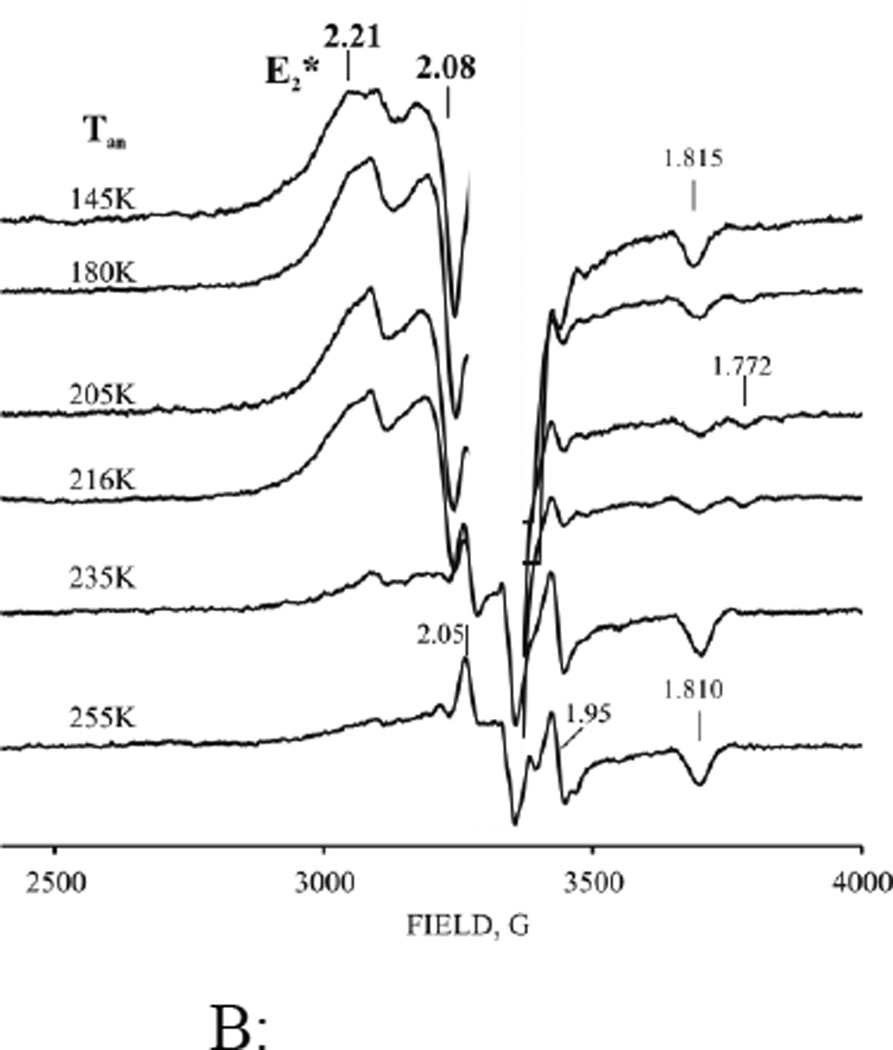
B: High field EPR spectra of cryoreduced low flux Ar turnover nitrogenase annealed at indicated temperatures. E2* signal and g-values, bold; other g-values for Pox (see text). (The radiolytically generated radical signal was cut off for clarity). Instrument conditions as in Fig 3.
We had anticipated that irradiation of E1(H)-containing samples would generate the S = 3/2 EPR signal characteristic of the equilibrium two-electron reduced state E2(2H) with g = [4.23, 3.76, ~2.0].[30–31] This expectation was strengthened by the observation of direct radiolytic conversion of Mox to MN, described above. To our surprise this did not occur, Fig 4B. Instead, irradiation produces a new, relatively broad low-spin EPR signal, which overlaps with the signals from radiolytically generated radicals. The signal resolves better when the radical signal has partly annealed away at T > 160 K, revealing it can be characterized by, g = [2.21, 2.08, nd], Fig 4B (additional features at g = 1.815 and 1.772 in this figure belong to cryogenerated Pox, and are discussed below). The g = 2.21 signal arises from a MoFe intermediate trapped during 77K cryoreduction. This g = 2.21 signal is not created when resting state MoFe protein is cryoreduced by irradiation with a dose of 3 Mrad (Fig S4, S5), which confirms that it is indeed generated by the cryoreduction of E1(H), not of E0, and that the signal arises from a previously unobserved form of E2 which we denote, E2*. The signal is only visible at temperatures below 30 K (Fig S3), its shape only varies slightly with temperature (Fig S3), and the shape does not change noticeably on annealing at T > 180K or during its decay at 216K (Fig 4B). The presence of the radical signals precludes a detailed analysis of this new S = ½ signal, but these characteristics indicate that this spectrum represents a single state, while the breadth of the features in the spectrum is suggestive of some conformational heterogeneity as consequence of heterogeneity the E1 precursor. We also observe the appearance of the E2* signal upon 77 K cryoreduction of the low-flux turnover sample prepared under 1atm N2 (not shown).
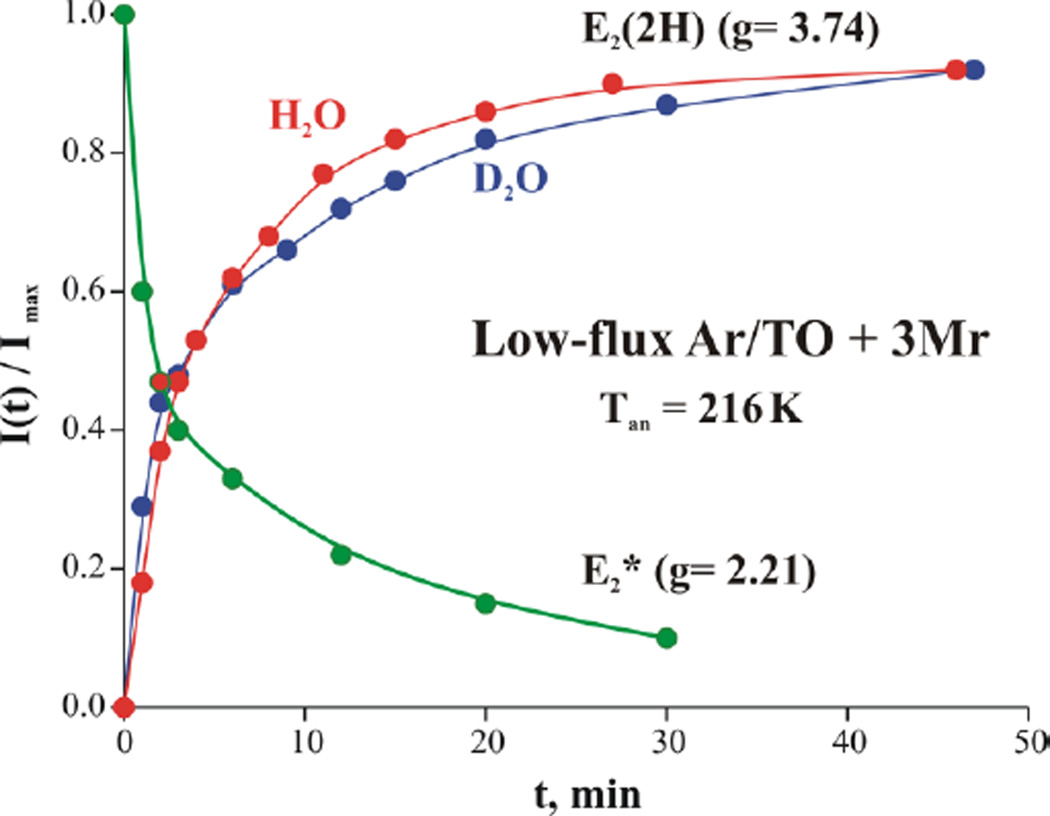
During progressive annealing of the cryoreduced low-flux/Ar sample at 216 K, the g1 = 2.21 E2* signal decays (Fig 4B) with the parallel appearance of the E2(2H) signal (Figs 4A, S6).[34] Measurements of the annealing kinetics show that within the accuracy of measurement (~15%), the two signals evolve with the same half-time, τ ~ 4.8 min, Fig 5, which suggests that annealing involves direct E2* ⟹ E2 relaxation. The same behavior is seen during cryoreduction/anealing of low-flux TO samples prepared under 1 atm N2 (not shown). In both cases, during subsequent annealing at temperatures of 260 K and above, E2(2H) then relaxes to E0 through loss of H2 (Fig S7), as seen previously.[35]
Figure 5.
Kinetics of formation of E2(2H) S = 3/2 state in H2O (red) and D2O (blue) and the decay of S = 1/2 E2* species (g1 = 2.21) (green) during annealing cryoreduced low-flux/Ar TO nitrogenase at 216K. (Curves are to guide the eye).
To test whether the rate-limiting step of the E2* ⟹ E2 relaxation process involves the transfer of a proton to cryoreduced FeMo-co, we looked for kinetic isotope effects (KIE) in the annealing process. Annealing would exhibit a KIE if 77 K cryoreduction decoupled PCET, such that radiolytic electron injection into E1(H) at 77 K forms E2*, and that E2* ⟹ E2(2H) relaxation is rate-limited proton transfer. However Fig 5 shows that E2* generated by cryoreduction of samples trapped under low flux/Ar TO relaxes with the same ‘1/e’ decay time (τ = 5 min) in both H2O and D2O buffer, namely without a KIE. This establishes that proton transfer is not involved in the rate-limiting E2* → E2(2H) step of the relaxation. As discussed below, we suggest that E2* has been formed from E1(H) by coupled electron injection and proton transfer during cryoreduction at 77 K.
Cryoreduction/annealing of high-flux TO samples
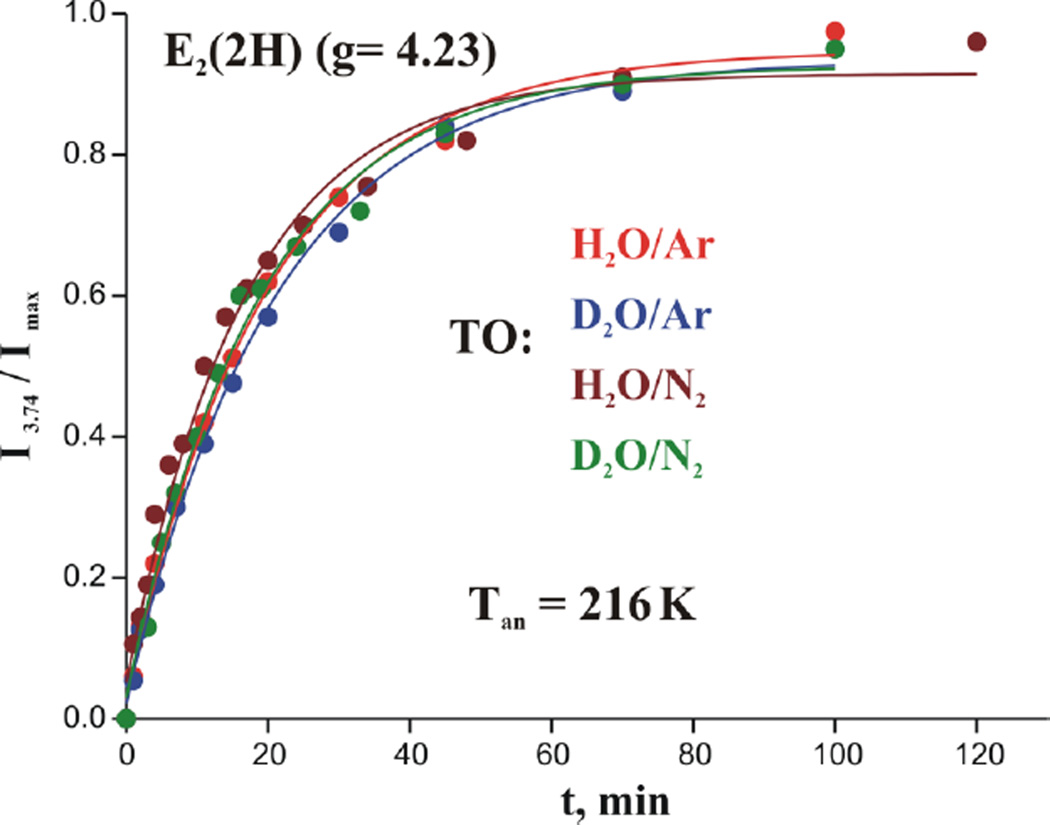
In parallel experiments on samples that contain E1(H) generated during high-flux TO under either Ar or N2 (Fig S7), irradiation again produced E2* through cryoreduction of E1(H). Overlap of the E2* signal with other signals in the g ~ 2 region (see Figure 3) made it impossible to accurately measure its changing intensity during cryoannealing, but it was straightforward to measure the appearance of E2(2H) S = 3/2 formed during E2* ⟹ E2(2H) relaxation. Figure 6 shows that in both Ar and N2 high-flux TO the E2* ⟹ E2(2H) relaxation during 216 K annealing occurs with the same time constant, namely without a KIE.
Figure 6.
Effect of H2O and D2O on kinetics of S = 3/2 state formation during annealing cryoreduced high flux Ar and N2 TO nitrogenase at 216 K. (Solid line, fit exponential rise with median time-constant, τ = 19 min, for the four traces).
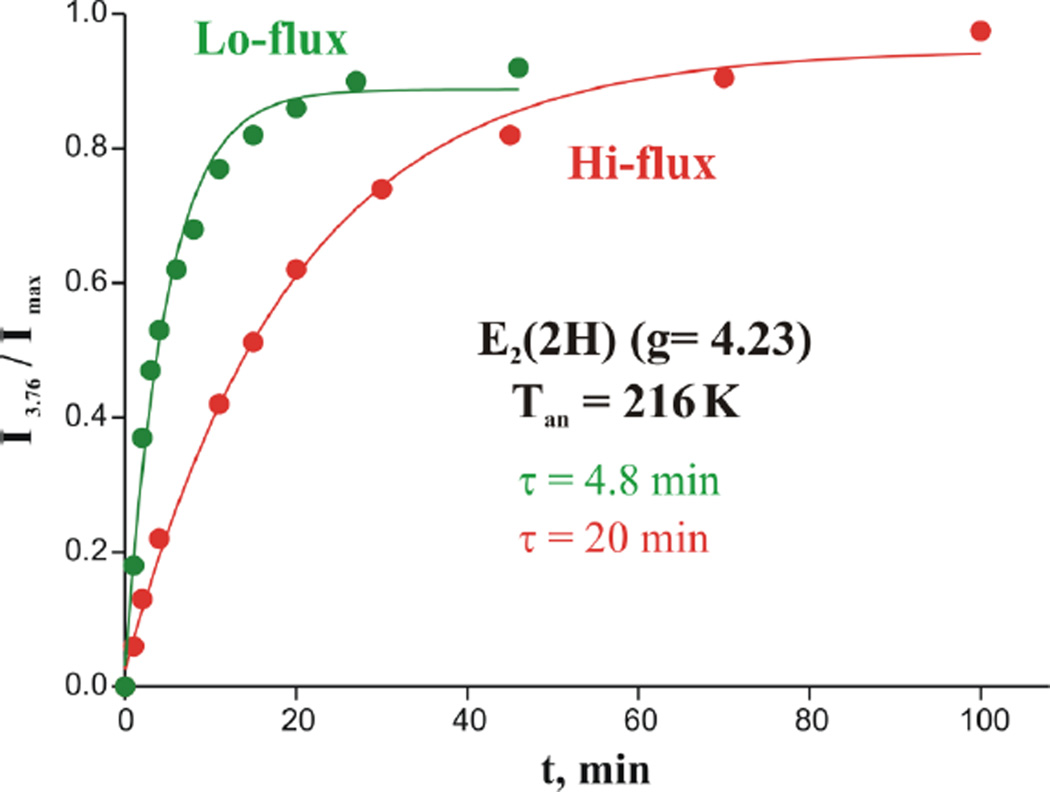
Surprisingly, however, comparison of Figs 5 and 6 shows that the E2(2H)* ⟹ E2(2H) relaxation at 216 K, seen in low-flux/Ar TO samples slows in the presence of the high concentration of Fe protein in high-flux TO. The direct comparison of the formation of the E2(2H) during cryoannealing, Fig 7, shows that at 216 K, the time constant for formation is τ ~ 20 min in high flux vs from τ ~ 4.8 min at low flux. In low-flux TO, the MoFe protein/Fe protein ratio is 50/1, so almost none of the MoFe protein exhibiting the E2* signal has a bound Fe protein. In high flux, the ratio is 1/1.5. As there are 2 FeMo-co per MoFe protein, this means that roughly ¾ of the Fe protein binding sites on MoFe protein are occupied. The effects of electron flux on the relaxation is thus interpreted to mean that binding Fe protein to MoFe protein modulates the rate of E2* ⟹ E2(2H) relaxation of FeMo-co.
Figure 7.
Kinetics of formation of E2(2H), S = 3/2 species during annealing cryoreduced low flux (green) and high flux (red) nitrogenase Ar TO at 216 K. Solid lines: fit to exponential with time-constant, τ = 5 min (low flux) and τ = 20 min (high flux).
Cryoreduction/annealing of E1(H) state generated by cryoreduction of E0
For completeness, we note that if the E1(H) state initially produced by 3 Mrad cryoreduction of E0 is annealed at 235 K, then cryoreduced again with a second 3 Mrad dose, this likewise generates the E2(2H) signal after annealing at T > 216 K (Fig S8). This result, combined with those presented above, show that the E2(2H) state is the same, regardless of how it is formed.
Effects of E0 cryoirradiation on P cluster
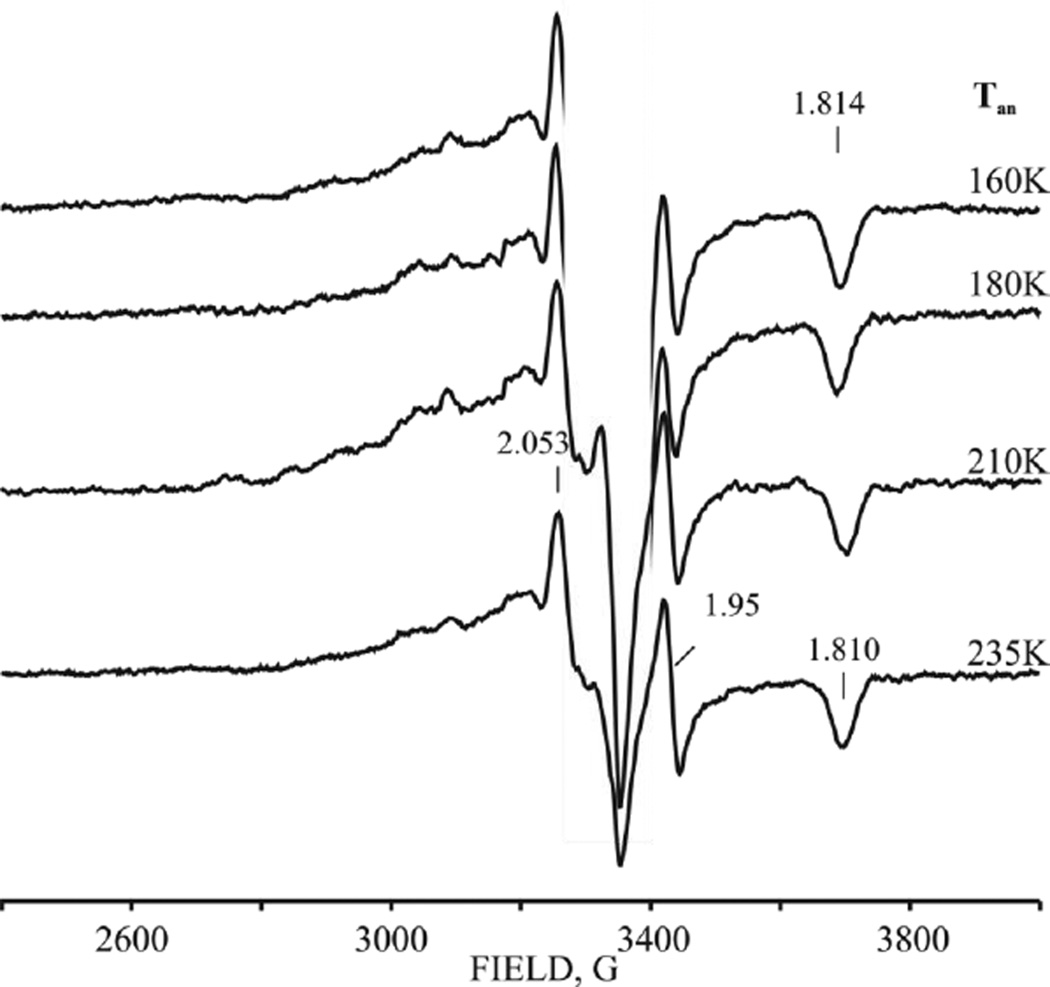
The g ~ 2 region of the EPR spectrum of a glycerol-containing E0 resting-state sample irradiated at 77K with a dose of 3 Mrad shows a new feature at g = [1.814] whose entire spectrum can be seen in full after annealing up to 235 K, Fig 8. This signal is characterized by g = [2.05, 1.95, 1.814] and arises from Pox, generated by cryooxidation of the P cluster.[2] This assignment is confirmed by the finding that this signal is ~ 2-fold stronger when a sample without added glycerol is irradiated (Fig S2); the absence of glycerol enhances cryooxidation relative to cryoreduction,[36] Apparently, the all-ferrous state of the P cluster (PN) cannot be radiolytically cryoreduced to a state containing an Fe(I), but can only be radiolytically cryooxidized, and this even occurs to a degree in samples that contain glycerol. As discussed below, this observation is supportive of our proposed ‘deficit spending’ model for ET from reduced Fe protein to MoFe protein.[15] During annealing up to 235 K the g3 feature of the Pox signal shifts slightly, to g3 = 1.81 (Fig 8).
Figure 8.
High-field EPR spectra of resting-state nitrogenase after radiolytic cryoreduction (3 Mrad), and annealed at indicated temperatures; g-values label features associated with oxidized P-cluster (see text). Instrument conditions as in Fig 2. (The radiolytically generated radical signal was cut off for clarity)
The properties of the P cluster cryooxidized in the presence of high populations of FeMo-co in the reduced state(s) differ from those in irradiated resting-state MoFe protein (Fig 4B). Roughly ¾ of the E0 state of FeMo-co can be converted to E1(H) by either a high radiation dose (6 Mrad) applied to resting state MoFe or by the standard 3 Mrad dose applied to a sample freeze-quenched during low-flux TO under Ar (Fig 3B, S9) or high-flux TO (not shown). During annealing of such samples at temperatures above 160–180 K intensity of g 1.81 feature decreases and a new Pox intermediate with gmin = 1.772 appears. The latter relaxes to the equilibrium Pox gmin = 1.81 state at higher temperatures (Figs 4B, S9). The observation of the intervening, second Pox conformer, which appears only in a sample with a high population of reduced FeMo-co, suggests a conformational influence of the redox state of FeMo-co on the relaxation of cryogenerated Pox cluster.
Discussion
By combining the results from the present study with those of earlier investigations we arrive at a proposed view of the electron/proton transfer events and conformational changes that occur during accumulation of [e−/H+] by the MoFe protein, beginning with the Mox state and going through the E2(2H) stage of the LT scheme, Fig 9. In this figure, equilibrium states of the MoFe protein, and of FeMo-co when it had been labeled historically, are presented ‘in-line’. The characteristics of the Fe protein (F)→MoFe protein (MF) electron transfer, including conformational gating and H+ delivery are indicated ‘above-line’. Those processes as experienced by FeMo-co, and revealed by cryoreduction/annealing studies in the frozen state, are indicated ‘below-line’.
Figure 9.
Scheme for electron/proton delivery and conformational changes during early-stage [e−/H+] accumulation by the MoFe protein (MF) through reduction by the Fe protein (F). Above-line: the ‘Fe-protein cycle’ for ET. The LT kinetic scheme incorporates the same ‘Fe-protein cycle’ at each step of electron delivery; details of the E0 → E1(H) conversion process were characterized previously;[12–16]. In-line: states of MoFe and FeMo-co (see text): solid arrow, e− transfer; dashed arrow, proposed H+ transfer; undulating arrow, conformational change. Below-line: Changes in MoFe as revealed by cryoreduction/annealing, with Mox → E0 and E1(H) → E2(2H) characterized in this study, and with E0 → E1(H) inferred through joint consideration of present work and prior Mossbauer investigation.[17] TO conversions are in-line or below, with E1(1H) → E2(2H) determined in this study.
Considering the ‘above-line’, [e−/H+] delivery to MoFe protein, the E0 → E1(1H) conversion associated with ET from Fered to MoFe protein is kinetically gated by a rate-limiting conformational change that does not involve a coupled proton transfer (no KIE), and uses a ‘deficit-spending’ process in which the first step is the gated transfer of an electron from the P cluster to FeMo-co, with follow-up ‘reimbursement’ of the oxidized P cluster through rapid ET from Fered..[16] The conformational gate during MoFe reduction by Fered is believed to involve motion at the Fe−protein/MoFe-protein interface.[16] ATP hydrolysis then follows ET, rather than preceding it or proceeding synchronously.[12] The LT kinetic scheme incorporates the same ‘Fe-protein cycle’ at each step of electron delivery,[2, 37] and thus each step in Fig 9 shows the same ‘above-line’ gated activation/deficit-spending steps observed for the E0 → E1(1H) step.
Considering the ‘below-line’ changes in FeMo-co during [e−/H+] delivery to the MoFe protein, we begin on the left of Fig 9, with the Mox (S = 0) state of enzyme-bound FeMo-co prepared by oxidation of the resting state cofactor, MN. The pH dependence for the midpoint potential of the reduction of Mox (S = 0) to MN(S = 3/2) in solution shows that this process is coupled with the delivery of a proton to MoFe protein.[20] However, ENDOR spectroscopy long ago showed that there is no bound proton in the vicinity of the spin-bearing metal ions of MN,[21] so the proton must be taken up by an amino acid residue, or possibly by the homocitrate bound to Mo, which has almost no local contribution from the cluster spin.[38] Despite the conversion to a high-spin state upon reduction of Mox, which implies a major change in the spin-coupling scheme, the present finding that cryoreduction directly converts Mox to MN at 77K indicates that these two FeMo-co states exhibit at most minimal structural differences, probably only the ‘breathing’ caused by changes in metal-metal distances as seen by EXAFS spectroscopy.[39] Thus, during the Mox ⇔ MN redox process FeMo-co behaves like a ‘simple’ electron-transfer cluster.
The behavior of the cofactor during electron/proton accumulation steps that form part of the catalytic cycle is quite different. The Mossbauer/cryoreduction studies imply that FeMo-co itself undergoes a substantial conformational change upon the cofactor MN → MR reduction. Thus, the Mossbauer study showed that TO generates an equilibrium E1(H) state that contains an equilibrium form of reduced FeMo-co, MR,[17] (S ≥ 0) without a major change in spin coupling among the Fe ions,[17] whereas 77 K cryoreduction produces an alternative FeMo-co state, MI, with a major change in spin coupling. We conclude that the non-equilibrium MI cofactor exhibits structural differences from MR, FeMo-co in the E1(H) state, and that cryoannealing E1' would allow it to undergo conformational relaxation to the equilibrium E1(1H), with an accompanying MI → MR conformational change, Fig 9.
Consider next the E1(1H) → E2(2H) step of electron/proton delivery, Fig 1. As there was no direct evidence regarding electron/proton coupling or conformational rearrangements at FeMo-co itself during this TO process, we here turned to the cryoreduction/annealing/EPR protocol. The suite of these experiments reported here imply that 77 K radiolytic reduction of the E1(H) state produces a low-spin (S = ½, g = [2.21, 2.08, nd]), doubly-reduced FeMo-co, denoted E2*, trapped in a non-equilibrium conformation characteristic of the E1(H) precursor. E2* relaxes to the equilibrium E2(2H) conformation (S=3/2 signal) upon annealing at relatively high temperature, T ≳ 210K, Fig 4A. This process occurs without a KIE, which establishes that protonation of the cryoreduced FeMo-co E2* is not the rate-limiting step of the relaxation. This low-spin (S = ½) to high-spin (S = 3/2) process must therefore involve as its rate-limiting step a conformational relaxation at FeMo-co that leads to a change in the cluster spin-coupling scheme.
The equilibrium E2(2H) state must have received two protons at or on a residue adjacent to FeMo-co, given that this state relaxes directly to E0 with loss of H2. Given that protonation of FeMo-co is not the rate-limiting step in the observed E2* ⟹ E2(2H) relaxation, in principle cryoreduction/annealing of E1(H) could be following one of two pathways. (i) It might be that cryoradiolysis induces PCET to FeMo-co, with proton transfer coupled to the radiolytic reduction process at 77 K, in which case, the (S = ½) cofactor of E2* is the product of PCET (and the state thus may be denoted, E2*(2H)) that is trapped in a conformation appropriate to E1(H). Then, during cryoannealing E2*(2H) undergoes conformational relaxation to the equilibrium E2(2H) (S = 3/2) state seen when nitrogenase is freeze-trapped under TO. (ii) Alternatively, cryoreduction/annealing could decouple electron and proton transfer to FeMo-co, such that the E2* state is produced by electron injection into FeMo-co without proton delivery (and the MoFe state thus might be denoted E2*(H)). In this case, the present results would indicate that during 216 K cryoannealing E2*(H) undergoes rate-limiting conformational relaxation followed by rapid, non-rate limiting, proton delivery to form the equilibrium E2(2H) state. Possible structure-modulation of FeMo-co during the catalytic cycle has been considered many times in the past, one example being as a possible role for the interstitial carbide of FeMo-co.[40–42]
Analogy to our studies of cryoreduction of oxy-ferroheme complexes[23] support pathway (i): cryoreduction of E1(H) at 77 K generates E2*(2H) through PCET, namely the delivery of both an electron and proton to FeMo-co. During radiolysis of an oxy-ferrous hemoprotein[23] at low temperature, the initial (primary) product of electron injection is the non-protonated ferric-peroxo intermediate. However, when the parent oxy hemoprotein complex has a proton-delivery network tied to the peroxo ligand through H-bonding to a water molecule, the peroxo intermediate is promptly protonated upon cryoreduction at 77 K or below.[23] Indeed, with oxy heme oxygenase we saw such PCET through prompt protonation by proton tunneling at 6 K![25] Detailed analyses of the MoFe protein crystal structure[43–44] in fact have identified three proton-delivery networks tied to FeMo-co: a water-filled channel running from the protein exterior to the homocitrate ligand of FeMo-co and two hydrogen-bonded chains to sulfur atoms of FeMo-co.[43–44] The presence of these networks supports the proposal that E2* is the product of 77 K PCET to E1(H), but is trapped in a non-equilibrium S = ½ conformation, E2*(2H), which relaxes to the equilibrium E2(2H) (S = 3/2) conformer during cyroannealing. This proposal is even more strongly supported by our cryoannealing studies of E4(4H). These experiments show that E2(2H) and E4(4H) indeed have their full complement of n protons ‘stored’ at FeMo-co, for n = 4, as two bridging hydrides and two protons: these two states respectively relax to the resting state by the stoichiometric release of ‘protons’ in the form of one and by two H2,[3, 35]
This proposal implies that the proton delivery network that supplies FeMo-co with the proton during PCET must likewise be well-poised for proton delivery in fluid-solution at ambient temperatures, and can deliver the proton essentially in synchrony with electron delivery. As is well understood,[18–19] this behavior would seem mandatory in order to minimize the driving force needed to reduce FeMo-co, because it obviates the energetically costly buildup of charge associated with ET in the absence of proton transfer. It would also seem mandatory in reducing the driving force needed to reduce N2: the electron delivery by the Fe protein in effect would correspond to transfer of the net-neutral components of an H atom, not electron delivery first, followed by delivery of a proton. The LT kinetic scheme incorporates the same ‘Fe-protein cycle’, at each of the n = 1–8 steps of electron/proton delivery, and thus would at least incorporate the same TO processes described here at each step. The alternative interpretation of our data, that proton delivery occurs only after a conformation/spin change that occurs after electron delivery cannot be ruled out, but would seem to carry all the disadvantages implied directly above.
Summary
Figure 9 summarizes our view of the electron/proton transfer events and conformational changes that occur during accumulation of [e−/H+] by the MoFe protein, starting with the non-catalytic Mox state, through the E2(2H) stage of the LT scheme (Fig 1). In keeping with this scheme, the same reduction process is taken to occur at each stage: the gated/deficit-spending electron delivery shown to occur in E1(1H) → E2(2H) reduction.[12–16]
Reduction of the Mox state of the MoFe protein to E0 was previously shown to occur through [e−/H+] PCET to MoFe protein,[20] but with the proton delivered to a site remote from the paramagnetic metal ions of FeMo-co.[21] The present cryoreduction/annealing study shows FeMo-co of the Mox state does not undergo a major change of conformation during this process, thus acting merely as a ‘simple’ electron-transfer cluster. In contrast, cryoreduction/Mossbauer studies have shown that FeMo-co undergoes substantial conformational changes during the reduction of E0 to E1(1H), the first step in catalysis.
Likewise, the present cryoreduction/annealing/EPR studies show that FeMo-co in the E1(1H) and E2(2H) states of the nitrogenase catalytic cycle exhibit significant conformational differences. The experimental results further suggest that the E1(1H) → E2(2H) step involves coupled delivery of a proton and electron (PCET) to FeMo-co of E1(H) subsequent to the gating step associated with electron delivery from reduced Fe protein, with the proton-delivery likely involving the proton network(s) seen crystallographically.[43–44] This PCET generates a non-equilibrium S = ½ form E2(2H)*, which subsequently undergoes conformational relaxation and attendant change in FeMo-co spin state, to generate the equilibrium E2(2H) (S = 3/2) state.
These experiments have additional implications. Turning to the P cluster, we note the observation that the strongly reducing electrons generated by cryoradiolysis do not reduce P cluster. Rather, the observed oxidation of the P cluster under these reducing conditions supports the idea that electron delivery from reduced Fe protein to MoFe protein cannot occur via the stepwise process that begins with reduction of P cluster by reduced Fe protein with follow-up reduction of FeMo-co by reduced P cluster. Rather, this result supports our ‘deficit spending’ model for electron delivery, in which the first step is reduction of FeMo-co by PN cluster, followed by rapid reduction of the resulting Pox by reduced Fe protein.[12–16]
Finally, the reduction of FeMo-co influences the P-cluster conformation, while the binding of Fe protein conformationally modulates the relaxation of FeMo-co during the E2* ⟹ E2 relaxation. Such conformational coupling between FeMo-co and P-cluster, and between Fe protein binding and FeMo-co, could play a role in the gated ET from reduced Fe protein to FeMo-co revealed in our earlier work.[16]
Supplementary Material
Acknowledgments
This work was supported by the NIH (GM 111097;BMH) and the Department of Energy, Office of Basic Energy Sciences (LCS and DRD).
Abbreviation used
- PCET
proton coupled electron transfer
Footnotes
Supporting Information: Supporting information for this article is available on the WWW under http://dx.doi.org/10.1002/ijch.2010xxxxx
References
- 1.Smil V. Enriching the Earth: Fritz Haber, Carl Bosch, and the Transformation of World Food Production. Cambridge, MA: MIT Press; 2001. [Google Scholar]
- 2.Burgess BK, Lowe DJ. Chem Rev. 1996;96:2983–3012. doi: 10.1021/cr950055x. [DOI] [PubMed] [Google Scholar]
- 3.Hoffman BM, Lukoyanov D, Yang ZY, Dean DR, Seefeldt LC. Chem Rev. 2014;114:4041–4062. doi: 10.1021/cr400641x. [DOI] [PMC free article] [PubMed] [Google Scholar]
- 4.Thorneley RNF, Lowe DJ. Metal Ions in Biology. 1985;7:221–284. [Google Scholar]
- 5.Thorneley R, Lowe D. Biochem. J. 1984;224:887. doi: 10.1042/bj2240887. [DOI] [PMC free article] [PubMed] [Google Scholar]
- 6.Lukoyanov D, Yang ZY, Khadka N, Dean DR, Seefeldt LC, Hoffman BM. J. Am. Chem. Soc. 2015;137:3610–3615. doi: 10.1021/jacs.5b00103. [DOI] [PMC free article] [PubMed] [Google Scholar]
- 7.Yang Z-Y, Khadka N, Lukoyanov D, Hoffman Brian M, Dean Dennis R, Seefeldt Lance C. PNAS. 2013;110:16327–16332. doi: 10.1073/pnas.1315852110. [DOI] [PMC free article] [PubMed] [Google Scholar]
- 8.Hoffman BM, Lukoyanov D, Dean DR, Seefeldt LC. Acc. Chem. Res. 2013;46:587–595. doi: 10.1021/ar300267m. [DOI] [PMC free article] [PubMed] [Google Scholar]
- 9.Lukoyanov D, Yang Z-Y, Barney BM, Dean DR, Seefeldt LC, Hoffman BM. PNAS. 2012;109:5583–5587. doi: 10.1073/pnas.1202197109. [DOI] [PMC free article] [PubMed] [Google Scholar]
- 10.In contrast, for example to the suggestion that roughly stoichioimetric production of H2 occurs at the P cluster in a mechanistically uncoupled fashion, ref xx.
- 11.LS will supply.
- 12.Duval S, Danyal K, Shaw S, Lytle AK, Dean DR, Hoffman BM, Antony E, Seefeldt LC. PNAS. 2013;110:16414–16419. doi: 10.1073/pnas.1311218110. [DOI] [PMC free article] [PubMed] [Google Scholar]
- 13.Seefeldt LC, Hoffman BM, Dean DR. Curr. Opin. Chem. Biol. 2012;16:19–25. doi: 10.1016/j.cbpa.2012.02.012. [DOI] [PMC free article] [PubMed] [Google Scholar]
- 14.Mayweather D, Danyal K, Dean DR, Seefeldt LC, Hoffman BM. Biochemistry. 2012;51:8391–8398. doi: 10.1021/bi301164j. [DOI] [PMC free article] [PubMed] [Google Scholar]
- 15.Danyal K, Dean DR, Hoffman BM, Seefeldt LC. Biochemistry. 2011;50:9255–9263. doi: 10.1021/bi201003a. [DOI] [PMC free article] [PubMed] [Google Scholar]
- 16.Danyal K, Mayweather D, Dean DR, Seefeldt LC, Hoffman BM. J. Am. Chem. Soc. 2010;132:6894–6895. doi: 10.1021/ja101737f. [DOI] [PMC free article] [PubMed] [Google Scholar]
- 17.Yoo SJ, Angove HC, Papaefthymiou V, Burgess BK, Münck E. J. Am. Chem. Soc. 2000;122:4926–4936. [Google Scholar]
- 18.Weinberg DR, Gagliardi CJ, Hull JF, Murphy CF, Kent CA, Westlake BC, Paul A, Ess DH, McCafferty DG, Meyer TJ. Chem Rev. 2012;112:4016–4093. doi: 10.1021/cr200177j. [DOI] [PubMed] [Google Scholar]
- 19.Migliore A, Polizzi NF, Therien MJ, Beratan DN. Chem Rev. 2014;114:3381–3465. doi: 10.1021/cr4006654. [DOI] [PMC free article] [PubMed] [Google Scholar]
- 20.O'Donnell MJ, Smith BE. Biochem. J. 1978;173:831–838. doi: 10.1042/bj1730831. [DOI] [PMC free article] [PubMed] [Google Scholar]
- 21.Hoffman BM, Roberts JE, Orme-Johnson WH. J. Am. Chem. Soc. 1982;104:860–862. [Google Scholar]
- 22.Hageman RV, Burris RH. PNAS. 1978;75:2699–2702. doi: 10.1073/pnas.75.6.2699. [DOI] [PMC free article] [PubMed] [Google Scholar]
- 23.Davydov R, Hoffman BM. Archives of Biochemistry and Biophysics. 2011;507:36–43. doi: 10.1016/j.abb.2010.09.013. [DOI] [PMC free article] [PubMed] [Google Scholar]
- 24.Davydov R, Laryukhin M, Ledbetter-Rogers A, Sono M, Dawson JH, Hoffman BM. Biochemistry. 2014;53:4894–4903. doi: 10.1021/bi500296d. [DOI] [PMC free article] [PubMed] [Google Scholar]
- 25.Davydov R, Chemerisov S, Werst DE, Rajh T, Matsui T, Ikeda-Saito M, Hoffman BM. J. Am. Chem. Soc. 2004;126:15960–15961. doi: 10.1021/ja044646t. [DOI] [PubMed] [Google Scholar]
- 26.Christiansen J, Goodwin PJ, Lanzilotta WN, Seefeldt LC, Dean DR. Biochemistry. 1998;37:12611–12623. doi: 10.1021/bi981165b. [DOI] [PubMed] [Google Scholar]
- 27.Glasoe PK, Long FA. J. Phys. Chem. 1960;64:188–190. [Google Scholar]
- 28.Davoust CE, Doan PE, Hoffman BM. J. Magn. Reson. 1996;119:38–44. [Google Scholar]
- 29.Zipse H, Artin E, Wnuk S, Lohman GJS, Martino D, Griffin RG, Kacprzak S, Kaupp M, Hoffman B, Bennati M, Stubbe J, Lees N. J. Am. Chem. Soc. 2009;131:200–211. doi: 10.1021/ja806693s. [DOI] [PMC free article] [PubMed] [Google Scholar]
- 30.Lukoyanov D, Yang ZY, Duval S, Danyal K, Dean DR, Seefeldt LC, Hoffman BM. Inorg. Chem. 2014;53:3688–3693. doi: 10.1021/ic500013c. [DOI] [PMC free article] [PubMed] [Google Scholar]
- 31.Fisher K, Newton WE, Lowe DJ. Biochemistry. 2001;40:3333–3339. doi: 10.1021/bi0012686. [DOI] [PubMed] [Google Scholar]
- 32.Davydov R, Hoffman BM. J. Biol. Inorg. Chem. 2008;13:357–369. doi: 10.1007/s00775-007-0328-5. [DOI] [PubMed] [Google Scholar]
- 33.Cryoirradiation further creates weak features in the low-field region at g 4.91 and 5.31 (Fig 4), as well as again causing the appearance of a weak S = ½ Pox signal (not shown).
- 34.Those spectra also show an additional feature at g3 = 1.78 that can be assigned to a second conformer of cryogenerated Pox, which relaxes to the g3 = 1.82 conformation during step-annealing.
- 35.Lukoyanov D, Barney BM, Dean DR, Seefeldt LC, Hoffman BM. PNAS. 2007;104:1451–1455. doi: 10.1073/pnas.0610975104. [DOI] [PMC free article] [PubMed] [Google Scholar]
- 36.Rupnik K, Hu Y, Lee CC, Wiig JA, Ribbe MW, Hales BJ. J. Am. Chem. Soc. 2012;134:13749–13754. doi: 10.1021/ja304077h. [DOI] [PMC free article] [PubMed] [Google Scholar]
- 37.Wilson PE, Nyborg AC, Watt GD. Biophysical Chemistry. 2001;91:281–304. doi: 10.1016/s0301-4622(01)00182-x. [DOI] [PubMed] [Google Scholar]
- 38.Lukoyanov D, Yang Z-Y, Dean DR, Seefeldt LC, Hoffman BM. J. Am. Chem. Soc. 2010;132:2526–2527. doi: 10.1021/ja910613m. [DOI] [PMC free article] [PubMed] [Google Scholar]
- 39.Christiansen J, Tittsworth RC, Hales BJ, Cramer SP. J. Am. Chem. Soc. 1995;117:10017–10024. [Google Scholar]
- 40.Spatzal T, Aksoyoglu M, Zhang LM, Andrade SLA, Schleicher E, Weber S, Rees DC, Einsle O. Science. 2011;334:940–940. doi: 10.1126/science.1214025. [DOI] [PMC free article] [PubMed] [Google Scholar]
- 41.Lancaster KM, Roemelt M, Ettenhuber P, Hu Y, Ribbe MW, Neese F, Bergmann U, DeBeer S. Science. 2011;334:974–977. doi: 10.1126/science.1206445. [DOI] [PMC free article] [PubMed] [Google Scholar]
- 42.Anderson JS, Rittle J, Peters JC. Nature. 2013;501:84–87. doi: 10.1038/nature12435. [DOI] [PMC free article] [PubMed] [Google Scholar]
- 43.Durrant MC. Biochem. J. 2001;355:569–576. doi: 10.1042/bj3550569. [DOI] [PMC free article] [PubMed] [Google Scholar]
- 44.Dance I. Inorg. Chem. 2013;52:13068–13077. doi: 10.1021/ic401818k. [DOI] [PubMed] [Google Scholar]
Associated Data
This section collects any data citations, data availability statements, or supplementary materials included in this article.


