Microfluidic chambers enable imaging of moss development from early to late developmental stages at cellular and subcellular resolution.
Abstract
Key developmental processes that occur on the subcellular and cellular level or occur in occluded tissues are difficult to access, let alone image and analyze. Recently, culturing living samples within polydimethylsiloxane (PDMS) microfluidic devices has facilitated the study of hard-to-reach developmental events. Here, we show that an early diverging land plant, Physcomitrella patens, can be continuously cultured within PDMS microfluidic chambers. Because the PDMS chambers are bonded to a coverslip, it is possible to image P. patens development at high resolution over long time periods. Using PDMS chambers, we report that wild-type protonemal tissue grows at the same rate as previously reported for growth on solid medium. Using long-term imaging, we highlight key developmental events, demonstrate compatibility with high-resolution confocal microscopy, and obtain growth rates for a slow-growing mutant. By coupling the powerful genetic tools available to P. patens with long-term growth and imaging provided by PDMS microfluidic chambers, we demonstrate the capability to study cellular and subcellular developmental events in plants directly and in real time.
To study developmental processes in plants, the sample must often be dissected to access the area of the plant where the tissue is developing and differentiating. As an example, floral developmental studies necessitate dissecting the emerging flower. Because taking time points requires serial specimens, it has been difficult to follow developmental processes within a single specimen. One major exception has been the ability to follow developmental processes in roots. Even here, though, there is a limitation to the number of hours over which it is possible to image the root (Meier et al., 2010; Clark et al., 2011; Grossmann et al., 2011). However, with the advent of microfluidic devices, it has been possible to monitor root growth over much longer time courses (Grossmann et al., 2011). And, more recently, Jiang et al. (2014) developed microfluidic-based devices to monitor whole Arabidopsis (Arabidopsis thaliana) plant growth in the first few weeks after germination as a means for high-throughput mutant screening. Microfluidic devices have also been used for imaging excised Arabidopsis embryos to observe early patterning events (Gooh et al., 2015). These studies establish a basis for following often hard-to-reach developmental processes over time in a single specimen.
Here, we describe the design and utilization of polydimethylsiloxane (PDMS) microfluidic chambers for long-term imaging of development in the moss Physcomitrella patens. P. patens’ simple body plan and excellent cytology has garnered interest in this system as a model organism to study the evolution of developmental processes in plants on the cellular and subcellular levels (Prigge and Bezanilla, 2010). Additionally, the ability to efficiently edit the genome via homologous recombination has positioned P. patens as a powerful model system to uncover the molecular basis of developmental events.
P. patens establishes a plant by germinating from a haploid spore, regenerating from homogenized tissue, or regenerating from a protoplast. It first forms a filamentous network of tissue known as protonemata, in which the apical cell within a filament divides, producing all the cells within the filament. Subapical cells can also divide to form branches off the initial filament. As the plant continues to grow radially out from the initial spore, more branching events occur, and eventually the protonemal tissue forms a radially symmetric plant with denser filamentous tissues near the center. Within this meshwork, buds form off protonemal filaments and eventually develop into leafy shoots, known as gametophores.
Typically, P. patens is grown on solid media. Even with a relatively simple body plan, it has been difficult to image events occurring over long time periods within the dense center of the protonemal meshwork. The two main approaches used to image protonemata possess inherent limitations. In one method, protonemata are placed on a thin pad of agar composed of medium, sealed under a coverslip, and immediately imaged. The second method relies on first culturing protonemata in a dish with a coverslip at the bottom that is covered with a thin film of agar in medium for several days. After the protonemata have grown close enough to the coverslip, then live cell imaging is performed. The first method is rapid and amenable to high-resolution imaging of a majority of the sample. However, presumably due to insufficient gas exchange, cells often stop growing after a few hours. With the second approach, protonemal tissue grows very well, but often few cells reach the coverslip surface, making it difficult to perform high-resolution imaging on a large fraction of the sample. It is particularly challenging to image slow-growing mutant lines using the second approach because the mutant lines often take several weeks to reach the coverslip surface, by which time the thin agar has dried out.
Microfluidic devices described here have overcome the major limitations of these standard imaging approaches. Devices are fabricated as PDMS replicas, which are bonded to dishes with a coverslip bottom, providing a chamber that is 30 µm deep and filled with liquid growth medium. Since PDMS is highly air permeable (Merkel et al., 2000), it is not necessary to continuously flow through medium. In fact, P. patens grows in these devices for several weeks, thereby improving upon the agar pad method and allowing for an opportunity to image a single specimen over developmental time. Additionally, because the plant is constrained to a 30-µm-deep chamber above the coverslip, the majority of the tissue is within the optimal range for wide-field and confocal microscopy. This not only enables high-resolution imaging of protonemal growth but also facilitates the observation of bud formation and gametophore development at the cellular level, thus overcoming the limitations of long-term imaging in glass-bottom chambers overlaid with thin agar.
In addition to long-term imaging at cellular and subcellular resolution, introducing pharmacological agents by microfluidic flow is simple, thereby enabling rapid perturbations to the sample. With flexibility in design and implementation, we envision that microfluidic devices will provide plant biologists the opportunity to study a number of different developmental and physiological processes in mosses. It may be possible to extend this technology to other small plant species, in particular unicellular algae, or tissues from other plants that can be confined within the microfluidic device.
RESULTS
Wild-Type Plants Grow Well in Microfluidic Chambers
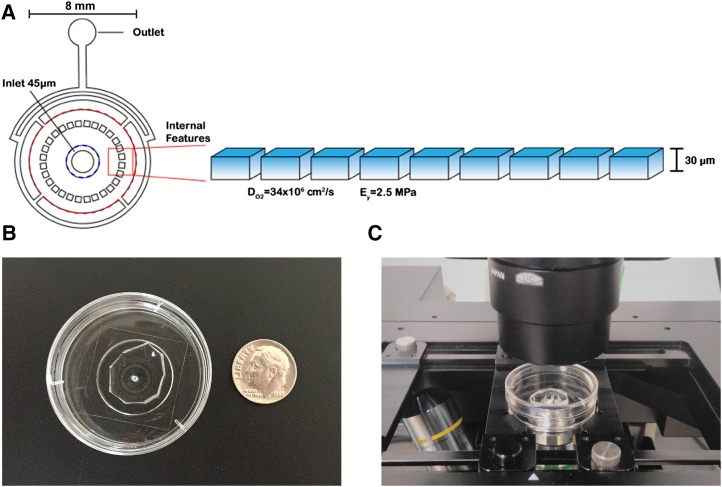
For propagation purposes, P. patens tissue is typically homogenized and spread onto a cellophane covering solid medium. To load the chambers, a small amount of this tissue, once regenerated, was gently homogenized by manual pipetting in liquid medium, and a few small clumps of tissue were loaded into a central port within the devices. The microfluidic devices were designed with a large central port opening into a chamber that is 45 µm from the coverslip (Fig. 1). By gently applying pressure with a syringe filled with liquid medium, we pushed the tissue into the narrower portion of the devices, a 30-µm-deep chamber just beyond the central port (Fig. 1; Supplemental Fig. S1). Barriers are positioned radially, helping to support the roof of the chamber and prevent tissue from clogging the flow-through channels (Fig. 1). Once the tissue entered the 30-µm chamber, continued gentle pressure from the syringe filled the device with liquid medium. The entire device was then completely submersed in liquid medium and placed under continuous light (47 μE m−2 s−1).
Figure 1.
A schematic illustration of microfluidic growth chambers and their internal structure. A, Chambers have three regions: (1) central 45-µm-deep sector (within blue dashed circle), (2) growth chamber (between blue dashed circle and red dashed circle), and (3) flow control channels (outside the red dashed circle). The volumes associated with these are 0.57 µL, 1.36 µL, and 0.25 µL, respectively. Moss is seeded by injection into the center inlet and allowed to grow radially outward. Growth chambers used in these studies were 30 μm deep. The high diffusivity of oxygen in PDMS (34 × 106 cm2/s; Dendukuri et al., 2008) provided ample exchange with the environment to support growth. The elasticity of PDMS (2.5 MPa; Tan et al., 2003) was sufficient to provide barriers to growth that could not be deformed or penetrated by growing tissue. B, Image of a chamber next to a dime as a size reference. C, Image of a chamber mounted on an inverted microscope.
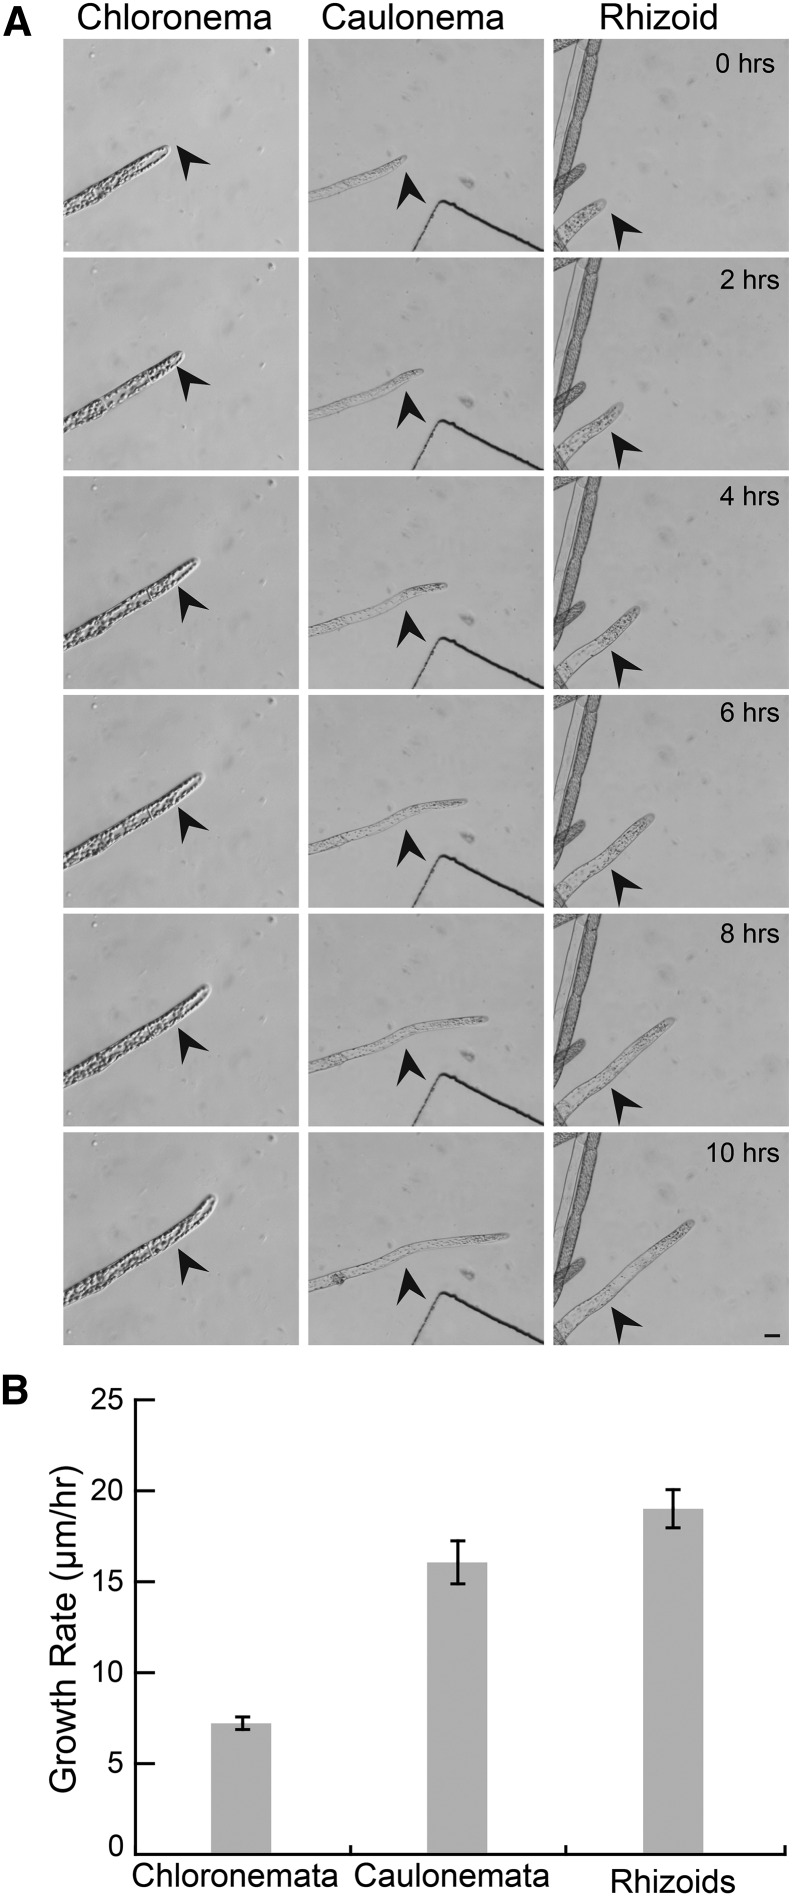
In order to utilize microfluidic devices to observe developmental events in P. patens, we first sought to establish that moss tissue regenerates and grows within PDMS chambers. P. patens protonemal tissue is comprised of two cell types, chloronemata and caulonemata. Both cell types grow via localized expansion at the tip of the apical cell, a process known as tip growth. In microfluidic chambers, we observed both chloronemal and caulonemal filaments growing over the course of weeks. Chloronemal cells grew at 7.21 ± 1.72 μm/h (n = 25) and caulonemal cells grew at 16.07 ± 4.85 μm/h (n = 17; Fig. 2; Supplemental Movie S1). These rates are in remarkable agreement with previous measurements of protonemal growth rates (Rounds and Bezanilla, 2013). We also observed growing rhizoids (Fig. 2; Supplemental Movie S1), a third tip-growing cell type. After a gametophore bud initial begins to expand, rhizoids form at the base and grow. In microfluidic chambers, we observed rhizoids growing at 19.01 ± 5.24 μm/h (n = 25), slightly faster than caulonemata.
Figure 2.
Wild-type tip-growing cells grow well in chambers. A, Chloronemata, caulonemata, and rhizoids grow well in microfluidic devices. Black arrows indicate start position at time 0. Scale bar, 10 µm. See Supplemental Movie S1. B, Quantification of protonemal and rhizoid growth rate. Error bars indicate se.
P. patens also regenerates from a single cell, either a spore or a protoplast. To test whether we could observe this process in PDMS chambers, we loaded freshly made protoplasts into the chamber. The chambers were then submerged in protoplast regeneration medium and placed under continuous light. After 9 d, we observed regenerating plants, which had rebuilt their cell walls and undergone several cell divisions (Fig. 3A). We then replaced the protoplast regeneration medium in the chambers and in the dishes with Hoagland medium. The apical cell started to grow with normal morphology after 6 h, and multiple apical cells from branches emerged after 15 h (Fig. 3; Supplemental Movie S2).
Figure 3.
Protoplast regeneration in PDMS chambers. A, A plant regenerated from a protoplast, rebuilt its cell wall, and underwent several cell divisions within 9 d. The initial protoplast is outlined in a dashed black line. Scale bar, 50 µm. B, After protoplast regeneration medium was replaced with Hoagland medium in the microfluidic chamber, cells regenerated from a single protoplast (outlined in a dashed black line) were immediately imaged with bright-field on a wild-field microscope. The apical cell grew with normal morphology after 6 h. Multiple apical cells emerging from branches were observed after 15 h. Scale bar, 50 µm. See Supplemental Movie S2.
Microfluidic Chambers Allow for Observation of Developmental Events
Chloronemata and caulonemata are sequential developmental tissues within protonemata. Both spores and regenerating protoplasts form chloronemata. Chloronemata are defined in the literature as being chloroplast rich and having transverse cell plates. After 6 to 7 d of growth, chloronemal apical cells begin to differentiate into caulonemal cells. Caulonemal cells are defined as being relatively chloroplast poor and having oblique cell plates (Reski, 1998; Schween et al., 2003; Menand et al., 2007; Pressel et al., 2008). Observing protonemata growing within microfluidic chambers affords the opportunity to watch this differentiation occur.
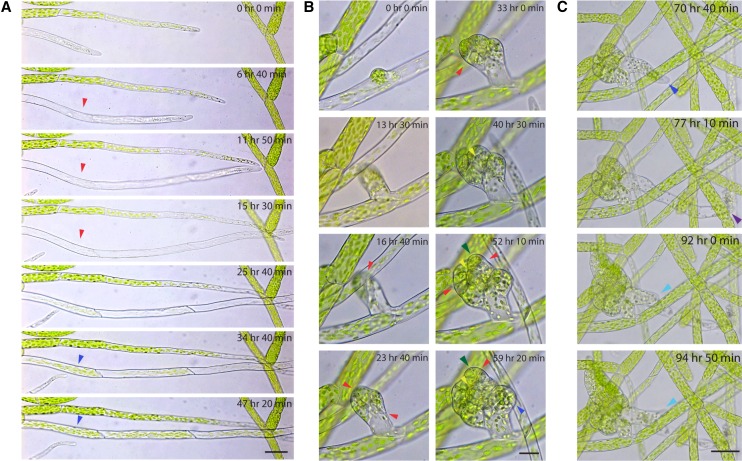
Based on these definitions, we expected caulonemal cells to remain chloroplast poor. However, we were surprised to observe caulonemal cells filling with chloroplasts within 2 d after cell division (Fig. 4A; Supplemental Movie S3). These observations are in agreement with data reported previously that caulonemata have a high number of chloroplasts at maturity (Pressel et al., 2008). Thus, identification of cell type solely by chloroplast density may not be diagnostic.
Figure 4.
P. patens developmental events observed in microfluidic chambers. Wild-type moss protonemal tissue growing in microfluidic chambers was imaged with bright-field on a wild-field microscope. A, A wild-type caulonemal subapical cell (red arrowheads) transformed into a chloroplast-rich cell (blue arrowheads) after a day. Scale bar, 50 µm. See Supplemental Movie S3. B, Development of a bud initial from a single cell. Cell division events were clearly visible (red arrowheads). The formation of the tetrahedral meristem cell (yellow arrowheads) and the leaf initial (green arrowheads) were observed after 40 h. A rhizoid initiated from the lateral-basal cell (dark blue arrowhead). Scale bar, 20 µm. See Supplemental Movie S4. C, This particular rhizoid exploded (purple arrowhead), and a new rhizoid tip reinitiated from the remaining subapical cell after 15 h (light blue arrowhead). Scale bar, 50 µm. See Supplemental Movie S4.
After 10 to 11 d, protonemal tissue begins to develop leafy gametophores, which form from buds that emerge from protonemata. Imaging developing gametophores has been challenging due to the density of older protonemal tissue and the fact that leafy shoots grow upward and away from the coverslip in a glass-bottom dish. In microfluidic chambers, however, we were able to easily observe the different stages of gametophore development over a long period of time. As an example, we show the development of a bud initial from a single cell (Fig. 4B; Supplemental Movie S4). Gametophore bud initiation is a developmental switch between two-dimensional and three-dimensional growth, which has been described in detail by Harrison et al. (2009). Imaging with bright-field on a wide-field microscope, we clearly observed the bud initial cell enlarge and obtain a roundish shape, followed by the first oblique cell division that sets up the apical-basal axis within 17 h. The apical and basal cells both divided about 8 h later, perpendicularly to the first division plane. Subsequent divisions in the apical domain were not always clearly visible, but we were able to observe the establishment of the tetrahedral meristem cell (Fig. 4B, yellow arrowhead) and the leaflet, or phyllid, initial (Fig. 4B, green arrowhead) after another 16 h. The basal lateral cell did not divide further but initiated a rhizoid (Fig. 4B, dark blue arrowhead) 36 h later. The rhizoid expanded before phyllid expansion occurred (Fig. 4B). After 17 h of continuous growth, this particular rhizoid exploded (Fig. 4C; Supplemental Movie S4), which is rarely observed. However, it afforded the opportunity to observe events occurring off of wounded tissues. Fifteen hours after the rhizoid tip exploded, the remaining subapical cell reinitiated tip growth (Fig. 4C, light blue arrowhead), exemplifying the ease with which P. patens reprograms differentiated cells upon tissue wounding.
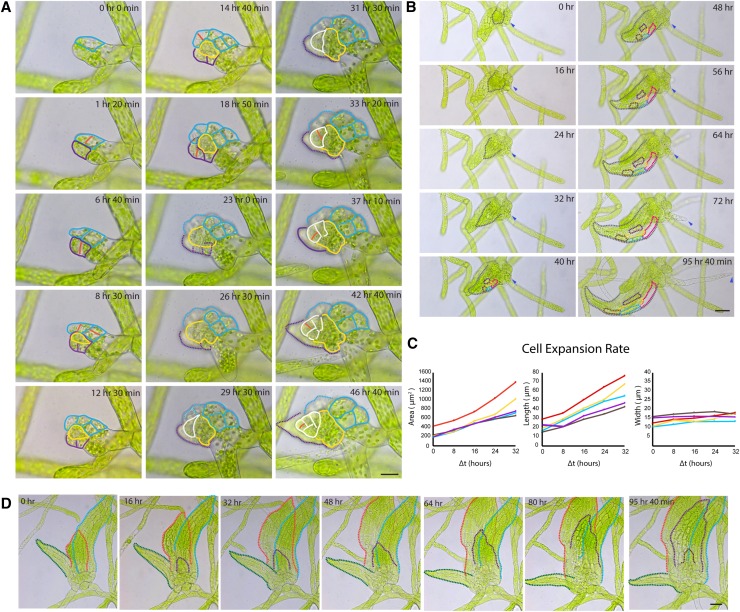
In addition to bud formation and rhizoid initiation and growth, we observed two phases during phyllid development (Fig. 5; Supplemental Movies S5–S7). During initiation, the leaf apical cell divides every 4 to 6 h producing relatively small cells (Fig. 5A; Supplemental Movie S5). The expansion phase occurred once a miniature leaf formed. Phyllids were observed to expand mostly by cell expansion, while cell divisions were rarely observed (Fig. 5B; Supplemental Movie S6). Expansion rates among cells were comparable, and cells expanded more longitudinally (Fig. 5C). Despite the tight three-dimensional confinement in which the plants were grown, we were able to follow gametophore development through the expansion of two to three phyllids (Fig. 5D; Supplemental Movie S7). Together, these data demonstrate that growing P. patens in microfluidic chambers uniquely facilitates imaging of key developmental events. Additionally, the long-term growth afforded by these chambers allows for imaging late developmental stages with exquisite resolution.
Figure 5.
Phyllid initiation and expansion during gametophore development. Wild-type moss protonemal tissue in microfluidic chambers was imaged with bright-field on a wild-field microscope. A, During early stages of phyllid initiation, cell division occurred every 4 to 6 h. Cell lineages were traced with different colors when cell boundaries were visible. Red lines indicate new cell divisions that were clearly observed. Scale bar, 20 µm. See Supplemental Movie S5. B, Gray dash lines outline an expanding phyllid. Five cells within this phyllid were traced with different colors over time. Cell expansion was clearly observed, while cell division was rarely seen. Blue arrowheads indicate a rhizoid emerging from the base of this gametophore. Scale bar, 50 µm. See Supplemental Movie S6. C, Cell expansion rates were measured from the five cells outlined in B. Area, cell length, and cell width of each cell were measured at 40, 48, 56, 64, and 72 h from the time-lapse acquisition. Color lines in this graph correspond to the cell with the same color in B. D, Even with confinement, bud initials were able to develop and expand three or four phyllids. Scale bar, 50 µm. See Supplemental Movie S7.
Cells in Microfluidic Chambers Are Amenable to Confocal Microscopy
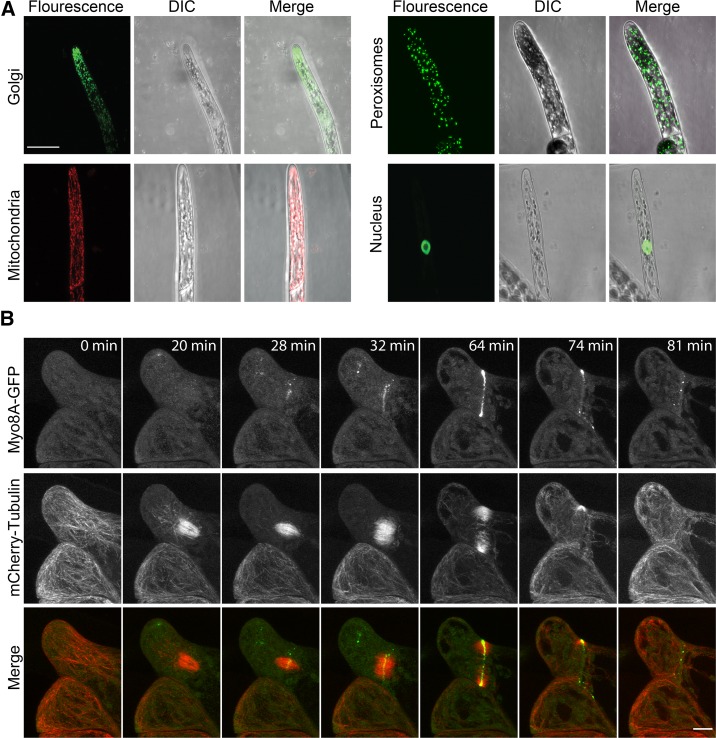
To test if the microfluidic chambers enabled high-resolution imaging with confocal microscopy, we imaged stable transgenic lines with genetically encoded fluorophores targeted to specific organelles and subcellular structures (Fig. 6A). For the organelle lines, Z-projections of an apical protonemal cell in each line revealed an expected distribution of organelles (Fig. 6A). Golgi stacks were visible, and we observed a tip-centric gradient—something not observed for mitochondria and peroxisomes, in agreement with a previous study (Furt et al., 2012). The nucleus was centrally located in the apical cell, and the silhouette of the nucleolus was visible. We also imaged a transgenic moss line expressing mCherry-tubulin and Myo8A-GFP (Wu and Bezanilla, 2014). We show here a cell division event in a rhizoid emerging from the base of a gametophore (Fig. 6B; Supplemental Movie S8). Microtubule structures are clearly visible in these images, demonstrating the versatility of microfluidic growth chambers in facilitating high-resolution imaging even in hard-to-reach tissue types like the gametophore.
Figure 6.
Microfluidic chambers are amenable to confocal microscopy. A, YFP targeted to the Golgi reveals a tip-focused accumulation of Golgi dictyosomes. mCherry targeted to the mitochondria. GFP targeted to the peroxisomes. GFP-GUS fusion targeted to the nucleus. Scale bar, 25 µm. B, A cell division event observed in a rhizoid emerging from the base of a gametophore. Moss tissue expressing Myo8A-GFP (green) and mCherry-tubulin (red) was imaged on a scanning confocal microscope. Images are maximum intensity projection of z-stacks from a time-series acquisition. Scale bar, 10 µm. See Supplemental Movie S8.
Microfluidic Chambers Enable Real-Time Pharmacological Inhibitory Studies
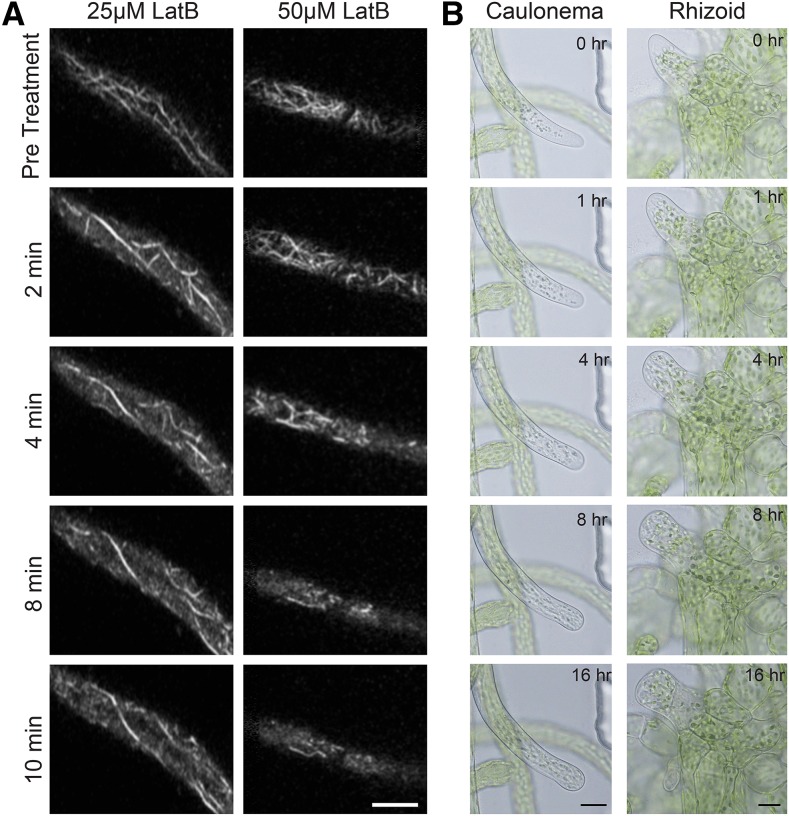
Microfluidic chambers are attractive because of the ease with which it is possible to perform pharmacological flow-through experiments. To this end, we monitored populations of cortical actin after flowing through an actin-depolymerizing drug, Latrunculin B (LatB). A stable line expressing the F-actin visual reporter, LifeAct-mRuby, was imaged in the chambers prior to the addition of 25 μm or 50 μm LatB. The same cell was then imaged after flowing in LatB. Within 2 min of flowing in the inhibitor, we observed the cortical actin population disintegrate (Fig. 7A; Supplemental Movie S9).
Figure 7.
Functional drug flow-through experiments. A, Subapical cells expressing LifeAct-mRuby2 were imaged near the cortex with a scanning confocal microscope. Treatment with 25 µm (A) and 50 µm LatB (B) rapidly depolymerizes most actin filaments. Every 2 min, 30 s of no-delay acquisition was acquired for each cell (see Supplemental Movies S1–S11). A single image from each acquisition is shown. See Supplemental Movie S9. B, Tip growth in caulonemal and rhizoid cells was inhibited by 50 µm LatB. Approximately 1 mL of medium containing 50 µm LatB was injected into the PDMS chamber at time 0. Images were acquired every 10 min with bright-field on a wide-field microscope. Selected time points are shown. See Supplemental Movie S10.
Previous studies employed 25 μm LatB to abolish F-actin in apical cells (Wu and Bezanilla, 2014). However, we found that we needed to increase the LatB concentration to 50 µm to eliminate the majority of F-actin in apical cells (data not shown). Imaging of subapical cells reveals that within 10 min of adding 50 µm LatB, only the thickest actin cables remained. In contrast, a larger number of filaments were still present with 25 µm LatB (Fig. 7A; Supplemental Movie S9). It is possible that the PDMS may absorb some of the inhibitor, necessitating higher concentrations of LatB, which has been observed by others (Burke et al., 2014; Suarez et al., 2015). We found that 50 µm LatB was sufficient to inhibit tip growth in caulonemal and rhizoid cells. Tip growth stopped within 1 h of LatB application, and swelling of the tips became observable within 4 h. Both cells did not resume tip growth within the 16-h imaging period (Fig. 7B; Supplemental Movie S10).
Microfluidic Chambers Facilitate the Study of Mutants
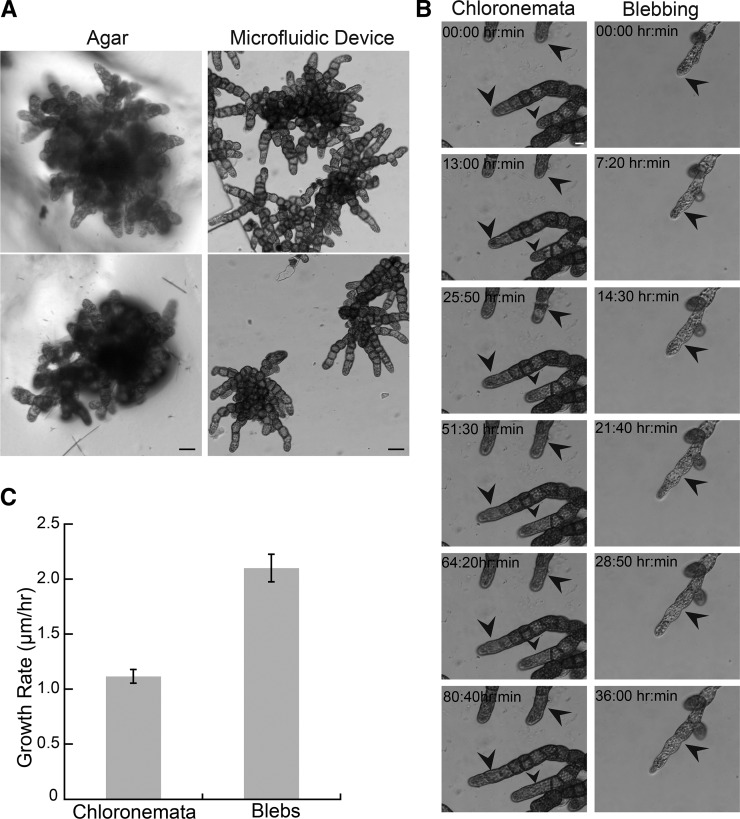
Given the ease with which wild-type moss grows, we sought to use microfluidic chambers to gain insight on the growth and development of slow-growing mutants. BRICK1 (BRK1) is a stabilizer of the SCAR/WAVE complex, itself an activator of the Arp2/3 complex, and therefore a regulator of the actin cytoskeleton. BRICK1 knockout plants have severe protonemal growth phenotypes as described by Perroud and Quatrano (2008). By exploiting long imaging times afforded by these microfluidic chambers, we continuously observed the growth of Δbrk1 plants over the course of days (Fig. 8; Supplemental Movie S11). Indeed, Δbrk1 grew slower than wild type with an average rate of 1.12 ± 0.36 μm/h (n = 34), a full order of magnitude slower than wild type.
Figure 8.
Δbrk1 plants growing in microfluidic chambers. A, Comparison of ∆brk1 plants grown for 2 weeks on agar or in microfluidic chambers. Scale bar, 50 µm. B, left column, ∆brk1 chloronemata growing in microfluidic chamber; right column, Δbrk1 filament undergoing comparatively rapid growth. Black arrows indicate initial position of the apical cells throughout the series. Scale bar, 10 µm. See Supplemental Movie S11. C, Quantification of growth rates. Error bars are se.
Occasionally, but in multiple chambers, we observed to our knowledge a previously undescribed growth phenotype associated with Δbrk1 mutants. A single filament spontaneously underwent comparatively rapid growth (2.10 ± 0.25 µm/h, n = 4). This doubling in growth rate was coupled to a change in apical cell morphology. This morphology and form of growth was reminiscent of blebbing seen in some mutant pollen tubes (Gui et al., 2014). As the apical cell reached a mature size, the very tip ballooned out to form the next cell (Fig. 8B; Supplemental Movie S11). The branches that formed from blebs tended to abandon blebbing and grew as typical Δbrk1 chloronemata (Fig. 8B; Supplemental Movie S11). Whether this type of growth occurs on solid or liquid media is unknown, but monitoring growing Δbrk1 plants in microfluidic chambers allowed us to observe and study this phenomenon in detail.
DISCUSSION
Here, we show that a microfluidic chamber is a powerful tool to study development in P. patens. By growing P. patens over the course of weeks in a two-dimensional space, we have gained the ability to image a continuous spectrum of developmental events at cellular and subcellular resolution. Importantly, we show that P. patens regenerates and grows well in chambers that are simply immersed in growth medium. We find that both protonemal cell types grow at rates reported previously. We also imaged rhizoids, another tip-growing cell type, and report their growth rate. We find that rhizoids emerge very early from the developing gametophore, even before obvious phyllid expansion.
By imaging protonemata confined to two dimensions within microfluidic devices, we achieved an unprecedented view of protonemal development. Reports of the differences between the two protonemal cell types, chloronemata and caulonemata, have focused on the morphology of apical cells. However, apical cells represent a transitional cell type. For example, apical caulonemal cells tend to have few chloroplasts, but as these cells matured and became subapical cells in the protonemal filament over several days, we observed an increase in chloroplast density. Additionally, some cells with few chloroplasts had transverse cell plates, both of which are characteristics of caulonemal and chloronemal cells, respectively. Using microfluidic chambers, it is now possible to observe cellular processes that might differ between mature chloronemal and caulonemal cells at high resolution. We have also demonstrated that microfluidic chambers are an excellent method to characterize development and growth in mutants. Plants lacking the actin regulator BRICK1 have a striking protonemal phenotype. However, since Δbrk1 cells are small and clustered when grown on solid surfaces (Fig. 8A), it was difficult to quantify growth rates in older plants. When Δbrk1 plants were grown in chambers, we were able to accurately measure their growth rate over the course of days. Interestingly, we also observed that Δbrk1 plants occasionally undergo brief periods of accelerated growth. While the mechanism of this change in growth pattern remains to be elucidated, microfluidic devices provide an opportunity to pursue the molecular basis of this shift as well as that of moss development in general.
Pharmacological perturbations to growth are a classic means of elucidating molecular mechanisms underlying both cellular and organismal development. We demonstrate that these microfluidic growth chambers are also amenable to drug flow-through assays. This is an ability that we have demonstrated with an actin-depolymerizing drug, LatB, but it is extendable to many other agents. This introduces the opportunity for high-throughput pharmacological studies with the focus on cellular and subcellular consequences.
Two-dimensional confinement also facilitated imaging of gametophore bud initiation and phyllid expansion over weeks, opening the possibility of studying gametophore development with high temporal and spatial resolution. Studying subcellular events during the transition from two-dimensional to three-dimensional growth will no doubt provide insight into the underlying mechanisms that govern this transition. Microfluidic chambers provide the opportunity to image the same specimen over developmental time periods, which will promote the discovery of new phenotypes and the elucidation of previously reported phenomena. Furthermore, by specifying microfluidic chamber geometry, it is possible to introduce barriers and obstacles around which proliferating tissue must navigate, thereby establishing a platform for understanding how plants respond to their physical environment at the cellular and subcellular level.
MATERIALS AND METHODS
Microfluidic Chamber Design and Fabrication
Microfluidic growth chambers were prepared using now-standard photolithography and soft lithography methods (Duffy et al., 1998; McDonald et al., 2000). Chamber designs were prepared in AutoCAD (available at http://oakeylab.com/resources/) and developed as photolithographic shadow masks (CAD/Art Services). Chambers were prepared with radially symmetric hydraulic resistance so that the fluid velocity would be uniform in all directions under flow conditions. Negative photolithography was used to produce a raised pattern of planar rectangular channel devices with a height of 30 µm upon a silicon wafer. A second layer of photoresist was spun and developed to create a raised, 2-mm-diameter, 45-µm-deep reservoir to facilitate seeding at the center of the chamber. PDMS was poured over the wafer and allowed to cure in an oven at 21.1°C for 4 h. Individual devices were cut from the PDMS replica, and a sharpened 15-gauge blunt syringe tip was used to create a large port for tissue loading and fluid introduction at the center of the chamber. A sharpened 20-gauge syringe tip was used to create one outlet for fluid to exit the chamber. PDMS chambers were bonded to the bottom glass surfaces of either 12-well glass bottom plates or 35-mm glass bottom dishes (Cellvis, In Vitro Scientific), following exposure of both to an oxygen plasma (Harrick PDC-001; Harrick Plasma) under an oxygen pressure of 500 mTorr and medium RF power for 2 min. After exposure, the PDMS was quickly placed in conformal contact with the glass to produce a covalently bonded finished device.
Loading Tissue into Chambers
Prior to loading, the chambers were prepped by either soaking in Hoagland medium overnight or by flowing through Hoagland medium. Saturating chambers with medium prevented the formation of bubbles and channel drying by fluid permeation into the PDMS matrix (Randall and Doyle, 2005). Seven-day-old protonemal tissue was collected from a petri dish (described most recently in Wu and Bezanilla [2014]) and suspended in 1 mL of Hoagland medium. This suspension was gently pipetted up and down to break up the tissue. One hundred microliters of Physcomitrella patens tissue was then pipetted into the central port of the device, which was centered within the 45 µm loading region (Supplemental Fig. S1A). Once loaded, a tube was inserted into the same hole, and standard Hoagland media was pumped through via a 1-mL syringe (Supplemental Fig. S1B). By pulsing the syringe plunger, we disrupted the tissue enough and forced it into the 30 µm space between the PDMS and the glass coverslip. For pharmacological inhibitory studies, Hoagland medium containing LatB was injected into the chamber through the outlet hole with a 1-mL syringe (Supplemental Fig. S1C).
Protoplast Regeneration in PDMS Chamber
Prior to loading, the chambers were soaked in protoplast regeneration medium for a few hours. Freshly made protoplasts suspended in the same medium were loaded into the central hole, and then more media was pumped into the central hole to distribute the protoplasts further into the chamber. Because protoplasts easily rupture, it is critical to very slowly flow in the medium. The dishes were then filled with protoplast regeneration medium and cultured for several days under the same conditions as described for protonemal tissue. Afterward, the medium in the chamber and in the dish was replaced with Hoagland medium. Again, the new medium was flowed in slowly in order to minimize damage to the regenerating plants. The dishes were then cultured for a few more days under the same condition described above or immediately imaged on a wide-field microscope.
Chamber Maintenance
For optimal growth, Hoagland medium was refreshed once every 3 d. Microfluidic devices were placed under two 48-inch T12 40-W lights at a distance of 6 cm with constant illumination. The entire device was submerged in liquid medium.
Imaging
For long-term wide-field imaging, images were acquired with a Nikon TIU or TIE body with an automated stage. Imaging was performed with 10× and 20× objectives, and images were acquired with a Nikon DS-Qi2 or Ds-Fi1 camera. Samples were continuously illuminated with an external 60-W fluorescent bulb positioned above the microscope stage.
Confocal images were taken with a Nikon A1R confocal microscope, using a 1.4-NA 60× oil immersion objective (Nikon) at ambient room temperature. For GFP/YFP lines, 488-nm laser illumination was used, and light was captured after passing a 525/50-nm filter. For mCherry/mRuby2 lines, a 561-nm laser was used, with a 595/50 emission filter.
Generating Constructs and Stable Lines
The peroxisome- and Golgi-labeled lines were described by Furt et al. (2012). For mitochondrial and nuclear imaging, we used a dual-labeled line. The mitochondrial marker was generated by cloning the first 228 bp of the mitochondrial domain of unknown function (Pp_mDUF) gene Pp3c18_16000 (Goodstein et al., 2012). This region was predicted to contain the mitochondrial targeting presequence. Primers containing attB sites were used to amplify the first 228 bp (forward primer: GGGGACAAGTTTGTACAAAAAAGCAGGCTTAATGGAATCTCGCACAGCAAA; reverse primer: GGGGACAACTTTTGTATACAAAGTTGTGCTGTTTCTCACCAAGTTCGG). The amplicon was cloned into pDONR-P1P5r using a BP clonase (Invitrogen, Carlsbad, CA) reaction, according to the manufacturer’s instructions. To generate a fusion between the predicted mitochondrial presequence and mCherry, we performed an LR reaction (Invitrogen) into a destination vector that drives the expression of the fusion protein using the maize ubiquitin promoter and conferring kanamycin resistance to transformed plants (pTKUBI-Gate; Wu and Bezanilla, 2014). The nuclear-localized GFP marker was generated by amplifying the NLS-GFP-GUS coding sequence from the 35S-driven plasmid described by Bezanilla et al. (2003) and gateway cloning into a plasmid similar to pTKUBI-Gate, but conferring zeocin resistance (pTZUBI-Gate; Wu and Bezanilla, 2014). A similar strategy as employed by Vidali et al. (2009) was used to generate a LifeAct-mRuby2 fusion protein. With an LR clonase reaction, LifeAct-mRuby2 was cloned into a destination vector driving expression of the fusion protein via the maize ubiquitin promoter and conferring zeocin resistance to transformed plants (pTZUBI-Gate). Once we obtained a stable line containing pTKUBI mDUF-mCherry, that line was transformed with pTZUBI NLS-GFP-GUS to generate a dual-labeled line. Transformation of all constructs and selection of stable lines was done with linearized plasmid via polyethylene glycol-mediated DNA uptake as described in Vidali et al. (2007).
Accession Numbers
Sequence data from this article can be found in the GenBank/EMBL data libraries under accession number XM_001752084.1 (Pp_mDUF).
Supplemental Data
The following supplemental materials are available.
Supplemental Figure S1. PDMS devices used in the study.
Supplemental Movie S1. Tip-growing tissue growing in a PDMS microfluidic chamber.
Supplemental Movie S2. Tip cells emerged from a plant regenerated from a protoplast.
Supplemental Movie S3. A wild-type caulonemal subapical cell transformed into a chloroplast-rich cell.
Supplemental Movie S4. Development of a bud initial and rhizoids.
Supplemental Movie S5. Early stages of phyllid initiation.
Supplemental Movie S6. Phyllid expansion observed in a young gametophore.
Supplemental Movie S7. A mature gametophore with several expanding phyllids.
Supplemental Movie S8. A cell division event observed in a rhizoid emerging from the base of a gametophore.
Supplemental Movie S9. Actin filament disassembly by 25 µm and 50 µm LatB.
Supplemental Movie S10. Tip growth in caulonema and rhizoid cells were inhibited by 50 µm LatB.
Supplemental Movie S11. Protonemal tissue from the ∆brk1 mutant grows in PDMS microfluidic devices.
Supplementary Material
Acknowledgments
The authors are grateful to Nikon Instruments for microscopy support and the Marine Biological Laboratory for fostering a collaborative work environment that spearheaded this project.
Glossary
- PDMS
polydimethylsiloxane
- LatB
Latrunculin B
Footnotes
This work was supported by grants to M.B. from the National Science Foundation (grant no. MCB-1330171) and the David and Lucille Packard Foundation, and by the Laura and Arthur Colwin Endowed Summer Research Fellowship and the Burr and Susie Steinbach Fellowship Funds from the Marine Biological Laboratory. C.S.B. received support from the Plant Biology Graduate Program at the University of Massachusetts. Additional support to J.O. came from the National Institutes of Health (grant no. R15 GM101636) and by the Laura and Arthur Colwin Endowed Summer Research Fellowship Fund from the Marine Biological Laboratory in Woods Hole, MA. K.N. gratefully acknowledges support from a National Institutes of Health-funded Wyoming IDeA Networks of Biomedical Research Excellence program undergraduate research fellowship (P20GM103432).
Articles can be viewed without a subscription.
References
- Bezanilla M, Pan A, Quatrano RS (2003) RNA interference in the moss Physcomitrella patens. Plant Physiol 133: 470–474 [DOI] [PMC free article] [PubMed] [Google Scholar]
- Burke TA, Christensen JR, Barone E, Suarez C, Sirotkin V, Kovar DR (2014) Homeostatic actin cytoskeleton networks are regulated by assembly factor competition for monomers. Curr Biol 24: 579–585 [DOI] [PMC free article] [PubMed] [Google Scholar]
- Clark RT, MacCurdy RB, Jung JK, Shaff JE, McCouch SR, Aneshansley DJ, Kochian LV (2011) Three-dimensional root phenotyping with a novel imaging and software platform. Plant Physiol 156: 455–465 [DOI] [PMC free article] [PubMed] [Google Scholar]
- Dendukuri D, Panda P, Haghgooie R, Kim JM, Hatton TA, Doyle PS (2008) Modeling of oxygen-inhibited free radical photopolymerization in a PDMS microfluidic device. Macromolecules 41: 8547–8556 [Google Scholar]
- Duffy DC, McDonald JC, Schueller OJ, Whitesides GM (1998) Rapid prototyping of microfluidic systems in poly(dimethylsiloxane). Anal Chem 70: 4974–4984 [DOI] [PubMed] [Google Scholar]
- Furt F, Lemoi K, Tüzel E, Vidali L (2012) Quantitative analysis of organelle distribution and dynamics in Physcomitrella patens protonemal cells. BMC Plant Biol 12: 70. [DOI] [PMC free article] [PubMed] [Google Scholar]
- Goodstein DM, Shu S, Howson R, Neupane R, Hayes RD, Fazo J, Mitros T, Dirks W, Hellsten U, Putnam N, et al. (2012) Phytozome: a comparative platform for green plant genomics. Nucleic Acids Res 40: D1178–D1186 [DOI] [PMC free article] [PubMed] [Google Scholar]
- Gooh K, Ueda M, Aruga K, Park J, Arata H, Higashiyama T, Kurihara D (2015) Live-cell imaging and optical manipulation of Arabidopsis early embryogenesis. Dev Cell 34: 242–251 [DOI] [PubMed] [Google Scholar]
- Grossmann G, Guo WJ, Ehrhardt DW, Frommer WB, Sit RV, Quake SR, Meier M (2011) The RootChip: an integrated microfluidic chip for plant science. Plant Cell 23: 4234–4240 [DOI] [PMC free article] [PubMed] [Google Scholar]
- Gui C-P, Dong X, Liu HK, Huang WJ, Zhang D, Wang SJ, Barberini ML, Gao XY, Muschietti J, McCormick S, et al. (2014) Overexpression of the tomato pollen receptor kinase LePRK1 rewires pollen tube growth to a blebbing mode. Plant Cell 26: 3538–3555 [DOI] [PMC free article] [PubMed] [Google Scholar]
- Harrison CJ, Roeder AH, Meyerowitz EM, Langdale JA (2009) Local cues and asymmetric cell divisions underpin body plan transitions in the moss Physcomitrella patens. Curr Biol 19: 461–471 [DOI] [PubMed] [Google Scholar]
- Jiang H, Xu Z, Aluru MR, Dong L (2014) Plant chip for high-throughput phenotyping of Arabidopsis. Lab Chip 14: 1281–1293 [DOI] [PubMed] [Google Scholar]
- McDonald JC, Duffy DC, Anderson JR, Chiu DT, Wu H, Schueller OJ, Whitesides GM (2000) Fabrication of microfluidic systems in poly(dimethylsiloxane). Electrophoresis 21: 27–40 [DOI] [PubMed] [Google Scholar]
- Meier M, Lucchetta EM, Ismagilov RF (2010) Chemical stimulation of the Arabidopsis thaliana root using multi-laminar flow on a microfluidic chip. Lab Chip 10: 2147–2153 [DOI] [PMC free article] [PubMed] [Google Scholar]
- Menand B, Calder G, Dolan L (2007) Both chloronemal and caulonemal cells expand by tip growth in the moss Physcomitrella patens. J Exp Bot 58: 1843–1849 [DOI] [PubMed] [Google Scholar]
- Merkel TC, Bondar VI, Nagai K, Freeman BD, Pinnau I (2000) Gas sorption, diffusion, and permeation in poly(dimethylsiloxane). J Polym Sci Part B Polym Phys 38: 415–434 [Google Scholar]
- Perroud PF, Quatrano RS (2008) BRICK1 is required for apical cell growth in filaments of the moss Physcomitrella patens but not for gametophore morphology. Plant Cell 20: 411–422 [DOI] [PMC free article] [PubMed] [Google Scholar]
- Pressel S, Ligrone R, Duckett JG (2008) Cellular differentiation in moss protonemata: a morphological and experimental study. Ann Bot (Lond) 102: 227–245 [DOI] [PMC free article] [PubMed] [Google Scholar]
- Prigge MJ, Bezanilla M (2010) Evolutionary crossroads in developmental biology: Physcomitrella patens. Development 137: 3535–3543 [DOI] [PubMed] [Google Scholar]
- Randall GC, Doyle PS (2005) Permeation-driven flow in poly(dimethylsiloxane) microfluidic devices. Proc Natl Acad Sci USA 102: 10813–10818 [DOI] [PMC free article] [PubMed] [Google Scholar]
- Reski R. (1998) Development, genetics and molecular biology of mosses. Bot Acta 111: 1–15 [Google Scholar]
- Rounds CM, Bezanilla M (2013) Growth mechanisms in tip-growing plant cells. Annu Rev Plant Biol 64: 243–265 [DOI] [PubMed] [Google Scholar]
- Schween G, Hohe A, Koprivova A, Reski R (2003) Effects of nutrients, cell density and culture techniques on protoplast regeneration and early protonema development in a moss, Physcomitrella patens. J Plant Physiol 160: 209–212 [DOI] [PubMed] [Google Scholar]
- Suarez C, Carroll RT, Burke TA, Christensen JR, Bestul AJ, Sees JA, James ML, Sirotkin V, Kovar DR (2015) Profilin regulates F-actin network homeostasis by favoring formin over Arp2/3 complex. Dev Cell 32: 43–53 [DOI] [PMC free article] [PubMed] [Google Scholar]
- Tan JL, Tien J, Pirone DM, Gray DS, Bhadriraju K, Chen CS (2003) Cells lying on a bed of microneedles: an approach to isolate mechanical force. Proc Natl Acad Sci USA 100: 1484–1489 [DOI] [PMC free article] [PubMed] [Google Scholar]
- Vidali L, Rounds CM, Hepler PK, Bezanilla M (2009) Lifeact-mEGFP reveals a dynamic apical F-actin network in tip growing plant cells. PLoS One 4: e5744. [DOI] [PMC free article] [PubMed] [Google Scholar]
- Vidali L, Augustine RC, Kleinman KP, Bezanilla M (2007) Profilin is essential for tip growth in the moss Physcomitrella patens. Plant Cell 19: 3705–3722 [DOI] [PMC free article] [PubMed] [Google Scholar]
- Wu S-Z, Bezanilla M (2014) Myosin VIII associates with microtubule ends and together with actin plays a role in guiding plant cell division. eLife 3: 3895. [DOI] [PMC free article] [PubMed] [Google Scholar]
Associated Data
This section collects any data citations, data availability statements, or supplementary materials included in this article.


