Abstract
Multidetector row computed tomography (MDCT) is increasingly taking a central role in identifying subphenotypes within chronic obstructive pulmonary disease (COPD), asthma, and other lung-related disease populations, allowing for the quantification of the amount and distribution of altered parenchyma along with the characterization of airway and vascular anatomy. The embedding of quantitative CT (QCT) into a multicenter trial with a variety of scanner makes and models along with the variety of pressures within a clinical radiology setting has proven challenging, especially in the context of a longitudinal study. SPIROMICS (Subpopulations and Intermediate Outcome Measures in COPD Study), sponsored by the National Institutes of Health, has established a QCT lung assessment system (QCT-LAS), which includes scanner-specific imaging protocols for lung assessment at total lung capacity and residual volume. Also included are monthly scanning of a standardized test object and web-based tools for subject registration, protocol assignment, and data transmission coupled with automated image interrogation to assure protocol adherence. The SPIROMICS QCT-LAS has been adopted and contributed to by a growing number of other multicenter studies in which imaging is embedded. The key components of the SPIROMICS QCT-LAS along with evidence of implementation success are described herein. While imaging technologies continue to evolve, the required components of a QCT-LAS provide the framework for future studies, and the QCT results emanating from SPIROMICS and the growing number of other studies using the SPIROMICS QCT-LAS will provide a shared resource of image-derived pulmonary metrics.
Keywords: lung imaging, chronic obstructive pulmonary disease, asthma, pulmonary parenchyma, pulmonary airways
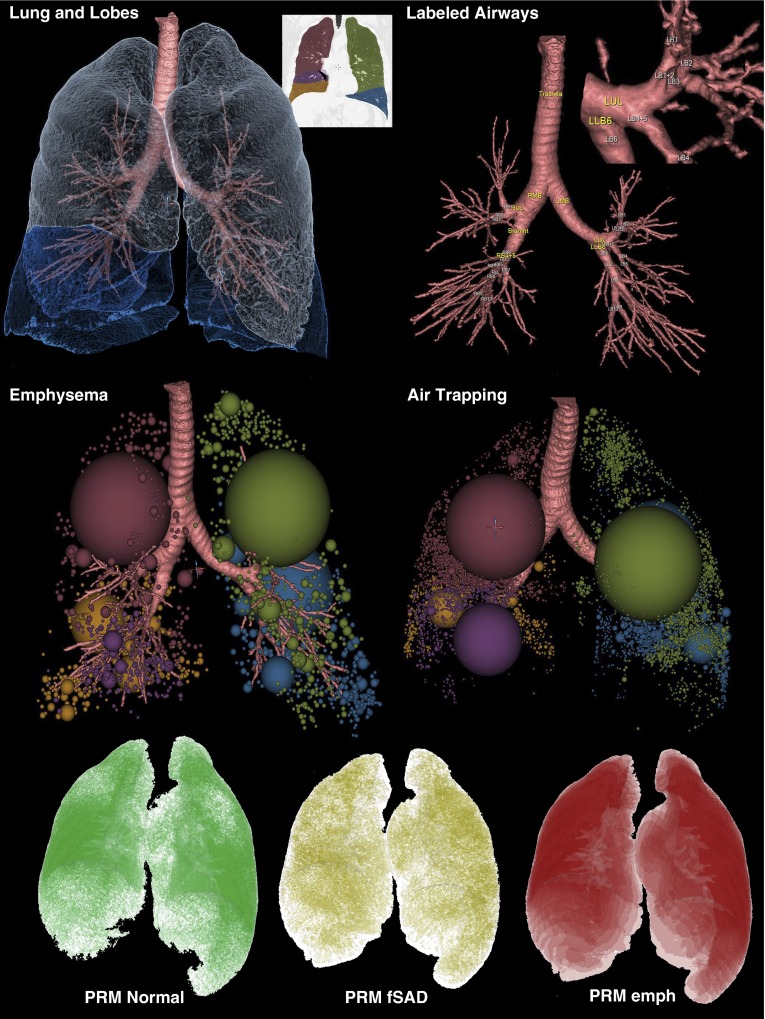
Quantitative computed tomography (QCT) of the lung has been used to assess, as demonstrated in Figure 1, the presence and extent of emphysema, air trapping, and airway structural characteristics in patients with chronic obstructive pulmonary disease (COPD) and other lung diseases, including asthma (1–5), and there is an emerging interest in vascular quantification (6–8). There are several large multicenter studies of both COPD and asthma that include QCT to evaluate changes in the lung, including the Multi-Ethnic Study in Atherosclerosis (MESA) Lung Study (9), the Evaluation of COPD Longitudinally to Identify Surrogate Endpoints (ECLIPSE) study (10), the Genetic Epidemiology of COPD study (COPDGene) (11), the Canadian Cohort of Obstructive Lung Disease (CanCOLD) study (12), and the Severe Asthma Research Program (SARP) (13).
Figure 1.
Components of a quantitative computed tomography evaluation. Emphysema is determined as voxels falling below −950 Hounsfield units (HU) on a total lung capacity (TLC) image data set, and air trapping is determined as voxels falling below −856 HU on a residual volume (RV) image. Upper left panel shows the components of the lung and airway segmentation, including the identification of individual lobes, and the upper right inset to the upper left panel shows the lobar color coding. These colors are used also in the middle row panels depicting low-attenuation clusters defining emphysema and air trapping–like lung regions. The upper right panel demonstrates the airway segmentation and the blow-up demonstrates the airway segment labeling. Five standardized paths of the airway tree are evaluated passing through RB1, RB4, RB10, LB1, and LB10. In the lower panel is demonstrated the output from what has been termed a parametric response map (PRM) (43, 44). After image matching of TLC and RV images, voxels that are emphysema on TLC are eliminated from the voxel count of air-trapped regions, thus leaving a modified map of which voxels are normal, air trapped (dubbed “functional small airways disease” [fSAD]), and emphysema-like (emph), again on the basis of a −950 and −856 HU threshold.
The Sub-Populations and Intermediate Outcome Measures in COPD Study (SPIROMICS) was established to collect and analyze CT image, pulmonary function, biomarker, genomic, proteomic, and clinical data from smokers with and without COPD to identify subpopulations and intermediate outcome measures in patients with COPD (14). SPIROMICS incorporates QCT data to assess parenchymal, airway, and vascular-based metrics. Participants are seen at 12 university-based clinical centers from across the United States.
QCT of the lung depends on accurate, precise, and repeatable CT images with attenuation measurements of the lung expressed in Hounsfield units (HU) (15, 16). Quantitative measures of emphysema are obtained at total lung capacity (TLC) as the percentage of voxels less than −950 HU, and quantitative measures of air trapping are extracted from images obtained at residual lung volume (RV) as the percentage of voxels less than −856 HU. In other studies, air trapping has been assessed at FRC (17, 18). However, to meet pulmonary function test standards for the definition of air trapping, RV was selected for assessment of air trapping. Airway geometry is also assessed for metrics including luminal area, wall area and percentage wall area, segment lengths, branch angles, airway branch patterns, and more. The accuracy of the measurements is based on computer algorithms dependent on the accuracy of the CT Hounsfield unit measurements as well as the spatial resolution associated with both the scanner itself and the image reconstruction methods. To assure accurate measurements across study sites, there are critical factors a scanning protocol must consider, including radiation exposure, spatial and temporal resolution, reconstruction kernel, subject positioning within the CT scanner bore, breath-holding techniques, and the monitoring of the CT scanner calibrations.
For the reasons outlined here, the SPIROMICS Radiology Committee developed and implemented a QCT lung assessment system (QCT-LAS) that includes a standardized imaging protocol and a data collection methodology. Imaging was performed at baseline and at the 1-year follow-up visit. This perspective describes the steps taken to establish a CT imaging protocol that reduces radiation dose while assuring sensitive and accurate quantification of parenchymal density as well as airway and vascular geometry; providing similar image quality across CT scanner makes, models, and site; and monitoring the data collection process. This study represents the state of the art for a snapshot of time. As scanner technologies evolve to provide higher-quality image data at further reductions in radiation doses (19–21), the protocol provided will most certainly evolve, but the images generated from the protocol outlined here set a baseline quality standard.
Implementation of Lung Imaging Standards in SPIROMICS: A Multicenter CT Protocol
Radiation Dose
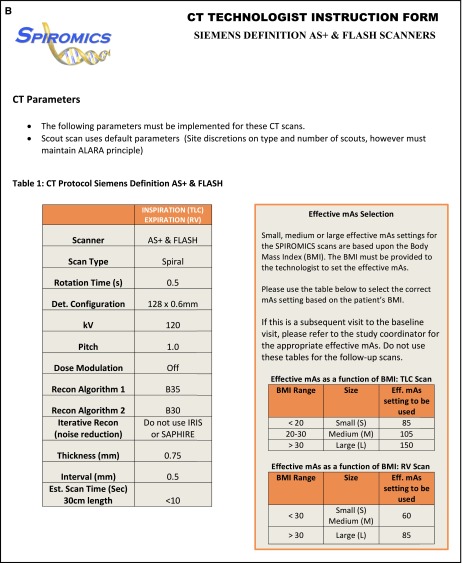
Scanners of different makes and models deliver differing photon counts to the subjects for a given milliamperage × seconds (mAs) because of factors including differences in beam filtration, variances in tube potential, and rotation times. Thus, a fixed milliamperage yields different exposures, leading to noise differences and inconsistencies in Hounsfield unit measurements across scanners. The SPIROMICS imaging protocol uses a CT dose index for the scanned volume (CTDIvol) to standardize exposure across scanners, recognizing that the scanner-reported CTDIvols are an average across a given make and model and not exact values for the particular scanner. To meet a target CTDIvol, milliamperage is varied across scanners, whereas the peak kilovoltage can be fixed. For the scanners available at the time of SPIROMICS recruitment, implementations of these guidelines are shown in Tables 1 and 2. Subject size was assessed via use of the body mass index (BMI) (14). In SPIROMICS, three BMI ranges were selected for the establishment of radiation doses. If the subject changed BMI on visit 2 by more than 3 units on either side of the BMI range for a given exposure, the milliamperage was shifted to the more appropriate dose level. Radiation dose was further minimized by scanning no more than 2 cm cephalad of the lung apex or 5 cm caudal of the lung base. Adherence was monitored at the SPIROMICS Radiology Center (University of Iowa), with deviation reports sent when limits were exceeded. With recent advances in dose modulation, whereby milliamperage is continuously adjusted for regional body structure, noise settings can be established and automatically maintained with appropriate standardization.
Table 1.
Computed Tomography Radiation Standardization
| Scan Type | Body Habitus | BMI Range | CTDIvol (mGy) |
|---|---|---|---|
| Inspiration | Obese | >30 | 11.4 |
| Inspiration | Normal | 20–30 | 7.6 |
| Inspiration | Below normal | <20 | 6.1 |
| Expiration | Obese | >30 | 6.1 |
| Expiration | Normal | <30 | 4.2 |
| Expiration | Below normal | <30 | 4.2 |
Definition of abbreviations: BMI = body mass index; CT = computed tomography; CTDIvol = volumetric computed tomography dose index.
CT dose is standardized so each manufacturer and model is matched within ±3% of the target CTDIvol. Adjustments to delivered dose were made on the basis of BMI ranges. Expiration radiation exposure uses the same CTDIvol for both normal and below-normal body sizes.
Table 2.
Scanner-Specific Protocol Settings
| Scanner Make | Siemens | Siemens | Siemens | GE | GE | Philips |
|---|---|---|---|---|---|---|
| Scanner model | Definition (AS Plus) 128 slice | Definition (DS) 64 slice | Sensation 64 slice | VCT 64 slice/Discovery STE | Discovery CT 750HD 64 slice | Brilliance 64 slice |
| Scan type | Spiral | Spiral single source | Spiral | Helical | Helical - standard | Spiral helix |
| Scan FOV | No selection | No selection | No selection | Large | Large | No selection |
| Rotation time, s | 0.5 | 0.5 | 0.5 | 0.5 | 0.5 | 0.5 |
| Detector configuration | 128 × 0.6 | 64 × 0.6 | 64 × 0.6 | 64 × 0.625 | 64 × 0.625 | 64 × 0.625 |
| Pitch | 1.0 | 1.0 | 1.0 | 0.984 | 0.984 | 0.923 |
| kVp | 120 | 120 | 120 | 120 | 120 | 120 |
| Inspiration (TLC) | Effective mAs | Effective mAs | Effective mAs | mA | mA | mAs |
| Small | 90 | 85 | 80 | 145 | 145 | 105 |
| Medium | 110 | 105 | 100 | 180 | 180 | 130 |
| Large | 165 | 150 | 145 | 270 | 270 | 190 |
| Expiration (RV) | Effective mAs | Effective mAs | Effective mAs | mA | mA | mAs |
| Extra small | 60 | |||||
| Small | 55 | 50 | 100 | 100 | 70 | |
| Medium/large | 90 | 85 | 80 | 145 | 145 | 105 |
| Dose modulation | Care dose off | Care dose off | Care dose off | Auto mA off | Auto mA off | Dose right (ACS) off |
| Standard algorithm | B35 | B35 | B35 | Standard | Standard | B |
| Lung algorithm | B30 | B31 | None | Detail | Detail | YB |
| Additional image filters | No selection | No selection | No selection | No selection | IQ enhance off | Adaptive filtering off |
| Thickness, mm | 0.75 | 0.75 | 0.75 | 0.625 | 0.625 | 0.67 |
| Interval, mm | 0.5 | 0.5 | 0.5 | 0.5 | 0.5 | 0.5 |
| Iterative reconstruction (noise reduction algorithm) | Do not use IRIS | Do not use IRIS | No selection | Do not use ASIR | Do not use ASIR | Do not use iDOSE |
| Scan time, 30-cm length, s | <10 | <10 | <10 | <10 | <10 | <10 |
| Reconstruction mode | N/A | N/A | N/A | Plus | Plus | N/A |
| Smart mA | N/A | N/A | N/A | Off | Off | N/A |
Definition of abbreviations: ACS = automatic current selection; ASIR = adaptive statistical iterative reconstruction; CT = computed tomography; FOV = field of view; IQ = intelligent quantitation; IRIS = iterative reconstruction in image space; kVp = peak kilovoltage; mAs = milliamperage seconds; N/A = not applicable; RV = residual volume; TLC = total lung capacity.
Standardizing on volumetric computed tomography dose index, protocols were developed for each scanner type within SPIROMICS (Subpopulations and Intermediate Outcome Measures in COPD Study) so as to maximize the similarity of image data across sites. At each of the two lung volumes, the CT protocol specifies the scanner model, scan mode, scan FOV, rotation time, detector configuration, pitch, kVp, mAs, dose modulation setting, reconstruction kernels, post-processing filter settings, slice thickness, slice interval, iterative reconstruction algorithm setting, scan time for 30-cm length, reconstruction mode, smart mA setting, and IQ enhance setting. Effective mAs represents the tube current–time product.
Spatial and Temporal Resolution
Cross-scanner spatial resolution equivalence was achieved by identifying detector collimation and slice parameters that provided similar submillimeter slice thicknesses. Slice collimation, using the maximum detector width (64 channels or higher), was set at ∼0.6 mm to keep scan speed high but still allow for thin slice reconstructions (Table 2). Scan times influence temporal resolution and are a function of detector width, which differs between scanners, X-ray tube detector array rotation time, and pitch. Near-equivalent scan times were achieved by setting rotation time to 0.5 s and pitch to 1.0 (Table 2).
Reconstruction Kernels
Reconstruction kernels have significant impact on QCT measures (15). Current QCT recommendations to assess lung density and airway geometry use a medium sharp reconstruction kernel. This led to the selection of the Philips B, GE Standard, and Siemens B35 kernels (see Figure E1A in the online supplement). High spatial frequency kernels, which have been popular for visual assessments of the lung, alter Hounsfield units at edges. This is problematic when seeking accurate measures of regional attenuation and consistent measures of airways (Figure E1B). However, recent sharp kernels provide distinct edges without exaggerated contrast differences (22, 23).
Steps to Assure Quality Control in a Multicenter Study
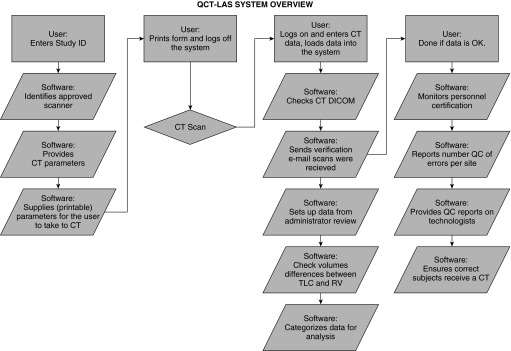
QCT-LAS eliminates the use of paper forms and was developed to satisfy the need for data collect in “real time,” essential in multicenter, longitudinal imaging trials. The QCT-LAS (Figure 2) reduces human intervention and allows web-based software automation of the workload. The steps outlined in Figure 2 are critical and are performed in a specific order to facilitate QCT-LAS database monitoring of both personnel and scanners.
Figure 2.
Flow diagram of quantitative computed tomography–lung assessment system (QCT-LAS) demonstrating important data checks completed through web-based interaction of web-based software, limiting the site user to 3 basic steps and allowing the software to automatically handle 10 or more steps. CT = computed tomography; DICOM = digital imaging and communication in medicine format; QC = quality control; RV = residual volume; TLC = total lung capacity.
Step 1: personnel training and certification
SPIROMICS established an integrated training method for coordinators and technologists using QCT-LAS. Training occurs before scanning onset and involves a Manual of Procedures review, PowerPoint review, imaging forms review, and a video demonstration of the CT acquisition and data entry procedures. Technologists and coordinators are certified and provided with a unique name and password for the QCT-LAS on passing module-associated quizzes. Privileges can be revoked by consensus of the Radiology Committee and Site Primary Investigator, with reinstatement requiring recertification.
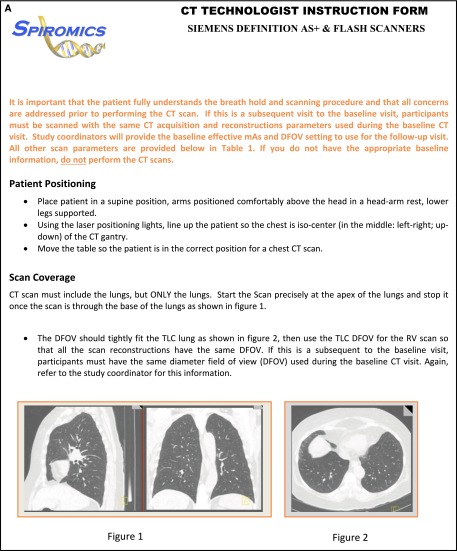
Written directions for the technologist (Appendix 1A and 1B) accompany the patient and include instructions to: (1) position the subject at the center of the CT scanner aperture by use of laser beams for left-to-right and ventral-to-dorsal centering, (2) scan only the z-axis length needed to include the apical to basal extent of the lungs, (3) select the display field of view (DFOV) limited to the most lateral extents of the lungs (providing maximal spatial resolution) at TLC and to keep the DFOV the same for TLC (inspiratory volume) and RV (expiratory volume). A consistent DFOV across lung volumes and longitudinally is important for comparison of airway and density metrics.
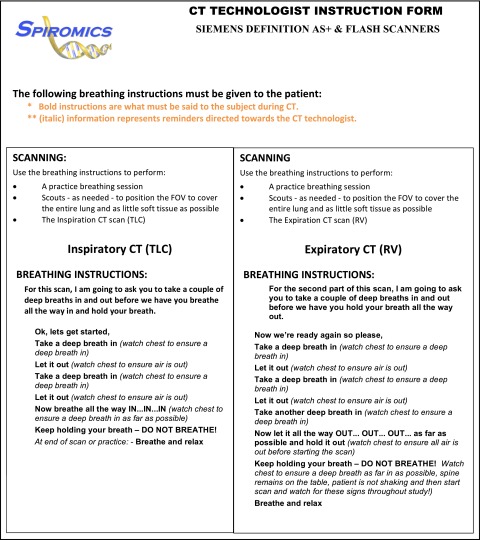
Breathing/breath-hold instructions (Appendix 2) are supplied within the CT technologist form, and technologists are instructed to coach the subject, as in a pulmonary function testing laboratory, to achieve both TLC and RV with a series of proceeding deep inspirations. Recorded instructions should not be used, as this takes the technologist’s attention off of the subject.
At the time of training, it is emphasized that positioning of the patient in the isocenter of the CT scanner aperture is critical, as discussed in the report from the American College of Radiology (ACR) CT accreditation program (24). Isocenter positioning serves to reduce cone-beam and scatter artifacts.
Step 2: CT scanner calibration status
SPIROMICS requires that each scanner pass an initial calibration check. Scanners must have 64 detector rows or higher to provide imaging speeds adequate for a breath-hold. Precertified scanner information must also be preloaded into the QCT-LAS before onset of subject imaging. Each CT manufacturer has their own scanner-specific test object (“phantom”) that assesses the calibration of several general scanner parameters, such as the value of water that should be 0 HU. The SPIROMICS CT protocol includes a specialized CT test object (referred to as the “COPDGene 1” test object) developed in the COPDGene study (25). Assurance of measurement stability of a given CT scanner is critical to any quantitative CT effort. If test object Hounsfield unit values shift by more than 3 HU in any material, the site is alerted and action is taken. Guidelines have been developed for the automated assessment of the appropriate positioning of the test object within the scanner to assure that object misalignment is not contributing to measured deviations (26).
Step 3: Scan acquisition and data entry
SPIROMICS developed Procedural Verification Software (PVS) to provide scanner information and track scan data in real time (Figure E2A). PVS provides an automated web portal system requiring a local computer and Internet connection. The main function of PVS is to provide a mechanism for subject registration before scanning and to provide the study coordinator with subject- and scanner-specific scan parameters from the QCT-LAS database using the subject’s BMI. In a longitudinal study, such as SPIROMICS, PVS assures that follow-up scans match the baseline scan in terms of scan protocol, including scanning on the same scanner. Details are provided in the online supplement.
Step 4: Image data transfer
Image transfer software is critical to ensure timely CT scan data transmission. The DICOM Selection Parser and Transfer Check (DISPATCH) software shown in Figure E3 provides an automated system that imports scan data at the clinical center and exports data to the Radiology Center via the Internet in a secure manner. At the same time, DISPATCH allows for the automated and customized interrogation of the image’s DICOM header for protocol evaluation. Details are provided in the online supplement.
Image Analysis
Image data generated through SPIROMICS are being analyzed via VIDA Diagnostics’ Apollo software (VIDA Diagnostics, Coralville, IA), and a data dictionary for both density-based and airway metrics is provided in Table E1. Researchers interested in using SPIROMICS should consult the “Obtaining SPIROMICS data” tab on the study web site at www.spiromics.com.
Evidence of Successful Standardization
Scan Protocol Standardization Results
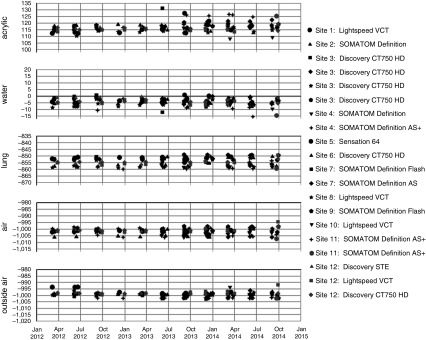
Scanners have remained within 4 HU from baseline for internal and 3 HU for external air measurements (Figure 3). Most scanners were stable (≤2 HU) for internal and external air, except for an apparent 4-HU shift in the external air for scanner COL02. This issue was detected by QCT-LAS, and the site was alerted via email shortly after it occurred. Using the test object data, a service call was initiated, which included scanner recalibration. Scanner repair was followed by an acceptable test object scan, and the scanner was placed back on the approved list. Another scanner, UCLA03, exhibited a 3-HU shift in internal air measures over a 3-month period, and the same steps were implemented; however, the issue was resolved without a service call.
Figure 3.
These figures summarize the parameters and frequency that the Genetic Epidemiology of COPD (COPDGene) test object was scanned to ensure computed tomography scanner calibration. Scanners have remained stable within 3 Hounsfield units from baseline. COPD = chronic obstructive pulmonary disease.
SPIROMICS Quality Control Results
Deployment of QCT-LAS in July 2011 resulted in a significant reduction in protocol errors, including radiation dose deviations. Using QCT-LAS in the first year we identified that 20% of the subjects scanned (n = 995 subjects) had protocol exceptions. Only 4.0% of these exceptions involved deviations related to radiation dose. This percentage dropped from 20 to 11% scanned (n = 1,275 subjects) the following year. Of this 11%, only ∼1% were related to deviations in radiation dose. The ∼50% decrease in protocol exceptions was attributed to the ability of QCT-LAS to locate the problem quickly and get the scans re-reconstructed with the correct parameters while the raw data were still available on the scanner. Use of the system has allowed site coordinators to become more familiar with imaging parameters, which in turn contributed to the 75% reduction in scan deviations the following year.
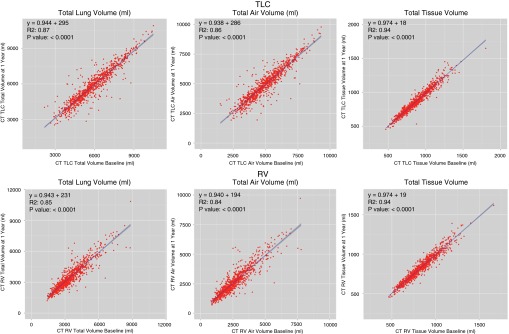
In Figure 4, the repeatability of total lung volumes, air volumes, and tissue volumes (nonair volume consisting of parenchymal blood plus tissue) at TLC (Figure 4, top row) and RV (Figure 4, bottom row) are demonstrated. Of 978 subjects in this early analysis, RV volume was larger than the respective TLC volume at either baseline or Year 1 in 26 subjects. Because these breath holds were clearly incorrect, these subjects were eliminated from the baseline–Year 1 comparison. These subjects clustered at a small number of sites. Technicians were identified and retrained. The remaining 952 subjects (1,904 scans) are represented in Figure 4. We visually reviewed all of the TLC and RV scans for which the air volumes at visit 2 varied by more than 20% of the visit 1 values. This amounted to 13% of the 1,904 scans. A trained analyst reviewed these “outliers” with visit 1 and visit 2 images displayed side by side, along with their overlaid lung segmentations. Results from these reviews are tabulated in Table 3. There were 80 outliers at TLC and 163 at RV, indicating that it was more difficult to attain and hold an RV versus a TLC lung volume. All Apollo-derived lung segmentations were found to be visually accurate for the TLC scans, and only two scans had previously undetected segmentation issues on RV requiring intervention. Figure 4 illustrates that despite the relatively small numbers of outliers at TLC or RV, the total lung, total air, and total tissue volume repeatability at visit 2 was strong. Because tissue volume should remain constant across lung inflation levels (except for small blood volume changes), one would expect tissue volume across visits and across lung volumes to remain tight, despite variability in breath hold repeatability. This is what the data demonstrate. The linear regressions for all comparisons displayed in Figure 4 demonstrated an R2 greater than 0.80 (P < 0.0001).
Figure 4.
Computed tomography (CT) volume comparisons Years 1 and 2. Comparison of total lung volume (left column), total air volume (middle column), and total tissue volume (right column) at both total lung capacity (TLC) (top row) and residual volume (RV) (bottom row) in the first 952 subjects with baseline and Year 1 image analysis data.
Table 3.
Visual Assessment of Residual Volume and Total Lung Capacity Visit 1 to 2 Volume Outliers
| Scan Type | No. of Subjects with >20% V2 ΔAir Volume | Motion or Metal Artifacts* | Large BMI Changes* | Cases with Comorbidities Such as Fibrosis, Paralyzed Diaphragm, Lung Surgeries, etc.* | Mismatched Subjects (V1 vs. V2)* |
|---|---|---|---|---|---|
| TLC | 80 | 18 | 1 | 3 | 1 |
| RV | 162 | 18 | 1 | 3 | 1 |
Definition of abbreviations: BMI = body mass index; RV = residual volume; TLC = total lung capacity; V1 = visit 1; V2 = visit 2.
Results of visual assessment of RV and TLC data sets found to have >20% V2 air volume difference relative to baseline V1 values.
Scans that were found to have visibly apparent differences beyond what would be expected from disease progression and beyond a simple mismatched breath hold (V2 vs. V1).
Total tissue volume at TLC dropped (visit 2 − visit 1) a mean of −5.32 ± 44 ml (P = 0.0002) (95% confidence interval, ±2.84 ml) suggesting an overall progression of emphysema detectable in a 1-year period. From the RV data, total air volume change (visit 2 − visit 1) demonstrated a mean increase of 35.2 ± 469 ml (P = 0.02) (95% confidence interval, ±30 ml), suggesting an overall increase in air trapping detectable in a 1-year period.
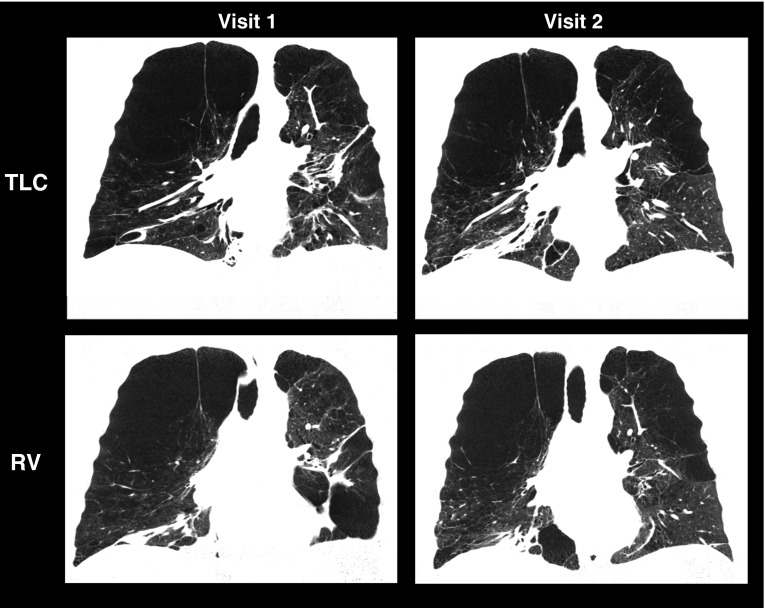
Further explorations of these data are warranted to differentiate between nonprogressors and rapid progressors. The wide range represents the ranges both of body habitus and lung sizes associated with COPD. Of note, there was one subject with a volume mismatch, but this subject also had extremely large total air volumes both at visit 1 and visit 2 (near 10 L; see lower panels of Figure 4). The midcoronal sections from visit 1 and visit 2 are depicted in Figure 5, demonstrating very large apical bullae contributing to the large lung volume but also a clearly different RV effort between visits 1 and 2, as seen in the lower panels. Note the lack of separation of the heart from the diaphragm in the lower left panel and the clear separation in the lower right.
Figure 5.
The midcoronal computed tomography sections from visits 1 and 2 of the subject associated with the outlying data points observed on the residual volume (RV) plots of total lung volume and total air volume in the lower left and middle panels of Figure 4 are shown here. The large bullae contributed to very large total air volumes both at total lung capacity (TLC) (visit 1 = 10.5 L; visit 2 = 10.9 L) as well as RV (visit 1 = 8.8 L; visit 2 = 10.8 L). The RV efforts between visit 1 and visit 2 are clearly different both quantitatively and as visually evaluated. Note the separation of the heart and diaphragm on visit 2 but not visit 1.
Discussion
The SPIROMICS CT protocol addresses the important issues in performing QCT of the lung for multicenter trials using CT scanners from multiple manufacturers and/or multiple models. In addition, using the SPIROMICS CT protocol, normative values for a large nonsmoking study population have been developed as part of the MESA Lung Study (27), thus yielding normative values appropriate for other studies using the SPIROMICS CT protocol.
A number of factors, long advocated for use in QCT of COPD and asthma (15), have been included in the SPIROMICS protocol. These include use of a test object for scanner calibration, minimizing radiation dose, maximizing spatial and temporal resolution through the use of MDCT scanners, scanning at coached TLC for the assessment of emphysema, scanning at a coached RV for the assessment of air trapping, and use of similar cross-manufacturer reconstruction kernels. Use of a specialized CT test object designed to evaluate the calibration of the CT scanner at the CT attenuation of normal lung tissue is important for assuring meaningful CT attenuation measurements. Currently, there are no Food and Drug Administration standards for Hounsfield unit precision in the air/lung tissue range. However, the ACR CT standards recommend air to be −1,000 ± 30 HU and water to be 0 ± 7 HU when using a certified ACR test phantom (24). Although these numbers suit most current clinical applications, they are not precise enough for the lung QCT described here. QCT of the lung requires tighter precision (≤3 HU) (28–30).
Minimizing radiation exposure in CT must always be a goal. Use of fixed CTDIvol dose is an improvement over recent trials that used a fixed milliamperage × seconds, delivering a radiation dose based on CTDIvols, adjusted for BMI, and achieving similar image quality across subject sizes. This method is similar to dose-modulation techniques, where the X-ray beam contours to the body to maintain a constant noise level and will adjust based on the attenuation of the anatomy (31, 32). At the time of establishing the SPIROMICS protocol, validation was absent for the use of scanner-specific dose-modulation techniques in QCT measures. More recently, updates to dose modulation have demonstrated good quantitative results and should be considered in the future.
When new CT advancements are developed, test objects provide a mechanism for ensuring longitudinal stability in the integrity of the QCT lung measurements (25). Relevant test object studies have shown that new CT technologies, such as iterative reconstruction, have the potential to further reduce radiation dose by 50 to 70% (33–35). Recent studies have shown similar results in the COPDGene test object using current iterative reconstruction algorithms and detector technology (21). Using emerging technologies, exposure for a QCT scan can be reduced to that of a posterior–anterior and lateral digital chest radiographic examination (20).
The selected reconstruction kernels (Siemens B35f and its equivalents, GE standard and Phillips B kernels) are in keeping with those used in the COPDGene study (25). However, newer high spatial resolution reconstruction kernels have been released that avoid artificially enhanced density differences at sharp edges while maintaining edge sharpness. These sharper kernels are under evaluation (22).
Written instructions regarding breath-hold techniques for the patient assure that CT scans are obtained at either TLC or RV after assuring a constant volume history via several deep inspirations. Accurate breath holds remove the largest source of lung density variability. Recent studies have attempted to correct for inadequate lung volumes, but there is no substitute for a correct breath-hold effort (36–40).
The complexities of a multicenter study with longitudinal time points are significantly more challenging than single-center studies with small patient numbers (41). Using a QCT-LAS, incorporating web-based components, provides less lag time, which is critical to provide QC feedback to a particular site and achieve the overall goals of the study. Timely study transmission to the Radiology Center and feedback to the clinical center ensure that sites can react to resolve issues quickly. Clinical scanners are able to store raw projection data for approximately 1 week. Therefore, it is essential to address QC issues (reconstruction kernel, DFOV, etc.) during this time frame. Approximately 80% of QCT data sets with QC errors requiring raw data for error correction have been successfully corrected due to prompt identification and notification of deviations using the QCT-LAS system in SPIROMICS.
While CT technology rapidly advances, manufacturers strive to maintain the ability to translate QCT measures from one scanner generation to the next. Deviations in air values associated with scatter artifacts are understood (42), and newer scanners have made corrections. Improved iterative reconstruction algorithms are emerging with radiation exposure levels now reaching that of a posterior–anterior and lateral digital chest radiographic study (20), increasing the utility of QCT in longitudinal studies. However, accuracy of longitudinal data critically depends on careful data acquisition at each time point, such as is provided for the SPIROMICS QCT-LAS.
Conclusions
In establishing the SPIROMICS imaging methodology, efforts were taken to establish a protocol that would resolve numerous issues identified in association with other multicenter studies. Having established the SPIROMICS protocol, it was adopted by the MESA Lung Study and the SARP and iteratively revised through investigator feedback. The SPIROMICS CT protocol is a well-optimized lung QCT protocol suitable for multicenter studies of COPD and asthma that involve scanning on scanners of various models from multiple manufacturers. The entire package of protocol development, phantom scanning, having a web-based tracking mechanism, and sending CT scan data via an Internet-based DICOM checking system is critical to large multicenter studies.
Supplementary Material
Acknowledgments
Acknowledgment
The authors thank the SPIROMICS participants and participating physicians, investigators, and staff for making this research possible. More information about the study and how to access SPIROMICS data is at www.spiromics.org. The authors also thank the following current and former investigators of the SPIROMICS sites and reading centers: Neil E. Alexis, Ph.D.; Wayne H. Anderson, Ph.D.; R. Graham Barr, M.D., Dr.P.H.; Eugene R. Bleecker, M.D.; Richard C. Boucher, M.D.; Russell P. Bowler, M.D., Ph.D.; Elizabeth E. Carretta, M.P.H.; Stephanie A. Christenson, M.D.; Alejandro P. Comellas, M.D.; Christopher B. Cooper, M.D., Ph.D.; David J. Couper, Ph.D.; Gerard J. Criner, M.D.; Ronald G. Crystal, M.D.; Jeffrey L. Curtis, M.D.; Claire M. Doerschuk, M.D.; Mark T. Dransfield, M.D.; Christine M. Freeman, Ph.D.; MeiLan K. Han, M.D., M.S.; Nadia N. Hansel, M.D., M.P.H.; Annette T. Hastie, Ph.D.; Eric A. Hoffman, Ph.D.; Robert J. Kaner, M.D.; Richard E. Kanner, M.D.; Eric C. Kleerup, M.D.; Jerry A. Krishnan, M.D., Ph.D.; Lisa M. LaVange, Ph.D.; Stephen C. Lazarus, M.D.; Fernando J. Martinez, M.D., M.S.; Deborah A. Meyers, Ph.D.; John D. Newell, Jr., M.D.; Elizabeth C. Oelsner, M.D., M.P.H.; Wanda K. O’Neal, Ph.D.; Robert Paine, III, M.D.; Nirupama Putcha, M.D., M.H.S.; Stephen I. Rennard, M.D.; Donald P. Tashkin, M.D.; Mary Beth Scholand, M.D.; J. Michael Wells, M.D.; Robert A. Wise, M.D.; and Prescott G. Woodruff, M.D., M.P.H.. The project officers from the Lung Division of the NHLBI were Lisa Postow, Ph.D., and Thomas Croxton, Ph.D., M.D.
Appendix 1
(A and B) Computed tomography (CT) technologist instruction forms. These forms provide information to ensure the technologists have all the proper information to complete the examinations within the guidelines of the study. The forms are made available through the Procedural Verification Software web system and may be downloaded and printed to take to the scanner room or used for study reference. ALARA = as low as reasonably achievable; DFOV = display field of view; mAs = milliamperage seconds; RV = residual volume; TLC = total lung capacity.
Appendix 2
Each computed tomography (CT) technologist form contains proper breathing instructions for a given site’s scanner at the time of scanning the subjects. The form is made available through the Procedural Verification Software web system and may be downloaded and printed to take to the scanner room or used for study reference. FOV = field of view; RV = residual volume; TLC = total lung capacity.
Footnotes
SPIROMICS was supported by the National Institutes of Health/NHLBI contracts HHSN268200900013C, HHSN268200900014C, HHSN268200900015C, HHSN268200900016C, HHSN268200900017C, HHSN268200900018C, HHSN268200900019C, and HHSN268200900020C, which were supplemented by contributions made through the Foundation for the National Institutes of Health from AstraZeneca; Bellerophon Therapeutics; Boehringer-Ingelheim Pharmaceuticals, Inc; Chiesi Farmaceutici SpA; Forest Research Institute, Inc; GSK; Grifols Therapeutics, Inc; Ikaria, Inc; Nycomed GmbH; Takeda Pharmaceutical Company; Novartis Pharmaceuticals Corporation; Regeneron Pharmaceuticals, Inc; and Sanofi.
Author Contributions: Conception and design: J.P.S., J.D.N., R.G.B., E.R.B., N.B., E.E.C., D.C., J. Goldin, J. Guo, M.K.H., N.N.H., R.E.K., E.A.K., F.J.M., S.R., P.G.W., and E.A.H. Analysis and interpretation: J.P.S., J.D.N., R.G.B., N.B., E.E.C., D.C., J. Guo, and E.A.H. Drafting the manuscript: J.P.S., J.D.N., R.G.B. M.K.H., and E.A.H. Intellectual content: J.P.S., J.D.N., R.G.B., E.R.B., N.B., E.E.C., D.C., J. Goldin, J. Guo, M.K.H., N.N.H., R.E.K., E.A.K., F.J.M., S.R., P.G.W., and E.A.H. Final approval: J.P.S., J.D.N., R.G.B., E.R.B., N.B., E.E.C., D.C., J. Goldin, J. Guo, M.K.H., N.N.H., R.E.K., E.A.K., F.J.M., S.R., P.G.W., and E.A.H.
This article has an online supplement, which is accessible from this issue’s table of contents at www.atsjournals.org
Originally Published in Press as DOI: 10.1164/rccm.201506-1208PP on August 2, 2016
Author disclosures are available with the text of this article at www.atsjournals.org.
References
- 1.Kim DK, Jacobson FL, Washko GR, Casaburi R, Make BJ, Crapo JD, Silverman EK, Hersh CP. Clinical and radiographic correlates of hypoxemia and oxygen therapy in the COPDGene study. Respir Med. 2011;105:1211–1221. doi: 10.1016/j.rmed.2011.02.015. [DOI] [PMC free article] [PubMed] [Google Scholar]
- 2.Castro M, Fain SB, Hoffman EA, Gierada DS, Erzurum SC, Wenzel S National Heart, Lung, and Blood Institute’s Severe Asthma Research Program. Lung imaging in asthmatic patients: the picture is clearer. J Allergy Clin Immunol. 2011;128:467–478. doi: 10.1016/j.jaci.2011.04.051. [DOI] [PMC free article] [PubMed] [Google Scholar]
- 3.Hoffman EA, Simon BA, McLennan G. State of the art. A structural and functional assessment of the lung via multidetector-row computed tomography: phenotyping chronic obstructive pulmonary disease. Proc Am Thorac Soc. 2006;3:519–532. doi: 10.1513/pats.200603-086MS. [DOI] [PMC free article] [PubMed] [Google Scholar]
- 4.Coxson HO, Leipsic J, Parraga G, Sin DD. Using pulmonary imaging to move chronic obstructive pulmonary disease beyond FEV1. Am J Respir Crit Care Med. 2014;190:135–144. doi: 10.1164/rccm.201402-0256PP. [DOI] [PubMed] [Google Scholar]
- 5.Lynch DA, Al-Qaisi MA. Quantitative computed tomography in chronic obstructive pulmonary disease. J Thorac Imaging. 2013;28:284–290. doi: 10.1097/RTI.0b013e318298733c. [DOI] [PMC free article] [PubMed] [Google Scholar]
- 6.Iyer KS, Newell JD, Jr, Jin D, Fuld MK, Saha PK, Hansdottir S, Hoffman EA. Quantitative dual-energy computed tomography supports a vascular etiology of smoking-induced inflammatory lung disease. Am J Respir Crit Care Med. 2016;193:652–661. doi: 10.1164/rccm.201506-1196OC. [DOI] [PMC free article] [PubMed] [Google Scholar]
- 7.Wells JM, Washko GR, Han MK, Abbas N, Nath H, Mamary AJ, Regan E, Bailey WC, Martinez FJ, Westfall E, et al. COPDGene Investigators; ECLIPSE Study Investigators. Pulmonary arterial enlargement and acute exacerbations of COPD. N Engl J Med. 2012;367:913–921. doi: 10.1056/NEJMoa1203830. [DOI] [PMC free article] [PubMed] [Google Scholar]
- 8.Hoffman EA, Lynch DA, Barr RG, van Beek EJ, Parraga G IWPFI Investigators. Pulmonary CT and MRI phenotypes that help explain chronic pulmonary obstruction disease pathophysiology and outcomes. J Magn Reson Imaging. 2016;43:544–557. doi: 10.1002/jmri.25010. [DOI] [PMC free article] [PubMed] [Google Scholar]
- 9.Barr RG, Ahmed FS, Carr JJ, Hoffman EA, Jiang R, Kawut SM, Watson K. Subclinical atherosclerosis, airflow obstruction and emphysema: the MESA Lung Study. Eur Respir J. 2012;39:846–854. doi: 10.1183/09031936.00165410. [DOI] [PMC free article] [PubMed] [Google Scholar]
- 10.Gietema HA, Müller NL, Fauerbach PV, Sharma S, Edwards LD, Camp PG, Coxson HO Evaluation of COPD Longitudinally to Identify Predictive Surrogate Endpoints (ECLIPSE) investigators. Quantifying the extent of emphysema: factors associated with radiologists’ estimations and quantitative indices of emphysema severity using the ECLIPSE cohort. Acad Radiol. 2011;18:661–671. doi: 10.1016/j.acra.2011.01.011. [DOI] [PubMed] [Google Scholar]
- 11.Regan EA, Hokanson JE, Murphy JR, Make B, Lynch DA, Beaty TH, Curran-Everett D, Silverman EK, Crapo JD. Genetic epidemiology of COPD (COPDGene) study design. COPD. 2010;7:32–43. doi: 10.3109/15412550903499522. [DOI] [PMC free article] [PubMed] [Google Scholar]
- 12.Bourbeau J, Tan WC, Benedetti A, Aaron SD, Chapman KR, Coxson HO, Cowie R, Fitzgerald M, Goldstein R, Hernandez P, et al. CanCOLD Study Group. Canadian Cohort Obstructive Lung Disease (CanCOLD): fulfilling the need for longitudinal observational studies in COPD. COPD. 2014;11:125–132. doi: 10.3109/15412555.2012.665520. [DOI] [PubMed] [Google Scholar]
- 13.Jarjour NN, Erzurum SC, Bleecker ER, Calhoun WJ, Castro M, Comhair SA, Chung KF, Curran-Everett D, Dweik RA, Fain SB, et al. NHLBI Severe Asthma Research Program (SARP) Severe asthma: lessons learned from the National Heart, Lung, and Blood Institute Severe Asthma Research Program. Am J Respir Crit Care Med. 2012;185:356–362. doi: 10.1164/rccm.201107-1317PP. [DOI] [PMC free article] [PubMed] [Google Scholar]
- 14.Couper D, LaVange LM, Han M, Barr RG, Bleecker E, Hoffman EA, Kanner R, Kleerup E, Martinez FJ, Woodruff PG, et al. SPIROMICS Research Group. Design of the subpopulations and intermediate outcomes in copd study (spiromics) Thorax. 2014;69:491–494. doi: 10.1136/thoraxjnl-2013-203897. [DOI] [PMC free article] [PubMed] [Google Scholar]
- 15.Newell JD, Jr, Hogg JC, Snider GL. Report of a workshop: quantitative computed tomography scanning in longitudinal studies of emphysema. Eur Respir J. 2004;23:769–775. doi: 10.1183/09031936.04.00026504. [DOI] [PubMed] [Google Scholar]
- 16.Hochhegger B, Irion KL, Marchiori E. Thresholds to lung density measures. Acad Radiol. 2010;17:399–. [Author reply, pp. 399–401]. doi: 10.1016/j.acra.2009.09.014. [DOI] [PubMed] [Google Scholar]
- 17.Busacker A, Newell JD, Jr, Keefe T, Hoffman EA, Granroth JC, Castro M, Fain S, Wenzel S. A multivariate analysis of risk factors for the air-trapping asthmatic phenotype as measured by quantitative CT analysis. Chest. 2009;135:48–56. doi: 10.1378/chest.08-0049. [DOI] [PMC free article] [PubMed] [Google Scholar]
- 18.Schroeder JD, McKenzie AS, Zach JA, Wilson CG, Curran-Everett D, Stinson DS, Newell JD, Jr, Lynch DA. Relationships between airflow obstruction and quantitative CT measurements of emphysema, air trapping, and airways in subjects with and without chronic obstructive pulmonary disease. AJR Am J Roentgenol. 2013;201:W460–470. doi: 10.2214/AJR.12.10102. [DOI] [PMC free article] [PubMed] [Google Scholar]
- 19.Rodriguez A, Ranallo FN, Judy PF, Gierada DS, Fain SB. CT reconstruction techniques for improved accuracy of lung CT airway measurement. Med Phys. 2014;41:111911. doi: 10.1118/1.4898098. [DOI] [PMC free article] [PubMed] [Google Scholar]
- 20.Newell JD, Jr, Fuld MK, Allmendinger T, Sieren JP, Chan KS, Guo J, Hoffman EA. Very low-dose (0.15 mGy) chest CT protocols using the COPDGene 2 test object and a third-generation dual-source CT scanner with corresponding third-generation iterative reconstruction software. Invest Radiol. 2015;50:40–45. doi: 10.1097/RLI.0000000000000093. [DOI] [PMC free article] [PubMed] [Google Scholar]
- 21.Sieren JP, Hoffman EA, Fuld MK, Chan KS, Guo J, Newell JD., Jr Sinogram Affirmed Iterative Reconstruction (SAFIRE) versus weighted filtered back projection (WFBP) effects on quantitative measure in the COPDGene 2 test object. Med Phys. 2014;41:091910. doi: 10.1118/1.4893498. [DOI] [PMC free article] [PubMed] [Google Scholar]
- 22.Sieren JP, Newell JD, Guo J, Chan KS, Diakia J, Fuld MK, Hoffman EA. A 1024 CT reconstruction matrix and b70 kernel increases the precision of airway measurements in the COPDGene2 test-object [abstract] Am J Respir Crit Care Med. 2015;191:A3506. [Google Scholar]
- 23.Boedeker KL, McNitt-Gray MF, Rogers SR, Truong DA, Brown MS, Gjertson DW, Goldin JG. Emphysema: effect of reconstruction algorithm on CT imaging measures. Radiology. 2004;232:295–301. doi: 10.1148/radiol.2321030383. [DOI] [PubMed] [Google Scholar]
- 24.McCollough CH, Bruesewitz MR, McNitt-Gray MF, Bush K, Ruckdeschel T, Payne JT, Brink JA, Zeman RK American College of Radiology. The phantom portion of the American College of Radiology (ACR) computed tomography (CT) accreditation program: practical tips, artifact examples, and pitfalls to avoid. Med Phys. 2004;31:2423–2442. doi: 10.1118/1.1769632. [DOI] [PubMed] [Google Scholar]
- 25.Sieren JP, Newell JD, Judy PF, Lynch DA, Chan KS, Guo J, Hoffman EA. Reference standard and statistical model for intersite and temporal comparisons of CT attenuation in a multicenter quantitative lung study. Med Phys. 2012;39:5757–5767. doi: 10.1118/1.4747342. [DOI] [PMC free article] [PubMed] [Google Scholar]
- 26.Guo J, Wang C, Chan KS, Jin D, Saha PK, Sieren JP, Barr RG, Han MK, Kazerooni E, Cooper CB, et al. SPIROMICS Research Group. A controlled statistical study to assess measurement variability as a function of test object position and configuration for automated surveillance in a multicenter longitudinal COPD study (SPIROMICS) Med Phys. 2016;43:2598. doi: 10.1118/1.4947303. [DOI] [PMC free article] [PubMed] [Google Scholar]
- 27.Hoffman EA, Ahmed FS, Baumhauer H, Budoff M, Carr JJ, Kronmal R, Reddy S, Barr RG. Variation in the percent of emphysema-like lung in a healthy, nonsmoking multiethnic sample: the MESA lung study. Ann Am Thorac Soc. 2014;11:898–907. doi: 10.1513/AnnalsATS.201310-364OC. [DOI] [PMC free article] [PubMed] [Google Scholar]
- 28.Parr DG, Sevenoaks M, Deng C, Stoel BC, Stockley RA. Detection of emphysema progression in alpha 1-antitrypsin deficiency using CT densitometry; methodological advances. Respir Res. 2008;9:21. doi: 10.1186/1465-9921-9-21. [DOI] [PMC free article] [PubMed] [Google Scholar]
- 29.Stolk J, Putter H, Bakker EM, Shaker SB, Parr DG, Piitulainen E, Russi EW, Grebski E, Dirksen A, Stockley RA, et al. Progression parameters for emphysema: a clinical investigation. Respir Med. 2007;101:1924–1930. doi: 10.1016/j.rmed.2007.04.016. [DOI] [PubMed] [Google Scholar]
- 30.Manichaikul A, Hoffman EA, Smolonska J, Gao W, Cho MH, Baumhauer H, Budoff M, Austin JH, Washko GR, Carr JJ, et al. Genome-wide study of percent emphysema on computed tomography in the general population: the Multi-Ethnic Study of Atherosclerosis Lung/SNP Health Association Resource Study. Am J Respir Crit Care Med. 2014;189:408–418. doi: 10.1164/rccm.201306-1061OC. [DOI] [PMC free article] [PubMed] [Google Scholar]
- 31.Kim YK, Sung YM, Choi JH, Kim EY, Kim HS. Reduced radiation exposure of the female breast during low-dose chest CT using organ-based tube current modulation and a bismuth shield: comparison of image quality and radiation dose. AJR Am J Roentgenol. 2013;200:537–544. doi: 10.2214/AJR.12.9237. [DOI] [PubMed] [Google Scholar]
- 32.McCollough CH, Primak AN, Braun N, Kofler J, Yu L, Christner J. Strategies for reducing radiation dose in CT. Radiol Clin North Am. 2009;47:27–40. doi: 10.1016/j.rcl.2008.10.006. [DOI] [PMC free article] [PubMed] [Google Scholar]
- 33.Beister M, Kolditz D, Kalender WA. Iterative reconstruction methods in X-ray CT. Phys Med. 2012;28:94–108. doi: 10.1016/j.ejmp.2012.01.003. [DOI] [PubMed] [Google Scholar]
- 34.Baker ME, Dong F, Primak A, Obuchowski NA, Einstein D, Gandhi N, Herts BR, Purysko A, Remer E, Vachhani N. Contrast-to-noise ratio and low-contrast object resolution on full- and low-dose MDCT: SAFIRE versus filtered back projection in a low-contrast object phantom and in the liver. AJR Am J Roentgenol. 2012;199:8–18. doi: 10.2214/AJR.11.7421. [DOI] [PubMed] [Google Scholar]
- 35.Kalra MK, Woisetschläger M, Dahlström N, Singh S, Lindblom M, Choy G, Quick P, Schmidt B, Sedlmair M, Blake MA, et al. Radiation dose reduction with Sinogram Affirmed Iterative Reconstruction technique for abdominal computed tomography. J Comput Assist Tomogr. 2012;36:339–346. doi: 10.1097/RCT.0b013e31825586c0. [DOI] [PubMed] [Google Scholar]
- 36.Staring M, Bakker ME, Stolk J, Shamonin DP, Reiber JH, Stoel BC. Towards local progression estimation of pulmonary emphysema using CT. Med Phys. 2014;41:021905. doi: 10.1118/1.4851535. [DOI] [PubMed] [Google Scholar]
- 37.Fuld MK, Grout RW, Guo J, Morgan JH, Hoffman EA. Systems for lung volume standardization during static and dynamic MDCT-based quantitative assessment of pulmonary structure and function. Acad Radiol. 2012;19:930–940. doi: 10.1016/j.acra.2012.03.017. [DOI] [PMC free article] [PubMed] [Google Scholar]
- 38.Newell JD, Jr, Sieren J, Hoffman EA. Development of quantitative computed tomography lung protocols. J Thorac Imaging. 2013;28:266–271. doi: 10.1097/RTI.0b013e31829f6796. [DOI] [PMC free article] [PubMed] [Google Scholar]
- 39.Brown MS, Kim HJ, Abtin F, Da Costa I, Pais R, Ahmad S, Angel E, Ni C, Kleerup EC, Gjertson DW, et al. Reproducibility of lung and lobar volume measurements using computed tomography. Acad Radiol. 2010;17:316–322. doi: 10.1016/j.acra.2009.10.005. [DOI] [PubMed] [Google Scholar]
- 40.Iyer KS, Grout RW, Zamba GK, Hoffman EA. Repeatability and sample size assessment associated with computed tomography-based lung density metrics. Chronic Obstr Pulm Dis (Miami) 2014;1:97–104. doi: 10.15326/jcopdf.1.1.2014.0111. [DOI] [PMC free article] [PubMed] [Google Scholar]
- 41.Das S, Zijdenbos AP, Harlap J, Vins D, Evans AC. LORIS: a web-based data management system for multi-center studies. Front Neuroinform. 2012;5:37. doi: 10.3389/fninf.2011.00037. [DOI] [PMC free article] [PubMed] [Google Scholar]
- 42.Mobberley SD, Fuld MK, Sieren JP, Primak AN, Hoffman EA. Scatter correction associated with dedicated dual-source CT hardware improves accuracy of lung air measures. Acad Radiol. 2013;20:1334–1343. doi: 10.1016/j.acra.2013.04.018. [DOI] [PMC free article] [PubMed] [Google Scholar]
- 43.Galbán CJ, Han MK, Boes JL, Chughtai KA, Meyer CR, Johnson TD, Galbán S, Rehemtulla A, Kazerooni EA, Martinez FJ, et al. Computed tomography-based biomarker provides unique signature for diagnosis of COPD phenotypes and disease progression. Nat Med. 2012;18:1711–1715. doi: 10.1038/nm.2971. [DOI] [PMC free article] [PubMed] [Google Scholar]
- 44.Bhatt SP, Soler X, Wang X, Murray S, Anzueto AR, Beaty TH, Boriek AM, Casaburi R, Criner GJ, Diaz AA, et al. COPDGene Investigators. Association between functional small airways disease and FEV1 decline in chronic obstructive pulmonary disease. Am J Respir Crit Care Med. 2016;194:178–184. doi: 10.1164/rccm.201511-2219OC. [DOI] [PMC free article] [PubMed] [Google Scholar]
Associated Data
This section collects any data citations, data availability statements, or supplementary materials included in this article.


