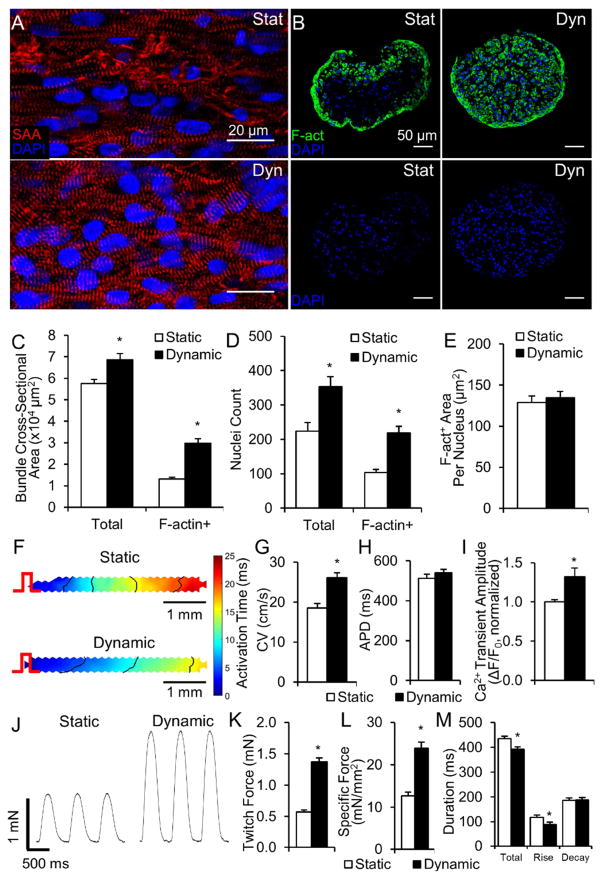
Figure 9. Effects of static and dynamic culture on structure and function of hPSC-CM cardiobundles.
(A–B) Representative longitudinal (A) and cross-sectional (B) images of human cardiobundles cultured for 2 weeks under static (Stat) or dynamic (Dyn) conditions, stained for sarcomeric α-actinin (SAA, red), F-actin (green), and nuclei (DAPI, blue). (C–E) Quantification of the total and F-actin+ cross-sectional area (C) and nuclei counts (D), and cross-sectional area per F-actin+ nuclei (E) in human cardiobundles (n = 24–26 cardiobundles per group from 7 differentiations). (F) Representative isochrone maps of action potential propagation in human cardiobundles in response to 1 Hz point pacing (pulse sign). (G–H) Quantification of conduction velocity (CV, G) and AP duration (APD, H) (n = 31–38 cardiobundles per group from 10 differentiations). (I) Ca2+ transient amplitude measured as a relative change in GCaMP6 fluorescence signal (ΔF/F0) during 1 Hz pacing (n = 10–14 cardiobundles per group from 3 differentiations). (J) Representative twitch force traces recorded from human cardiobundles during 1.5 Hz stimulation. (K–L) Quantification of max twitch force (K), specific force (per total cardiobundle cross-sectional area, L), and force kinetics (M) in human cardiobundles. (n = 23–33 cardiobundles per group from 6–9 differentiations). *, p < 0.05 vs. static culture.

