

Abstract
Protein prenylation is a post-translational modification that is responsible for membrane association and protein–protein interactions. The oncogenic protein Ras, which is prenylated, has been the subject of intense study in the past 20 years as a therapeutic target. Several studies have shown a correlation between neurodegenerative diseases including Alzheimer’s disease and Parkinson’s disease and protein prenylation. Here, a method for imaging and quantification of the prenylome using microscopy and flow cytometry is described. We show that metabolically incorporating an alkyne isoprenoid into mammalian cells, followed by a Cu(I)-catalyzed alkyne azide cycloaddition reaction to a fluorophore, allows for detection of prenylated proteins in several cell lines and that different cell types vary significantly in their levels of prenylated proteins. The addition of a prenyltransferase inhibitor or the precursors to the native isoprenoid substrates lowers the levels of labeled prenylated proteins. Finally, we demonstrate that there is a significantly higher (22%) level of prenylated proteins in a cellular model of compromised autophagy as compared to normal cells, supporting the hypothesis of a potential involvement of protein prenylation in abrogated autophagy. These results highlight the utility of total prenylome labeling for studies on the role of protein prenylation in various diseases including aging-related disorders.
The post-translational modification known as protein prenylation occurs on approximately 2% of all mammalian proteins.1 Prenylation involves the covalent attachment of a farnesyl or geranylgeranyl isoprenoid moiety to the cysteine residue of proteins bearing a C-terminal CaaX box, where C is cysteine, a is an aliphatic amino acid, and X is a residue that determines whether the protein is farnesylated (by the enzyme farnesyltransferase, FTase) or geranylgeranylated (by the enzyme geranylgeranyltransferase type I, GGTase-I).2 A third form of prenylation involves digeranylgeranylation of Rab proteins, catalyzed by geranylgeranyltransferase type II (GGTase-II), at C-terminal sequences including CC, CXC, and CCXX.2 Protein prenylation has been the focus of numerous studies since its discovery in the early 1990s due to its connection with cancer, mainly through Ras proteins. Members of the Ras family of proteins are naturally prenylated, and mutated forms of Ras are involved in as many as 30% of all human cancers.3 Inhibition of prenylation using farnesyltransferase inhibitors has been investigated clinically for anticancer therapies, with limited success.4−7 Paradoxically, farnesyltransferase inhibitors have no effect on some patients, while they are effective in others.7
In addition to the cancer association noted above, prenylation inhibitors may be useful as therapeutic agents in other diseases. Prenylated proteins have been shown to be important for the progression of some viral and parasitic diseases. A number of studies indicate the potential utility of prenylation inhibitors against malaria, Chagas disease, and hepatitis.8−10 Protein prenylation has also been implicated in neurodegenerative diseases. For example, the farnesylated protein UCH-L1 is linked to Parkinson’s disease, and inhibition of farnesylation of this protein has been suggested as a possible therapy for this disease.11 A potential connection to Alzheimer’s disease (AD) has been revealed based on the finding that the levels of farnesyl diphosphate (FPP) and geranylgeranyl diphosphate (GGPP), which are substrates of prenyltransferase enzymes, are elevated in the brains of AD patients.12−14In vitro, acute treatment of mouse brain slices with a statin enhanced long-term potentiation (LTP) in the CA1 region of the hippocampus and LTP enhancement was shown to be caused by FPP depletion and the inhibition of protein farnesylation.15In vivo, chronic statin treatment rescued cognitive function in a transgenic AD mouse model and improved learning and memory in nontransgenic mice without affecting Aβ and total brain cholesterol levels.16 In aggregate, these results illustrate why studies that seek to identify prenylated proteins and quantify their levels are important.
In early work, prenylated proteins were identified via experiments that monitored the incorporation of tritiated forms of FPP, GGPP, or mevalonic acid.17 This approach suffers from low intrinsic sensitivity requiring exposure times as long as several months during autoradiography analysis.18 Additionally, efforts to use such experiments to quantify the level of prenylated proteins are complicated by metabolic flux of these substrates into other pathways including cholesterol biosynthesis making fractionation prior to analysis a requirement.19 Recently, Spielmann and co-workers have developed an elegant mass spectrometric method to quantify prenylation, but that approach requires extensive sample preparation to yield the requisite prenylcysteine analytes.20 In 2004, Kho et al. reported the use of farnesyl azide in metabolic labeling experiments to identify prenylated proteins.21 In their work, cell culture was performed in the presence of farnesyl azide followed by lysis and subsequent Staudinger ligation with a biotin-containing reagent. The resulting labeled proteins could be visualized via Western blotting or identified using pull-down experiments. Since that time, numerous groups have employed this approach to label and identify prenylated proteins.22−27 Efforts to use isoprenoid analogues that contain pre-existing reporter groups have also been developed, but those methods each have distinct limitations. Analogues containing biotin moieties are limited to in vitro experiments and/or cell lines transfected with mutant prenyltransferases,28 while those containing BODIPY groups are only efficiently incorporated by GGTase II.29
The development of the Cu-catalyzed alkyne azide cycloaddition reaction, CuAAC, has revolutionized metabolic labeling. Since it is significantly faster than the Staudinger ligation, it is much easier to obtain quantitative labeling.30 This has also opened up the possibility of incorporating alkynes in lieu of azides into alternative enzyme substrates. Since it is generally agreed that lower levels of background labeling are obtained when the detection reagent (the species in large excess) is an azide, alkyne-containing substrate analogues have become the norm for metabolic labeling.23,31
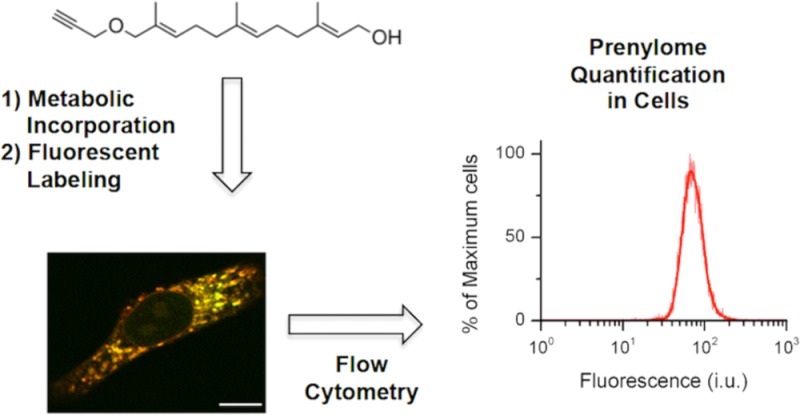
Accordingly, our group and others have previously reported on the development of alkyne isoprenoid analogs25,32−34 and employed them for identification of prenylated proteins present within cells.23−25,27 Here, we extend the use of one of the alkyne-containing analogs for imaging and quantification of the global prenylome through the use of the CuAAC in situ (Figure 1). This method allows for the localization of prenylated proteins to be visualized, with our results highlighting the distribution of most of the labeled prenylated proteins in the endoplasmic reticulum (ER). Extending the method to flow cytometry, we show that relative quantification of the prenylome in cells is possible and gives results similar to those obtained via in-gel fluorescence analysis. This new method, however, is more facile and less time-consuming compared to in-gel fluorescence analysis. Importantly, the method is applicable to a variety of cell types, including primary astrocytes. Lastly, using a cellular model of compromised autophagy (via siRNA-mediated knockdown of BECN1 gene) as a surrogate to study aging disorders, we show that the levels of prenylated proteins are increased upon autophagy inhibition. This may indicate the potential involvement of protein prenylation in aging disorders such as AD and PD, as these diseases have been shown to involve compromised and/or deficient autophagy.35
Figure 1.

Workflow for the metabolic incorporation of an isoprenoid analog and subsequent derivatization with a fluorophore for monitoring the global prenylome.
Results and Discussion
Characterization of C15Alk Substrate
In earlier work, we established that a diphosphate version of C15Alk (C15Alk-OPP, Figure S2) is an efficient substrate for yeast FTase and human GGTase-I using in vitro spectrofluorimetric assays.33 Similar experiments revealed that C15Alk-OPP is also a substrate for rat FTase with a kcat/KM value only 3.2-fold lower relative to FPP (using N-dansyl-GCVLS as the isoprenoid acceptor, Table S1, Figure S1). In addition, results using combinatorial libraries and focused peptide libraries show that rat FTase can use C15Alk-OPP to prenylate a wide range of CaaX sequences.36,37 Consistent with these in vitro results, our group and others have demonstrated that C15Alk-OPP and C15Alk become incorporated into a diverse range of prenyltransferase substrate proteins in mammalian cells, confirming that this analogue is a substrate for all three protein prenyltransferases.23−25,27 This latter point is important since it underscores why C15Alk can be used to report on the total level of prenylation.
For metabolic labeling of cells, the alcohol form of the analog is often used owing to its better cell penetration kinetics compared to the negatively charged diphosphate form. While phosphorylation of farnesol and geranylgeraniol is not part of the normal biosynthetic pathway for FPP and GGPP, exogenously provided isoprenoid alcohols are readily converted to the corresponding isoprenoid diphosphates inside cells by alternative pathways and are used by prenyltransferase enzymes.20 We first sought to determine how well C15Alk is incorporated compared to the natural isoprenoid, FPP, in cultured cells. To study this, we examined the prenylation state of H-Ras, a prototypical farnesylated protein, which can be detected in processed (prenylated, proteolyzed and methylated) and unprocessed forms using a Western blot. COS-1 cells were incubated with lovastatin, an HMG-CoA reductase inhibitor, to deplete the endogenous isoprenoids in the cells; Hohl and co-workers have previously noted that lovastatin treatment of NIH 3T3 cells results in a substantial decrease in cellular FPP and GGPP concentrations (69% and 77%, respectively).38 Consequently, H-Ras prenylation is inhibited, seen as processed H-Ras being reduced by approximately 45% (Figure S3, lane 2) compared to approximately 90% processed under normal conditions (Figure S3, lane 1). When farnesol (FOH), the precursor to the native substrate FPP, was administered along with lovastatin, H-Ras processing was completely restored (Figure S3, lane 3) to the levels seen in the negative control (Figure S3, lane 1). When lovastatin was given in combination with C15Alk, H-Ras became approximately 70% processed (Figure S3, lanes 5). Thus, while C15Alk does not completely rescue H-Ras processing, it is clear that significant amounts of C15Alk are metabolically incorporated, suggesting that it is suitable for studies of prenylated proteins involving intact cells.
Cellular Labeling and Imaging
We next set out to determine if it was possible to use the CuAAC to fluorescently label and visualize the distribution of alkyne-labeled prenylated proteins in mammalian cells. HeLa cells were incubated with C15Alk (10 μM) for 24 h, in the presence or absence of overnight pretreatment with lovastatin (25 μM) followed by fixation, permeabilization, and washing to remove unincorporated alkyne. Next, the CuAAC was performed in situ by adding the reagents directly to the cells for 1 h together with 5-Fam-PEG-N3. The cells were then rinsed several times to remove excess fluorescent reagent and imaged using confocal microscopy. These experiments revealed a large amount of cellular labeling (Figure 2B), with a higher degree of labeling following pretreatment with lovastatin (Figure 2C). Importantly, the background labeling (Figure 2A) was almost nonexistent, which was essential to verify that nonspecific labeling with the fluorophore azide was not occurring. The flexible, hydrophilic PEG linker in the fluorescent azide was found to be critical, as using a less flexible, shorter, or more hydrophobic linker results in a much higher background signal (data not shown). Finally, it should be noted that since the cells are permeabilized and fixed (4% paraformaldehyde, 0.1% Triton X-100) prior to the CuAAC derivatization step, it is likely that some cellular lipids are washed away,39 thereby providing access to the alkyne groups which would typically be buried within the bilayer. Additionally, given the cross-linking that typically occurs upon fixation, modification of the alkyne-functionalized lipid group is unlikely to cause a change in cellular localization of the lipidated protein. Overall, this strategy for imaging prenylated proteins using alkyne-modifed isoprenoids is similar to methods previously reported for visualizing cholesterol itself and fatty acid-modified proteins.40,41
Figure 2.
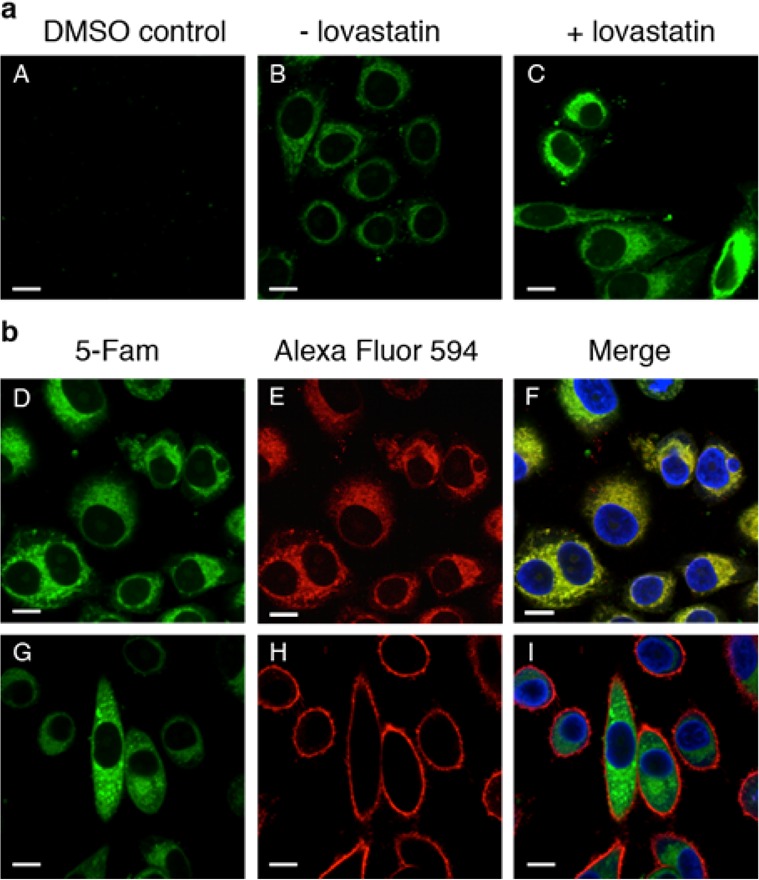
Imaging of prenylated proteins in mammalian cells via confocal microscopy. This indicates that a majority of C15Alk-labeled proteins localize in the endomembrane including the ER. Upon metabolic labeling (specified for each panel), cells were fixed and permeabilized. After several rinses, the cells were subjected to the CuAAC for 1 h with 5-Fam-PEG-N3 and imaged using a 60× objective. The green channel shows prenylated proteins “clicked” to 5-Fam-PEG-N3, and the blue channel shows the cell nucleus stained with Hoechst 34580. (A) Control reaction in which HeLa cells were treated with DMSO only. (B) HeLa cells were treated with 10 μM C15Alk for 24 h in the absence of lovastatin pretreatment. (C–I) HeLa cells treated overnight with 25 μM lovastatin, followed by 10 μM C15Alk for 24 h. (E) Red channel showing staining of ER by ER Tracker Red. (F) Overlay of images from D and E, along with nuclear stain (blue), showing significant colocalization of the green fluorescence with the ER. A zoomed in view of a region from this image is provided in Figure S4. (H) Red channel showing staining of PM by Wheat Germ Agglutinin conjugated to Alexa Fluor 594. (I) Overlay of images from G and H, along with nuclear stain (blue), indicate that the majority of the green fluorescence does not colocalize with PM. Size bar represents 10 μm.
The fluorescence observed in the cells appeared to be punctate in nature and distributed throughout the cells in the endomembrane although absent from the nucleus. It is known that prenylated proteins undergo the isoprenoid modification in the cytosol and are subsequently trafficked to the ER and Golgi for further processing before becoming localized to the plasma membrane (PM).42 To explore if this was indeed what was being observed, HeLa cells were counterstained with ER Tracker Red to visualize the ER (Figure 2E) and Wheat Germ Agglutinin conjugated to Alexa Fluor 594 to visualize the PM (Figure 2H). The results show almost complete colocalization between the 5-FAM and ER Tracker Red fluorescence with a Pearson correlation coefficient of 0.833 (Figure 2F). This indicates significant localization of the labeled proteins to the ER, consistent with the established mechanism of prenylated protein transport. It should be noted that while treatment with lovastatin does alter the localization of prenylated proteins, that effect is typically reversed upon the addition of exogenous isoprenoids.43−45 To confirm this, the localization of the C15Alk-modified proteins was examined in the absence of lovastatin where they were observed to colocalize predominantly with the ER with a Pearson’s coefficient of 0.711 (see Figure S4); those results are similar to those obtained after statin pretreatment, noted above, indicating that lovastatin has a minimal effect on the localization of prenylated proteins.
Quantitative Analysis Using Flow Cytometry
Having established the ability to label prenylated proteins in cells, we next sought to develop a method to quantify the total labeling in order to measure the levels of prenylation. To accomplish this, cells were incubated with C15Alk followed by fixation and permeabilization of cells, and then CuAAC with 5-Fam-PEG-N3 for 1 h. Next, the cells were rinsed and analyzed by flow cytometry to measure the fluorescence intensity of each cell. We first optimized the conditions for cell permeabilization and the concentration of 5-Fam-PEG-N3 for in situ CuAAC (Figure S5). To examine whether background labeling due to the reaction of 5-Fam-PEG-N3 with an unincorporated alkyne probe present inside cells was occurring, HeLa cells were treated with an alkyne-containing analog of farnesol, farnesyl alkyne, that is not a prenyltransferase substrate (Figure 1). As seen in Figure S6, no cellular labeling was observed above the minimal labeling present in the control sample (cells treated with only DMSO), suggesting that the excess alkyne probe is effectively removed in the washing steps. Overall, these experiments showed that incubation with C15Alk resulted in a significant amount of protein labeling compared to the control sample, and that excess isoprenoid analog and fluorescent azide could be removed during wash steps.
Optimizing Conditions for Metabolic Labeling
To optimize the conditions for metabolic incorporation, HeLa cells were treated with 10–50 μM of C15Alk for 24 h. Quantification via flow cytometry revealed a concentration-dependent increase in labeling (Figure 3, light gray columns); labeling at 100 and 200 μM C15Alk (Figure S7) was also observed. However, at those higher concentrations, C15Alk was found to be somewhat toxic to cells. Metabolic labeling of prenylated proteins is often carried out in the presence of an HMG-CoA reductase inhibitor to reduce endogenous levels of isoprenoids and thereby increase the incorporation of isoprenoid analogs. A recent study also suggests that the metabolism of exogenously added isoprenoid alcohols (conversion to isoprenoid diphosphate and incorporation into prenylated proteins) increases upon inhibition of HMG-CoA reductase.20 Flow cytometry analysis indeed revealed increased incorporation of C15Alk at any given concentration in the presence of lovastatin (Figure 3, dark gray columns).
Figure 3.

Flow cytometry analysis demonstrating a concentration dependent increase in the incorporation of C15Alk. HeLa cells were incubated with C15Alk at indicated concentrations (10, 25, or 50 μM) in the presence or absence of overnight pretreatment with 25 μM lovastatin, followed by fixation, permeabilization, and CuAAC with 5-Fam-PEG-N3 for 1 h. The cells were analyzed via flow cytometry, and the results are expressed as the mean fluorescence intensity of 10 000 cells ± standard error of the mean of at least three replicates. For statistical analysis, a two-way ANOVA using Sidak’s multiple comparisons test was performed. Results were considered significant if p < 0.05 (*), p < 0.01 (**), or p < 0.001 (***).
We next sought to compare the results obtained above to those observed using a previously established in-gel fluorescence method to visualize prenylated proteins.23 For in-gel analysis, HeLa cells were incubated with 10–50 μM C15Alk for 24 h, followed by lysis and CuAAC with TAMRA-PEG-N3 in the cellular lysate. After removal of the excess reagents by protein precipitation, proteins were resolubilized and separated using an SDS-PAGE gel, which was subsequently scanned to visualize and quantify the fluorescently labeled proteins by densitometry. Consistent with the flow cytometry results, in-gel fluorescence analysis showed a concentration dependent increase in labeling of HeLa cell-derived proteins (Figure 4, left panel, lanes 2, 4, 6 and 8; Figure 4, right panel, gray columns). Lovastatin pretreatment caused an increase in labeling of proteins with C15Alk (Figure 4, right panel, black columns).
Figure 4.

In-gel fluorescence analysis demonstrating the effects of lovastatin pretreatment on incorporation of C15Alk at various concentrations. Left panel: HeLa cells were incubated with C15Alk at indicated concentrations, in the presence or absence of overnight pretreatment with 25 μM lovastatin. Cells were then lysed, and lysates were subjected to the CuAAC to TAMRA-PEG-N3 and fractionated on a 12% polyacrylamide gel. The gel was scanned for TAMRA fluorescence and stained with Coomassie Blue to obtain the total protein stain image. Right panel: Densitometry analysis of the gel (in 20–150 kDa regions of each lane) shown in the left panel using ImageJ. Background labeling (lane 1) was subtracted from other lanes, and data were normalized to the total protein stain.
In general, the protein labeling pattern observed with C15Alk was similar to that previously reported using tritiated mevalonolactone or farnesol.19,46 However, in-gel fluorescence revealed differences in labeling patterns in the presence of lovastatin at various concentrations of C15Alk; this concentration dependence has not been studied with tritiated substrates. While very little labeling was observed in the absence of lovastatin at 5 μM and 10 μM C15Alk (Figure 4, left panel, lanes 2 and 4), intense bands appeared in the presence of lovastatin, specifically in the 20–25 kDa region of the gel (Figure 4, left panel, lanes 3 and 5). Small GTPases of the Ras superfamily, many of which are prenyltransferase substrates, have molecular masses in this range.47 At 25 μM and 50 μM C15Alk, several protein bands in the 30–75 kDa region were labeled in the absence of lovastatin (Figure 4, left panel, lanes 6 and 8). However, the intensity of those bands did not change significantly in the presence of lovastatin; the most prominent effect of lovastatin pretreatment again was the increase in labeling in the 20–25 kDa region (Figure 4, right panel, lanes 7 and 9). Overall, these experiments indicate that labeling in the 20–25 kDa region increases in the presence of lovastatin, whereas C15Alk-labeling of many other proteins is much less sensitive to lovastatin treatment. Importantly, these results show that the percentage of lovastatin-induced labeling (attributable to prenyltransferase-dependent incorporation) decreases as the concentration of C15Alk employed is increased (Figure 4, right panel, diagonal shading) and underscore the importance of performing metabolic labeling at lower probe concentrations to maximize the specificity of incorporation. Given that the concentrations of FPP and GGPP in NIH 3T3 cells have been estimated to be approximately 1–2 μM in the absence of lovastatin,38 it is not surprising that the level of labeling obtained using 5–10 μM C15Alk is relatively low, but detectable (see Figure 4, left panel), without lovastatin treatment. However, there is a dramatic increase (∼60% at 10 μM C15Alk, see Figure 4, right panel) in labeling upon lovastatin treatment. It is also worth noting that prenyltransferases manifest KM values for their isoprenoid substrates of less than 0.5 μM, suggesting the enzymes are likely to be saturated using 10 μM C15Alk.48In vitro experiments employing 10 μM FPP have been used to estimate kcat/KM values for a range of different, CaaX box-containing peptides representing sequences found in the human proteome that span a 500-fold range in reactivity.49
Follow-up studies examined the lovastatin-independent labeling obtained with C15Alk, to gain additional insight into this phenomenon. Flow cytometry analysis indicated that the presence of 25 μM FOH and geranylgeraniol (GGOH), precursors to the physiological substrates FPP and GGPP, did not reduce labeling obtained using 25 μM C15Alk (Figure S8, left). In-gel fluorescence analysis indicated that inclusion of those isoprenoid competitors (25 μM FOH and GGOH) reduced labeling only in the 20–25 kDa region with a slight increase observed in the 30–75 kDa region (Figure S8, right panel, lanes 6 and 7). Next, cells were treated with 2,3-dihydro-C15Alk (C15-DH-Alk, Figure 1). Despite its resemblance to C15Alk, C15-DH-Alk cannot act as a substrate for prenyltransferases since it lacks the allylic feature necessary for enzymatic processing even once it is phosphorylated. Interestingly, 50 μM treatment of C15-DH-Alk gave rise to significant protein labeling as observed by in-gel fluorescence analysis (Figure S9, left panel) and flow cytometry (Figure S9, right panel). This labeling was not affected by the presence of lovastatin, which is expected given that it is not a substrate of protein prenyltransferases. Importantly, this result also removes the possibility that the lovastatin-induced variations in labeling with C15Alk are due to changes in protein levels since no such variations were observed using C15-DH-Alk. Overall, these findings suggest that a significant fraction of the labeling obtained using 25–50 μM C15Alk, which is not affected by the presence of lovastatin, occurs via a protein prenyltransferase-independent process. Such off-target labeling of proteins by metabolic cross-talk has been reported for other chemical reporters of post-translational modifications, such as protein glycosylation.50
To decrease the extent of this prenyltransferase-independent process, the use of a lower concentration of C15Alk (10 μM) was explored in more detail. Flow cytometry analysis showed that cotreatment with 10–50 μM FOH and GGOH significantly decreased labeling obtained using 10 μM C15Alk treatment (Figure 5, light gray columns). Co-treatment with 25 μM FOH and GGOH led to suppression of C15Alk labeling of proteins up to ∼50%. At 50 μM FOH and GGOH, labeling did not decrease any further, which may result from enhanced cellular entry of C15Alk due to solubilizing effects of FOH and GGOH; some cellular toxicity and changes in cellular appearance were also noted at these higher isoprenoid concentrations. In-gel fluorescence analysis and subsequent densitometry gave similar results (Figure 5, black columns); under those conditions, it was particularly noteworthy that labeling in the 20–25 kDa region was abolished (Figure S10). Similarly, cotreatment with prenyltransferase inhibitors resulted in a reduction of labeling of HeLa and COS-7 cells of up to 60% and 40% (Figure S11), respectively, further demonstrating that the observed protein labeling was the result of metabolic incorporation of C15Alk into prenylated proteins. In aggregate, these experiments suggest that a significant fraction (approximately 50%) of the labeling obtained with C15Alk at a lower concentration (10 μM) is derived from prenylated proteins and that this labeling can be used to quantify the levels of protein prenylation in cells.
Figure 5.

Flow cytometry and in-gel fluorescence analysis showing that farnesol and geranylgeraniol significantly compete away C15Alk labeling. HeLa cells were treated for 24 h with 10 μM C15Alk, in the presence or absence of 25 μM lovastatin overnight pretreatment. Various concentrations of farnesol and geranylgeraniol (10, 25, or 50 μM) were added simultaneously with C15Alk to compete away cellular labeling of prenylated proteins. Densitometry measurements of in-gel fluorescence images were performed using ImageJ and plotted along with in situ analysis via flow cytometry of similarly treated cells, subjected to the flow cytometry quantification method described above. The results are displayed as the normalized maximum fluorescence labeling in which each sample was divided by the maximum value to give a percentage of fluorescent labeling. Both sets of data have been background-subtracted, and the densitometry data are normalized to the total protein stain.
Having established that the labeling obtained using C15Alk at 10 μM is largely due to incorporation into prenylated proteins, the time-dependence of probe incorporation was studied. When HeLa cells were treated overnight with lovastatin and then incubated with 10 μM of C15Alk for varied lengths of time, a time-dependent increase in labeling was observed via both flow cytometry and in-gel fluorescence analysis, plateauing around 24 h (Figure S12). Additionally, we found that at 24 h, the level (via flow cytometry) and pattern of protein labeling (via SDS PAGE) with 10 μM C15Alk were comparable to those obtained using the diphosphate form of the analogue (10 μM C15Alk-OPP, Figure S13). The plateau observed in these experiments suggests that the pool of labeled proteins has reached a steady state, thus allowing an accurate measurement of the levels of prenylated proteins to be made. Taken together, these experiments indicate that overnight pretreatment with 25 μM lovastatin and 24 h treatment with 10 μM C15Alk result in robust and prenylation-specific protein labeling.
Extension to Other Cell Types
After validating this labeling method in HeLa cells, we next sought to examine its utility in other cell lines to broaden its potential scope. In earlier work using gel-based methods, it was noted that different cell types including HeLa cells, MCF10A cells, and D1 astrocytes gave rise to different patterns of protein labeling.23 Using the flow cytometry method described here, significant differences in the overall levels of prenylated proteins were also found (Figure S14 and Figure S15, left panels). HeLa cells showed the largest extent of labeling, while A549 cells, derived from human lung adenocarcinoma, had a significantly lower level of labeling than all other cells tested. Importantly, analysis of cell area using microscopy demonstrated only minor differences in the size between these cell types (Figure S14, right panel), indicating that variations in the levels of prenylated proteins between different cell lines are not simply a consequence of a difference in cell size. For example, A549 cells are the same size as HeLa and MCF10A cells but displayed a more than 2-fold lower level of prenylated proteins. However, it is not possible to attribute these differences solely to variations in the levels of prenylated proteins. Alternative explanations including differences in protein turnover and C15Alk phosphorylation rates could also affect the observed extent of labeling.
To further expand the utility of this method, we also explored its application to primary cells; such cells can sometimes more accurately reflect cellular biochemistry compared with immortalized cell lines. For this, primary astrocytes and glial cells were isolated from mice, and the levels of prenylated proteins in them were quantified using the methods outlined above. These cells demonstrated efficient incorporation of 10 μM C15Alk (Figure S15, right panel). Taken together, these results highlight the highly variable nature of protein prenylation in different cell types and the ability of the flow cytometry method reported here to quantify prenylated proteins in a wide spectrum of systems. However, given the points noted above, quantitative comparisons of labeling levels are probably best restricted to experiments performed within the same cell line.
Measurements in an Autophagy Model
Having established a method for determining the relative levels of prenylated proteins within cells, we next sought to test its utility by using it to examine the levels of prenylation in a cellular model of compromised autophagy. Autophagy is a degradation mechanism for dysfunctional cellular components and aggregated proteins via the lysosome. It is transcriptionally down-regulated in the brain during normal aging,51 and dysregulation of autophagy is involved in neurodegenerative diseases including AD and PD.52−54 This is correlated with a decreased abundance of the autophagy-related protein Beclin 1 in the aging human brain.51 Knockdown of this gene with siRNA is widely used as a model system for defective autophagy.55,56 Furthermore, Beclin 1 expression is reduced in early AD and it has been shown to regulate Aβ accumulation in mice.53 Therefore, a defective autophagy phenotype created by knocking down the BECN1 gene offers a simplified cellular model for investigating levels of protein prenylation in neurodegenerative diseases.51,57 Interestingly, previous studies have reported that induction of autophagy results in a decrease in the levels of cellular isoprenoids, suggesting that cells that cannot undergo autophagy (due to aging) have higher levels of FPP and GGPP.58 Elevated levels of these isoprenoids have also been observed in AD models as noted above.12,59 If concentrations of these isoprenoids are indeed increased in those disease state models, it is likely that the levels of prenylated proteins will be concomitantly higher as well. While the two aforementioned examples suggest mechanisms for how the levels of prenylated proteins may increase in aging, other cellular events may lead to decreases. Given the importance of prenylated proteins in regulating a diverse range of cellular processes, the question of how the levels of these proteins vary during aging is clearly important.
To examine whether the levels of prenylated proteins change in an aging model system, C2C12 mouse myoblast cells were transfected with siRNA against the BECN1 gene for 4 h and then incubated for 24 h to maximize gene knockdown; such commercially available siRNAs have been widely used in aging studies.60,61 The cells were then treated with 25 μM lovastatin and 10 μM C15Alk for 24 h followed by fixation, permeabilization, and the CuAAC with 5-Fam-PEG-N3. Lovastatin was included here to maximize alkyne incorporation. While statins themselves have been implicated in the activation of autophagy,62 those effects are reversed by exogenous isoprenoids (likely including C15Alk).58 Flow cytometry analysis revealed that C2C12 cells in which the BECN1 gene was knocked down showed a 22% increase in the levels of prenylated proteins (Figure 6) compared to cells transfected with a scrambled siRNA. In a separate experiment, an alternate model was explored. For that, L6 rat myoblast cells were transfected with an siRNA directed against the ATG7 gene (another gene involved in autophagy) followed by treatment with lovastatin and C15Alk. Flow cytometry analysis showed a similar increase in the level of prenylated proteins in the cells where ATG7 was knocked down relative to those treated with the scrambled siRNA control (Figure S16). While preliminary, these results suggest that the levels of prenylated proteins are higher in cells undergoing premature aging, at least in these model systems (BECN1 and ATG7 knockdown). Whether this observation is due to upregulation of prenyltransferase activity/expression, variations in prenyltransferase protein substrate levels, or changes in the half-life of prenylated proteins remains unknown. Nevertheless, the results described here set the stage for further investigation of this important observation and highlight the utility of the new methods reported here for investigating the prenylome.
Figure 6.

Results of a cellular model of compromised autophagy. In a cellular model of compromised autophagy, a surrogate for studying aging disorders, the levels of prenylated proteins are increased over normal control levels. In the defective autophagy cell model, the BECN1 gene controlling autophagy was knocked down with siRNA (denoted as siRNA against Bec-1) for 24 h prior to C15Alk exposure. Normal control cells included transfection of a scrambled siRNA. After 24 h of transfection, cells were incubated with 25 μM lovastatin and 10 μM C15Alk for 24 h, followed by fixing, permeabilizing, CuAAC with 5-Fam-PEG-N3, and analysis by flow cytometry. Results are expressed as the mean fluorescence intensity of 10 000 cells ± standard error of the mean of at least three replicates. There is a statistically significant (p < 0.001) increase in the level of prenylated proteins in the model of compromised autophagy.
Conclusions
In summary, the flow cytometry-based method described here allows relative quantification of the total level of prenylated proteins in various types of cells, including primary astrocytes. Data from this flow cytometry method correlate well with results obtained using a more established in-gel fluorescence method, suggesting that this method can be employed to measure relative protein prenylation levels. An important advantage of the flow cytometry method, however, is that the CuAAC is performed in situ, and the analysis and quantitation can be completed in minutes via whole-cell flow cytometry with fluorescence detection, as compared to the more laborious gel-based technique. Overall, these methods serve complementary purposes. For rapid quantification of global prenylation levels, the flow cytometry procedure is a useful tool; when studying individual prenylated proteins, gel-based techniques are the preferred methods.
Using this method, we have demonstrated that many prenylated proteins metabolically labeled with C15Alk localize to the ER and that different cell types have significantly different levels of prenylated proteins. Furthermore, we have shown that the levels of prenylated proteins increase in a cellular model of compromised autophagy; these observations suggest a possible connection between protein prenylation and aging disorders. The simplicity of this approach should make it useful in a variety of studies that probe changes in isoprenoid metabolism and prenylated protein levels.
Acknowledgments
We would like to acknowledge the assistance of the Flow Cytometry Core Facility of the Masonic Cancer Center, a comprehensive cancer center designated by the National Cancer Institute, supported in part by P30 CA77598, and the University of Minnesota Imaging Center, a Nikon Center of Excellence for confocal microscopy. This work was supported by the National Institutes of Health grants R01 GM058842 and R01 GM084152 (M.D.D.), R01 AG020866 (E.A.A.), R01 AG031846 (L.L.), T32 GM08700 (M.M.K.), and T32 GM008347 (J.D.O.) as well as by the National Science Foundation grant CHE-1308655 (M.D.D.).
Supporting Information Available
The Supporting Information is available free of charge on the ACS Publications website at DOI: 10.1021/acschembio.6b00421.
Experimental methods (materials, general cell culture, imaging prenylated proteins, quantifying the prenylome, in-gel fluorescence, in-gel fluorescence densitometry, primary astrocyte preparation, siRNA-mediated knockdown of BECN1, kinetic constant measurement, Western blot analysis, TAMRA-PEG-N3 synthesis, farnesyl alkyne synthesis) and supporting data (Table S1, Figures S1–S14) (PDF)
Author Contributions
∥ These authors have equal contribution to the work.
The authors declare no competing financial interest.
Supplementary Material
References
- Epstein W. W.; Lever D.; Leining L. M.; Bruenger E.; Rilling H. C. (1991) Quantitation of prenylcysteines by a selective cleavage reaction. Proc. Natl. Acad. Sci. U. S. A. 88, 9668–9670. 10.1073/pnas.88.21.9668. [DOI] [PMC free article] [PubMed] [Google Scholar]
- Zhang F. L.; Casey P. J. (1996) Protein prenylation: Molecular mechanisms and functional consequences. Annu. Rev. Biochem. 65, 241–269. 10.1146/annurev.bi.65.070196.001325. [DOI] [PubMed] [Google Scholar]
- Saxena N.; Lahiri S. S.; Hambarde S.; Tripathi R. P. (2008) RAS: target for cancer therapy. Cancer Invest. 26, 948–955. 10.1080/07357900802087275. [DOI] [PubMed] [Google Scholar]
- Agrawal A. G.; Somani R. R. (2009) Farnesyltransferase inhibitor as anticancer agent. Mini-Rev. Med. Chem. 9, 638–652. 10.2174/138955709788452702. [DOI] [PubMed] [Google Scholar]
- Brunner T. B.; Hahn S. M.; Gupta A. K.; Muschel R. J.; McKenna W. G.; Bernhard E. J. (2003) Farnesyltransferase inhibitors: an overview of the results of preclinical and clinical investigations. Cancer Res. 63, 5656–5668. [PubMed] [Google Scholar]
- Konstantinopoulos P. A.; Karamouzis M. V.; Papavassiliou A. G. (2007) Post-translational modifications and regulation of the RAS superfamily of GTPases as anticancer targets. Nat. Rev. Drug Discovery 6, 541–555. 10.1038/nrd2221. [DOI] [PubMed] [Google Scholar]
- Berndt N.; Hamilton A. D.; Sebti S. M. (2011) Targeting protein prenylation for cancer therapy. Nat. Rev. Cancer 11, 775–791. 10.1038/nrc3151. [DOI] [PMC free article] [PubMed] [Google Scholar]
- Fletcher S.; Cummings C. G.; Rivas K.; Katt W. P.; Horney C.; Buckner F. S.; Chakrabarti D.; Sebti S. M.; Gelb M. H.; Van Voorhis W. C.; Hamilton A. D. (2008) Potent, Plasmodium-selective farnesyltransferase inhibitors that arrest the growth of malaria parasites: structure-activity relationships of ethylenediamine-analogue scaffolds and homology model validation. J. Med. Chem. 51, 5176–5197. 10.1021/jm800113p. [DOI] [PMC free article] [PubMed] [Google Scholar]
- Kraus J. M.; Tatipaka H. B.; McGuffin S. A.; Chennamaneni N. K.; Karimi M.; Arif J.; Verlinde C. L. M. J.; Buckner F. S.; Gelb M. l. H. (2010) Second generation analogues of the cancer drug clinical candidate tipifarnib for anti-Chagas disease drug discovery. J. Med. Chem. 53, 3887–3898. 10.1021/jm9013136. [DOI] [PMC free article] [PubMed] [Google Scholar]
- Bordier B. B.; Marion P. L.; Ohashi K.; Kay M. A.; Greenberg H. B.; Casey J. L.; Glenn J. S. (2002) A prenylation inhibitor prevents production of infectious hepatitis delta virus particles. J. Virol. 76, 10465–10472. 10.1128/JVI.76.20.10465-10472.2002. [DOI] [PMC free article] [PubMed] [Google Scholar]
- Liu Z.; Meray R. K.; Grammatopoulos T. N.; Fredenburg R. A.; Cookson M. R.; Liu Y.; Logan T.; Lansbury P. T. Jr. (2009) Membrane-associated farnesylated UCH-L1 promotes alpha-synuclein neurotoxicity and is a therapeutic target for Parkinson’s disease. Proc. Natl. Acad. Sci. U. S. A. 106, 4635–4640. 10.1073/pnas.0806474106. [DOI] [PMC free article] [PubMed] [Google Scholar]
- Eckert G. P.; Hooff G. P.; Strandjord D. M.; Igbavboa U.; Volmer D. A.; Muller W. E.; Wood W. G. (2009) Regulation of the brain isoprenoids farnesyl- and geranylgeranylpyrophosphate is altered in male Alzheimer patients. Neurobiol. Dis. 35, 251–257. 10.1016/j.nbd.2009.05.005. [DOI] [PMC free article] [PubMed] [Google Scholar]
- Hooff G. P.; Patel N.; Wood W. G.; Muller W. E.; Eckert G. P.; Volmer D. A. (2010) A rapid and sensitive assay for determining human brain levels of farnesyl-(FPP) and geranylgeranylpyrophosphate (GGPP) and transferase activities using UHPLC-MS/MS. Anal. Bioanal. Chem. 398, 1801–1808. 10.1007/s00216-010-4088-7. [DOI] [PubMed] [Google Scholar]
- Hooff G. P.; Volmer D. A.; Wood W. G.; Muller W. E.; Eckert G. P. (2008) Isoprenoid quantitation in human brain tissue: a validated HPLC-fluorescence detection method for endogenous farnesyl- (FPP) and geranylgeranylpyrophosphate (GGPP). Anal. Bioanal. Chem. 392, 673–680. 10.1007/s00216-008-2306-3. [DOI] [PMC free article] [PubMed] [Google Scholar]
- Mans R. A.; McMahon L. L.; Li L. (2012) Simvastatin-mediated enhancement of long-term potentiation is driven by farnesyl-pyrophosphate depletion and inhibition of farnesylation. Neuroscience 202, 1–9. 10.1016/j.neuroscience.2011.12.007. [DOI] [PMC free article] [PubMed] [Google Scholar]
- Li L.; Cao D.; Kim H.; Lester R.; Fukuchi K. (2006) Simvastatin enhances learning and memory independent of amyloid load in mice. Ann. Neurol. 60, 729–739. 10.1002/ana.21053. [DOI] [PubMed] [Google Scholar]
- Benetka W.; Koranda M.; Maurer-Stroh S.; Pittner F.; Eisenhaber F. (2006) Farnesylation or geranylgeranylation? Efficient assays for testing protein prenylation in vitro and in vivo. BMC Biochem. 7, 6. 10.1186/1471-2091-7-6. [DOI] [PMC free article] [PubMed] [Google Scholar]
- Berndt N.; Sebti S. M. (2011) Measurement of protein farnesylation and geranylgeranylation in vitro, in cultured cells and in biopsies, and the effects of prenyl transferase inhibitors. Nat. Protoc. 6, 1775–1791. 10.1038/nprot.2011.387. [DOI] [PMC free article] [PubMed] [Google Scholar]
- Schmidt R. A.; Schneider C. J.; Glomset J. A. (1984) Evidence for post-translational incorporation of a product of mevalonic acid into Swiss 3T3 cell proteins. J. Biol. Chem. 259, 10175–10180. [PubMed] [Google Scholar]
- Onono F.; Subramanian T.; Sunkara M.; Subramanian K. L.; Spielmann H. P.; Morris A. J. (2013) Efficient use of exogenous isoprenols for protein isoprenylation by MDA-MB-231 cells Is regulated independently of the mevalonate pathway. J. Biol. Chem. 288, 27444–27455. 10.1074/jbc.M113.482307. [DOI] [PMC free article] [PubMed] [Google Scholar]
- Kho Y.; Kim S. C.; Jiang C.; Barma D.; Kwon S. W.; Cheng J.; Jaunbergs J.; Weinbaum C.; Tamanoi F.; Falck J.; Zhao Y. (2004) A tagging-via-substrate technology for detection and proteomics of farnesylated proteins. Proc. Natl. Acad. Sci. U. S. A. 101, 12479–12484. 10.1073/pnas.0403413101. [DOI] [PMC free article] [PubMed] [Google Scholar]
- Berry A. F. H.; Heal W. P.; Tarafder A. K.; Tolmachova T.; Baron R. A.; Seabra M. C.; Tate E. W. (2010) Rapid multilabel detection of geranylgeranylated proteins by using bioorthogonal ligation chemistry. ChemBioChem 11, 771–773. 10.1002/cbic.201000087. [DOI] [PubMed] [Google Scholar]
- DeGraw A. J.; Palsuledesai C.; Ochocki J. D.; Dozier J. K.; Lenevich S.; Rashidian M.; Distefano M. D. (2010) Evaluation of alkyne-modified isoprenoids as chemical reporters of protein prenylation. Chem. Biol. Drug Des. 76, 460–471. 10.1111/j.1747-0285.2010.01037.x. [DOI] [PMC free article] [PubMed] [Google Scholar]
- Charron G.; Li M. M. H.; MacDonald M. R.; Hang H. C. (2013) Prenylome profiling reveals S-farnesylation is crucial for membrane targeting and antiviral activity of ZAP long-isoform. Proc. Natl. Acad. Sci. U. S. A. 110, 11085–11090. 10.1073/pnas.1302564110. [DOI] [PMC free article] [PubMed] [Google Scholar]
- Charron G.; Tsou L. K.; Maguire W.; Yount J. S.; Hang H. C. (2011) Alkynyl-farnesol reporters for detection of protein S-prenylation in cells. Mol. BioSyst. 7, 67–73. 10.1039/C0MB00183J. [DOI] [PMC free article] [PubMed] [Google Scholar]
- Chan L. N.; Hart C.; Guo L.; Nyberg T.; Davies B. S. J.; Fong L. G.; Young S. G.; Agnew B. J.; Tamanoi F. (2009) A novel approach to tag and identify geranylgeranylated proteins. Electrophoresis 30, 3598–3606. 10.1002/elps.200900259. [DOI] [PMC free article] [PubMed] [Google Scholar]
- Palsuledesai C. C.; Ochocki J. D.; Markowski T. W.; Distefano M. D. (2014) A combination of metabolic labeling and 2D-DIGE analysis in response to a farnesyltransferase inhibitor facilitates the discovery of new prenylated proteins. Mol. BioSyst. 10, 1094–1103. 10.1039/C3MB70593E. [DOI] [PMC free article] [PubMed] [Google Scholar]
- Nguyen U. T. T.; Guo Z.; Delon C.; Wu Y.; Deraeve C.; Fraenzel B.; Bon R. S.; Blankenfeldt W.; Goody R. S.; Waldmann H.; Wolters D.; Alexandrov K. (2009) Analysis of the eukaryotic prenylome by isoprenoid affinity tagging. Nat. Chem. Biol. 5, 227–235. 10.1038/nchembio.149. [DOI] [PubMed] [Google Scholar]
- Das D.; Tnimov Z.; Nguyen U. n. T. T.; Thimmaiah G.; Lo H.; Abankwa D.; Wu Y.; Goody R. S.; Waldmann H.; Alexandrov K. (2012) Flexible and general synthesis of functionalized phosphoisoprenoids for the study of prenylation in vivo and in vitro. ChemBioChem 13, 674–683. 10.1002/cbic.201100733. [DOI] [PubMed] [Google Scholar]
- Patterson D. M.; Nazarova L. A.; Prescher J. A. (2014) Finding the right (bioorthogonal) chemistry. ACS Chem. Biol. 9, 592–605. 10.1021/cb400828a. [DOI] [PubMed] [Google Scholar]
- Speers A. E.; Cravatt B. F. (2004) Profiling enzyme activities in vivo using click chemistry methods. Chem. Biol. 11, 535–546. 10.1016/j.chembiol.2004.03.012. [DOI] [PubMed] [Google Scholar]
- Duckworth B. P.; Zhang Z.; Hosokawa A.; Distefano M. D. (2007) Selective labeling of proteins by using protein farnesyltransferase. ChemBioChem 8, 98–105. 10.1002/cbic.200600340. [DOI] [PubMed] [Google Scholar]
- Hosokawa A.; Wollack J. W.; Zhang Z. Y.; Chen L.; Barany G.; Distefano M. D. (2007) Evaluation of an alkyne-containing analogue of farnesyl diphosphate as a dual substrate for protein-prenyltransferases. Int. J. Pept. Res. Ther. 13, 345–354. 10.1007/s10989-007-9090-3. [DOI] [Google Scholar]
- Krzysiak A. J.; Rawat D. S.; Scott S. A.; Pais J. E.; Handley M.; Harrison M. L.; Fierke C. A.; Gibbs R. A. (2007) Combinatorial modulation of protein prenylation. ACS Chem. Biol. 2, 385–389. 10.1021/cb700062b. [DOI] [PMC free article] [PubMed] [Google Scholar]
- Cuervo A. M.; Bergamini E.; Brunk U. T.; Droge W.; Ffrench M.; Terman A. (2005) Autophagy and aging: the importance of maintaining ″clean″ cells. Autophagy 1, 131–140. 10.4161/auto.1.3.2017. [DOI] [PubMed] [Google Scholar]
- Wang Y.-C.; Dozier J. K.; Beese L. S.; Distefano M. D. (2014) Rapid analysis of protein farnesyltransferase substrate specificity using peptide libraries and isoprenoid diphosphate analogues. ACS Chem. Biol. 9, 1726–1735. 10.1021/cb5002312. [DOI] [PMC free article] [PubMed] [Google Scholar]
- Jennings B. C.; Danowitz A. M.; Wang Y.-C.; Gibbs R. A.; Distefano M. D.; Fierke C. A. (2016) Analogs of farnesyl diphosphate alter CaaX substrate specificity and reactions rates of protein farnesyltransferase. Bioorg. Med. Chem. Lett. 26, 1333–1336. 10.1016/j.bmcl.2015.12.079. [DOI] [PMC free article] [PubMed] [Google Scholar]
- Tong H.; Holstein S. A.; Hohl R. J. (2005) Simultaneous determination of farnesyl and geranylgeranyl pyrophosphate levels in cultured cells. Anal. Biochem. 336, 51–59. 10.1016/j.ab.2004.09.024. [DOI] [PubMed] [Google Scholar]
- Jamur M. C.; Oliver C. (2010) Permeabilization of cell membranes. Methods Mol. Biol. 588, 63–66. 10.1007/978-1-59745-324-0_9. [DOI] [PubMed] [Google Scholar]
- Hofmann K.; Thiele C.; Schott H.; Gaebler A.; Schoene M.; Kiver Y.; Friedrichs S.; Lutjohann D.; Kuerschner L. (2014) A novel alkyne cholesterol to trace cellular cholesterol metabolism and localization. J. Lipid Res. 55, 583–591. 10.1194/jlr.D044727. [DOI] [PMC free article] [PubMed] [Google Scholar]
- Haberkant P.; Raijmakers R.; Wildwater M.; Sachsenheimer T.; Brugger B.; Maeda K.; Houweling M.; Gavin A.; Schultz C.; van Meer G.; Heck A.; Holthuis J. (2013) In vivo profiling and visualization of cellular protein-lipid interactions using bifunctional fatty acids. Angew. Chem., Int. Ed. 52, 4033–4038. 10.1002/anie.201210178. [DOI] [PubMed] [Google Scholar]
- Wright L. P.; Philips M. R. (2006) Thematic review series: lipid posttranslational modifications. CAAX modification and membrane targeting of Ras. J. Lipid Res. 47, 883–891. 10.1194/jlr.R600004-JLR200. [DOI] [PubMed] [Google Scholar]
- Keller P. J.; Fiordalisi J. J.; Berzat A. C.; Cox A. D. (2005) Visual monitoring of post-translational lipid modifications using EGFP-GTPase probes in live cells. Methods 37, 131–137. 10.1016/j.ymeth.2005.05.023. [DOI] [PubMed] [Google Scholar]
- Ali B. R.; Nouvel I.; Leung K. F.; Hume A. N.; Seabra M. C. (2010) A novel statin-mediated “prenylation block-and-release” assay provides insight into the membrane targeting mechanisms of small GTPases. Biochem. Biophys. Res. Commun. 397, 34–41. 10.1016/j.bbrc.2010.05.045. [DOI] [PMC free article] [PubMed] [Google Scholar]
- Choy E.; Philips M. (2001) Green fluorescent protein-tagged ras proteins for intracellular localization. Methods Enzymol. 332, 50–64. 10.1016/S0076-6879(01)32191-2. [DOI] [PubMed] [Google Scholar]
- Crick D. C.; Andres D. A.; Waechter C. J. (1995) Farnesol is utilized for protein isoprenylation and the biosynthesis of cholesterol in mammalian cells. Biochem. Biophys. Res. Commun. 211, 590–599. 10.1006/bbrc.1995.1854. [DOI] [PubMed] [Google Scholar]
- Vigil D.; Cherfils J.; Rossman K. L.; Der C. J. (2010) Ras superfamily GEFs and GAPs: validated and tractable targets for cancer therapy?. Nat. Rev. Cancer 10, 842–857. 10.1038/nrc2960. [DOI] [PMC free article] [PubMed] [Google Scholar]
- Pompliano D. L.; Schaber M. D.; Mosser S. D.; Omer C. A.; Shafer J. A.; Gibbs J. B. (1993) Isoprenoid diphosphate utilization by recombinant human farnesyl-protein transferase - interactive binding between substrates and a preferred kinetic pathway. Biochemistry 32, 8341–8347. 10.1021/bi00083a038. [DOI] [PubMed] [Google Scholar]
- Hougland J. L.; Hicks K. A.; Hartman H. L.; Kelly R. A.; Watt T. J.; Fierke C. A. (2010) Identification of novel peptide substrates for protein farnesyltransferase reveals two substrate classes with distinct sequence selectivities. J. Mol. Biol. 395, 176–190. 10.1016/j.jmb.2009.10.038. [DOI] [PMC free article] [PubMed] [Google Scholar]
- Zaro B. W.; Chuh K. N.; Pratt M. R. (2014) Chemical Reporter for Visualizing Metabolic Cross-Talk between Carbohydrate Metabolism and Protein Modification. ACS Chem. Biol. 9, 1991–1996. 10.1021/cb5005564. [DOI] [PMC free article] [PubMed] [Google Scholar]
- Lipinski M. M.; Zheng B.; Lu T.; Yan Z.; Py B. F.; Ng A.; Xavier R. J.; Li C.; Yankner B. A.; Scherzer C. R.; Yuan J. (2010) Genome-wide analysis reveals mechanisms modulating autophagy in normal brain aging and in Alzheimer’s disease. Proc. Natl. Acad. Sci. U. S. A. 107, 14164–14169. 10.1073/pnas.1009485107. [DOI] [PMC free article] [PubMed] [Google Scholar]
- Janda E.; Isidoro C.; Carresi C.; Mollace V. (2012) Defective autophagy in Parkinson’s disease: role of oxidative stress. Mol. Neurobiol. 46, 639–661. 10.1007/s12035-012-8318-1. [DOI] [PubMed] [Google Scholar]
- Pickford F.; Masliah E.; Britschgi M.; Lucin K.; Narasimhan R.; Jaeger P. A.; Small S.; Spencer B.; Rockenstein E.; Levine B.; Wyss-Coray T. (2008) The autophagy-related protein beclin 1 shows reduced expression in early Alzheimer disease and regulates amyloid-β accumulation in mice. J. Clin. Invest. 118, 2190–2199. 10.1172/JCI33585. [DOI] [PMC free article] [PubMed] [Google Scholar]
- Rubinsztein D. C.; DiFiglia M.; Heintz N.; Nixon R. A.; Qin Z. H.; Ravikumar B.; Stefanis L.; Tolkovsky A. (2005) Autophagy and its possible roles in nervous system diseases, damage and repair. Autophagy 1, 11–22. 10.4161/auto.1.1.1513. [DOI] [PubMed] [Google Scholar]
- Mizushima N.; Levine B. (2010) Autophagy in mammalian development and differentiation. Nat. Cell Biol. 12, 823–830. 10.1038/ncb0910-823. [DOI] [PMC free article] [PubMed] [Google Scholar]
- Xing S.; Zhang Y.; Li J.; Zhang J.; Li Y.; Dang C.; Li C.; Fan Y.; Yu J.; Pei Z.; Zeng J. (2012) Beclin 1 knockdown inhibits autophagic activation and prevents the secondary neurodegenerative damage in the ipsilateral thalamus following focal cerebral infarction. Autophagy 8, 63–76. 10.4161/auto.8.1.18217. [DOI] [PubMed] [Google Scholar]
- Hung S. Y.; Huang W. P.; Liou H. C.; Fu W. M. (2009) Autophagy protects neuron from Abeta-induced cytotoxicity. Autophagy 5, 502–510. 10.4161/auto.5.4.8096. [DOI] [PubMed] [Google Scholar]
- Wasko B. M.; Dudakovic A.; Hohl R. J. (2011) Bisphosphonates induce autophagy by depleting geranylgeranyl diphosphate. J. Pharmacol. Exp. Ther. 337, 540–546. 10.1124/jpet.110.175521. [DOI] [PubMed] [Google Scholar]
- Hooff G. P.; Wood W. G.; Kim J. H.; Igbavboa U.; Ong W. Y.; Muller W. E.; Eckert G. P. (2012) Brain isoprenoids farnesyl pyrophosphate and geranylgeranyl pyrophosphate are increased in aged mice. Mol. Neurobiol. 46, 179–185. 10.1007/s12035-012-8285-6. [DOI] [PubMed] [Google Scholar]
- Grkovic S.; O’Reilly V. C.; Han S.; Hong M.; Baxter R. C.; Firth S. M. (2013) IGFBP-3 binds GRP78, stimulates autophagy and promotes the survival of breast cancer cells exposed to adverse microenvironments. Oncogene 32, 2412–2420. 10.1038/onc.2012.264. [DOI] [PubMed] [Google Scholar]
- Puustinen P.; Rytter A.; Mortensen M.; Kohonen P.; Moreira J. M.; Jäättelä M. (2014) CIP2A oncoprotein controls cell growth and autophagy through mTORC1 activation. J. Cell Biol. 204, 713–727. 10.1083/jcb.201304012. [DOI] [PMC free article] [PubMed] [Google Scholar]
- Zhang J.; Yang Z.; Xie L.; Xu L.; Xu D.; Liu X. (2013) Statins, autophagy and cancer metastasis. Int. J. Biochem. Cell Biol. 45, 745–752. 10.1016/j.biocel.2012.11.001. [DOI] [PubMed] [Google Scholar]
Associated Data
This section collects any data citations, data availability statements, or supplementary materials included in this article.