

Abstract
The incidence of blast-induced mild traumatic brain injury (mTBI) has been rising in US veterans due to the widespread use of improvised explosive devices. Blast-injured veterans report cognitive impairments, collectively termed post-concussive syndrome, similar to ones that follow more severe forms of TBI. These are due to diffuse axonal injury, which disrupts the neuronal cytoskeleton and commonly goes undetected by computed tomography and conventional magnetic resonance imaging (MRI). We looked for cortical function abnormalities in a group of blast mTBI subjects using independent component analysis of resting state functional MRI data, which may be more sensitive to small differences. Resting state networks of 13 mTBI veterans with moderate post-concussive syndrome and 50 control subjects were compared across 3 fMRI domains: blood oxygenation level-dependent spatial maps, time course spectra, and functional connectivity. The mTBI group exhibited hyperactivity in the temporo-parietal junctions and hypoactivity in the left inferior temporal gyrus. Abnormal frequencies in default-mode (DMN), sensorimotor, attentional, and frontal networks were detected. Functional connectivity was disrupted in 6 network pairs: DMN-basal ganglia, attention-sensorimotor, frontal-DMN, attention-sensorimotor, attention-frontal, and sensorimotor-sensorimotor. The results suggest white matter disruption across certain attentional networks and that the temporo-parietal junctions may be compensating for damage in other cortical regions.
Keywords: Blast, Mild Traumatic Brain Injury (mTBI), Resting State Networks (RSN), Independent Component Analysis (ICA), Functional Magnetic Resonance Imaging (fMRI), Cognition
Introduction
The annual incidence of traumatic brain injury (TBI) in the United States has been estimated at 1.4 million, accounting for one third of all injury related deaths [1]. With two ongoing wars, the incidence of head injuries in the US armed forces has been on the rise. While US troops deployed in Iraq and Afghanistan today wear some of the most advanced armor in the world, improving their survivability dramatically, the rates of other non-fatal, yet debilitating, injuries have risen [2]. Due to the widespread use of improvised explosive devices by Iraqi and Afghani combatants, the rate of TBI has been especially elevated in US troops.
Most veterans who have come in close proximity to explosions report cognitive impairments that are similar to those caused by more direct mechanisms of TBI, such as difficulty with concentration, memory, and mood [3, 4]. These symptoms collectively define post-concussive syndrome (PCS) [5], which in turn has been found to overlap significantly with post-traumatic stress disorder (PTSD) [6]. Post-concussive symptoms (e.g., cognitive, affective, physical, social) persist in over a third of veterans diagnosed with mild TBI (mTBI) [7]. Due to the high comorbidity of mTBI and PTSD and the similarity in certain of their clinical symptoms in the definition of PCS, it has been argued that PCS may not only be directly caused by mTBI, but sometimes misdiagnosed as PTSD resulting from the traumatic event of being near an explosion itself [8]. Meares and colleagues suggested that PCS is not specific to head injury at all, but can occur following any traumatic injury [9]. Consequently, soldiers who have sustained mTBI can sometimes be mistakenly diagnosed with PTSD, and vice versa [6, 8]. Given their potential ability to discriminate between these two factors, neuroimaging studies on blast-induced trauma provide invaluable insight into understanding and diagnosing mTBI.
Advanced neuroimaging techniques have the potential to illuminate the structural and functional changes in brain that contribute to mTBI symptoms. Mild TBI mainly disrupts the brain’s neuronal cytoskeleton on a microscopic level, resulting in diffuse axonal injury (DAI) [10] and no large-scale tissue disruptions [11]. To date, however, DAI commonly goes undetected by computed tomography and conventional magnetic resonance imaging [12, 13, 14]. The damage to white matter neuronal fibers resulting from DAI can alter the tightly bundled tracts and decrease their ability to restrict water diffusion to the long axis of fiber track direction. Diffusion-weighted imaging (DWI) and diffusion tensor imaging (DTI) techniques have been used to detect the fractional anisotropy decreases due to this loss of structural organization in DAI patients [15, 16, 11, 17]. However, the technique is most useful in detecting diffuse axonal injury in the first 24 hours following injury and the diffusion anisotropy decrease becomes less apparent after a month [18]. Additionally, while DTI can point to areas that have sustained structural damage, it is of little help in localizing regions of affected brain activity that suffered neuronal deafferentation. Thus, other sensitive imaging methods are needed to supplement DTI data in order to provide a more complete picture of mTBI’s effect on brain structure and function.
In a case study of one blast mTBI subject, Huang and colleagues used magnetoencephalographic imaging coupled with DTI to find abnormal low frequency delta wave activity in multiple regions of the left hemisphere: dorsolateral prefrontal cortex (DLPFC), middle frontal gyrus (MFG), orbital frontal cortex (OFC), anterior cingulate cortex (ACC), and temporo-parietal junction (TPJ) regions [19]. In addition, the right hemisphere also exhibited delta wave activity in the MFG and the ventrolateral prefrontal cortex (VLPFC). The subject’s DTI data showed a thinner bilateral superior longitudinal fasciculus (SLF) in the mTBI subjects relative to controls. These results provided insight into specific areas of neuronal deafferentation in the cortex due to the damage of white matter tracts caused by blast injury. In an attempt to detect such cortical abnormalities in a group of blast mTBI subjects, we utilized independent component analysis (ICA) [20] of resting state fMRI data, which may be more sensitive to small individual differences than conventional fMRI analyses [21].
The aggregate blood oxygenation level-dependent (BOLD) signal observed by the functional magnetic resonance imaging (fMRI) technique is formed by a combination of multiple signals from their respective locations, with each location having a unique fluctuation in activity over time [22]. The temporal correlations between multiple regions can be examined using ICA, producing a set of independent components with high intrinsic temporal coherences. Independent component analysis separates the aggregate BOLD signal into its components using blind signal separation. One advantage of this method is that it is data-driven, and an a priori behavioural model is not needed [23]. Three domains of fMRI data can be examined using ICA: spatial maps, functional network connectivity (FNC), and time course spectra. We hypothesized abnormalities within intrinsic networks across all three domains in patients with blast mTBI compared to control subjects.
Methods
Seventeen male veterans were recruited through the Veterans Affairs Hospital. All of the subjects were diagnosed with mTBI following their deployment. Participants who indicated having no blast wave exposure were not eligible for the study. None of the subjects had been diagnosed with PTSD associated with their service-related injuries. Thirteen male veterans (age = 34.3 years, SD = 6.6 years) qualified for participation (table 1). The control group consisted of 50 healthy male subjects (age = 29.7 years, SD = 8.4 years) with no history of head injuries or substance abuse, whose fMRI data was obtained from the resting state ICA study by Allen and colleagues [24].
Table 1.
Blast-induced mTBI group summary. Blast directions were classified as roughly originating either from the front/back or left/right of the subjects’ heads. Only 3 subjects reported the explosions at their sides. Loss of consciousness (LOC) occurred in all but 3 subjects. Five subjects have had more than 1 blast encounter throughout deployment.
| Subject | Age | Direction | LOC | Blasts |
|---|---|---|---|---|
| 1 | 53 | Front/Back | No | 1 |
| 2 | 30 | Side | Yes | 1 |
| 3 | 35 | Front/Back | Yes | 1 |
| 4 | 39 | Front/Back | Yes | 2 |
| 5 | 38 | Front/Back | Yes | 1 |
| 6 | 36 | Side | Yes | 3 |
| 7 | 32 | Front/Back | Yes | 1 |
| 8 | 33 | Side | No | 3 |
| 9 | 30 | Front/Back | Yes | 2 |
| 10 | 31 | Front/Back | Yes | 1 |
| 11 | 29 | Front/Back | Yes | 1 |
| 12 | 33 | Front/Back | Yes | 1 |
| 13 | 27 | Front/Back | No | 2 |
The following neuropsychological tests were administered to the TBI subjects by a trained neuropsychologist: California Verbal Learning Test II (CVLT-II) [25], Wisconsin Card Sorting Test (WCST) [26], Neurobehavioural Symptom Inventory (NSI) [27], Beck Depression Inventory II (BDI-II) [28], Digit Span (DS), Digit Symbol Test, Trail Making Test A (numbers only; TMT-A), Trail Making Test B (numbers and letters; TMT-B), Paced Auditory Serial Addition Test (PASAT), Wechsler Test of Adult Reading (WTAR), Controlled Oral Word Association Test (COWAT), and Stroop Test (ST) [29].
The mTBI group’s fMRI data was acquired using a 3-Tesla Siemens Trio scanner at the Mind Research Network (MRN), Albuquerque, NM. T2*-weighed functional images were acquired using a gradient-echo echo planar imaging (EPI) sequence with the following parameters: echo time (TE) = 29 milliseconds (ms), repetition time (TR) = 2 seconds, flip angle = 75°, slice thickness = 3.5 millimeters (mm), distance factor = 30%, field of view = 240 mm, matrix size = 64 × 64 voxels, voxel size = 3.8 millimeters (mm) × 3.8 mm × 3.5 mm. Resting-state scans were 5 min, 34 s (167 volumes total). During the fMRI sequence, participants were instructed to fixate their eyes on the crosshairs presented on the screen in front of them, relax, and think of nothing in particular while keeping their eyes open. Control subjects’ T2*- weighted functional images were acquired using the same parameters as the TBI group, with the exception of more volumes being collected [24]. The first 150 volumes from both groups were analysed. Subjects’ translation and rotation in the scanner were estimated by the motion correction algorithm, and subjects whose average translation exceeded one voxel (3 mm) were to be excluded from the analysis.
Maximally independent whole-head spatial maps and time courses, which summarize the underlying BOLD signal, are the output of the multivariate ICA algorithm. The group ICA process produces single subject maps and time courses, which can then be tested for differences that exist between groups. The ICA package used here, called the Group ICA fMRI Toolbox (GIFT; http://mialab.mrn.org/software), examines three main aspects of the ICA components, including the voxel-wise weights for each component image, the spectral power of each ICA time course at a given frequency bin, and the cross-correlation among ICA time courses (FNC). Comparison of spatial BOLD activation maps can reveal differences in the sizes of individual intrinsic networks. The time course spectra analysis allows examination of any differences in power of specific signal frequencies between groups. This has the potential to point toward abnormalities in certain ICs, as previous literature suggests that certain disorders, such as schizophrenia, have frequency patterns that are significantly different from those observed in healthy controls [30, 31]. Components’ frequency ranges also serve as tools for distinguishing functional independent components of interest from those formed by noise, with large high-low frequency ratios and large dynamic ranges being present in functional ICs [24]. Differences in FNC are potentially of great importance as well, pointing to the connectivity between specific pairs of networks that may be functionally disrupted by injuries or disorders [32]. Any affected connections found by FNC analysis have the potential to explain certain cognitive impairments observed in TBI patients and warrant focused examinations of specific white matter tracts underlying these regions that may be compromised due to the injury using techniques such as DTI. ICA, therefore, has the potential to reveal information not previously detected by conventional fMRI analyses. Extensive information on group ICA has been presented in [33] and [34], and an application of group ICA to a large resting fMRI study is presented in [24].
The functional and structural data were preprocessed by an automated pipeline developed at MRN [35, 36], which was described in further detail in [24]. The fMRI data were then split into intrinsic networks using ICA with GIFT. Listed here are the parameters that were specified in GIFT to analyse the data. Seventy-five components were estimated from the data. Data were first scaled to a mean voxel value of 100 (intensity-normalized), and a two-stage principle component process was used to extract 100 principle components (PCs) from each subject and 75 PCs from the aggregate data. The Infomax ICA algorithm [20] was then run 10 times using the built-in ICASSO tool, which is used to estimate the reliability of ICs [37]. Resting state networks for multivariate analysis were qualitatively chosen out of the resulting components to match the networks identified using the GIFT software in [24].
Using the MANCOVAN tool in the GIFT software, multivariate analysis was performed on the isolated resting state networks to examine the effect of group (mTBI/Control) at α = 0.05 on BOLD signal, time course spectra, and FNC (see [24] for more details on the MANCOVAN approach). In addition to age, two variables of head motion in the scanner, translation in log (mm) and rotation log (degrees), were used as the covariates.
Results
The structural MR Images did not show evidence of visible structural damage and were read as normal by a radiologist. Every effort was made to use subjects with blast-only injuries and eliminate any other confounding head injuries. The subjects, therefore, were representative of the target group of interest. The circumstances of each participant’s injury are summarized in table 1. A trending difference in age between the mTBI and control groups was apparent upon completion of data collection. This difference did not reach statistical significance (t (61) = 1.84, p = 0.07). Due to this trend, however, age was used as a covariate in the fMRI data analysis.
The collected Neurobehavioural Symptom Inventory and Beck Depression Inventory II data classified the mTBI group as having moderate-to-severe post-concussive symptoms and moderate depression, respectively. The obtained scores are presented in table 2 and were used to classify the levels of post-concussive symptoms and depression according to their manuals, respectively [27, 28]. Individual t-scaled performances across all of the neuropsychological tests in the mTBI group formed a normal distribution (mean = 44.1, SD = 6.5; figure 1). TBI patient’s averaged overall performance across all tests was significantly lower than the normal population’s average performance of 50 on the t-scale (t (12) = 2.64, p = 0.022; figure 1). mTBI subjects’ scores across the neuropsychological battery revealed significant impairments in attention and processing speed (table 2). Specifically, performances on the symbol search, digit symbol test, and trail making (numbers only) were significantly affected (table 2). Intelligence, verbal fluency, memory, and executive function were not significantly different from the normal population’s mean (table 2).
Table 2.
Neuropsychological examination summary for mTBI group. Mild TBI subjects as a group reported moderate depression and post-concussive symptoms. General intelligence, verbal fluency, memory function, and executive function did not differ significantly from the expected population mean. The neuropsychological domains that were significantly impaired in the mTBI group were attention and processing speed.
| Function | Test | Mean ± SE | T-score | p |
|---|---|---|---|---|
| PCS | NSI | 2.42 ± 0.22 | N/A Moderate | N/A |
| Depression | BDI-II | 24.92 ± 3.73 | N/A Moderate | N/A |
| Intelligence | WTAR | 51.70 ± 2.50 | 0.68 | 0.511 |
| Verbal Fluency | COWAT | 45.39 ± 2.24 | 2.06 | 0.061 |
| Memory | CVLT-II Short Delay | 45.69 ± 4.27 | 1.01 | 0.333 |
| Memory | CVLT-II Long Delay | 46.00 ± 3.84 | 1.04 | 0.319 |
| Executive | Digit Span Composite | 47.00 ± 2.09 | 1.44 | 0.176 |
| Executive | WCST | 45.00 ± 2.89 | 1.73 | 0.109 |
| Executive | Stroop | 50.69 ± 1.69 | 0.41 | 0.688 |
| Executive | TMT-B | 44.85 ± 2.78 | 1.85 | 0.089 |
| Attention | TMT-A | 41.31 ± 2.83 | 3.07 | 0.010 |
| Attention | PASAT | 53.20 ± 2.41 | 1.33 | 0.209 |
| Processing Speed | Digit Symbol | 40.23 ± 1.94 | 5.03 | <0.001 |
| Processing Speed | Symbol Search | 42.39 ± 2.12 | 3.59 | 0.004 |
Figure 1.
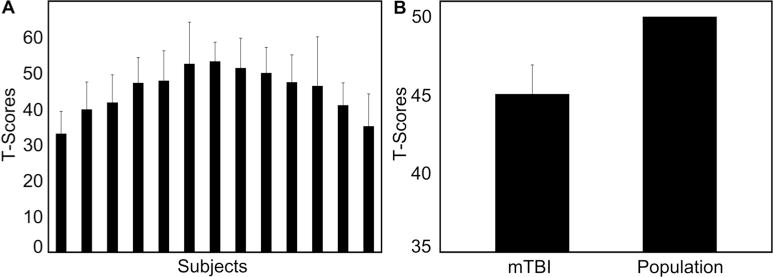
Mild TBI Group’s Neuropsychological Results. A. Individual overall performances of mTBI subjects across all neuropsychological tests. B. Mild TBI group performance across all neuropsychological tests compared to the normal population’s t = 50. The mTBI group’s average performance on the neuropsychological battery was significantly lower than the expected mean of the general population. This result was driven by the trail making, symbol encoding, and symbol search scores, as summarized in Table 2.
Subjects’ average motion during imaging scans was within the acceptable range of less than 1 voxel (3 mm) of translation. No subjects were excluded for excessive motion in the MR scanner, with the largest average translation being 2.10 mm and the largest degree of rotation being 1.02 degrees.
Twenty-eight resting-state networks were identified in the 75 components produced by GIFT, all of which closely matched the reference networks found in [24] (http://mialab.mrn.org/data). The final set included 6 sensorimotor, 6 attention, 6 visual, 4 frontal, 4 default-mode (DMN), auditory, and the basal ganglia networks. The resulting set of components averaged across all 63 subjects is presented in figure 2. Figure 6 shows the FNC matrices of the 28 components for the mTBI and control groups separately, as well as the significant differences between the two.
Figure 2.
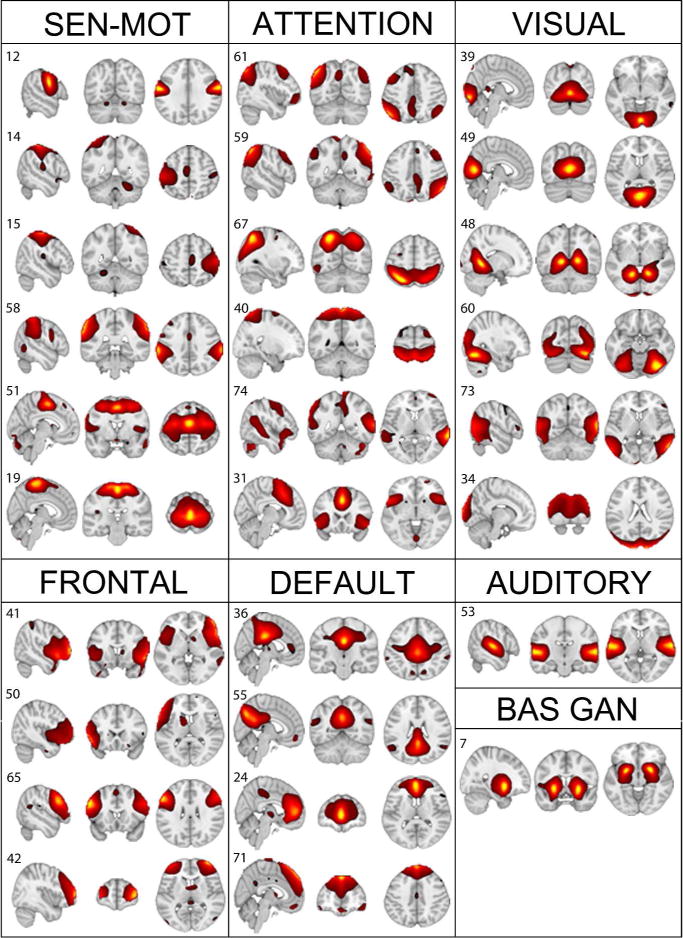
Identified resting state networks. A t-map covering the entire head was generated for every network. For illustration purposes, the above networks display the t values of tcomponent > μcomponent +4σ component. Six sensorimotor (sen-mot), 6 attentional, 6 visual, 4 frontal, 4 default-mode, 1 auditory, and the basal ganglia (bas gan) networks were identified using the networks identified in Allen et al., 2011 as a reference. All further analyses were performed on the above resting state networks.
Figure 6.
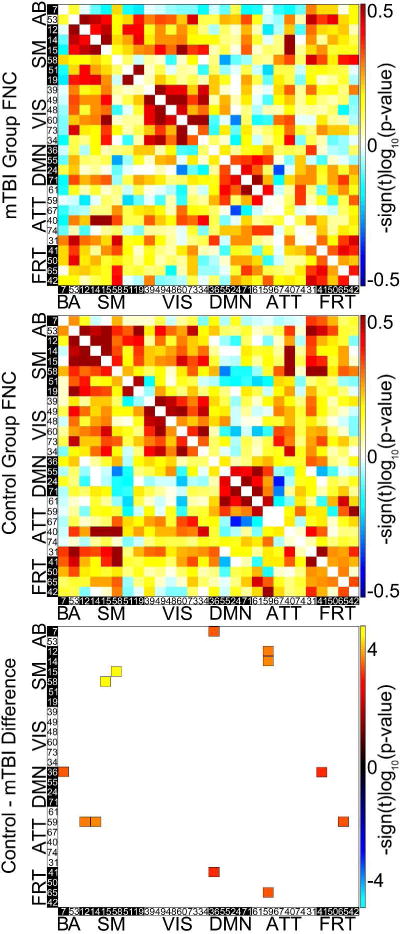
Functional Network Connectivity Results. The top matrix presents the connection strength of each of the 28 resting state networks with every other RSN network in the mTBI group. The matrix in the middle presents an analogous matrix for the control group. The matrix on the bottom shows the significant differences in FNC between the two groups (α = 0.05). Six pairs of networks (36-7 (DMN-basal ganglia), 59-12 (attention-sensorimotor), 41-36 (frontal-DMN), 59-14 (attention-sensorimotor), 59-65 (attention-frontal), 58-15(sensorimotor-sensorimotor) had significantly lower functional connectivities in mTBI subjects than in controls (α = .05).
Multivariate analysis revealed significant effects on spatial maps in multiple intrinsic networks (figure 3). Effects on time course spectra and FNC were also detected. Univariate analysis identified significant spatial map differences between mTBI and control groups in components 50 (frontal) and 73 (visual), with specific locations and effect sizes presented in figure 4. Mild TBI subjects had higher activity in bilateral temporo-parietal junctions and lower activity in the left inferior temporal lobe relative to controls. Time course spectra were significantly different between groups in components 31 (attention), 65 (frontal), and 71 (DMN; figure 5). Functional connections in the mTBI group had significantly weaker connections than controls in the following network pairs: 36-7 (DMN-basal ganglia), 59-12 (attention-sensorimotor), 41-36 (frontal-DMN), 59-14 (attention-sensorimotor), 59-65 (attention-frontal), 58-15(sensorimotor-sensorimotor; figure 6).
Figure 3.
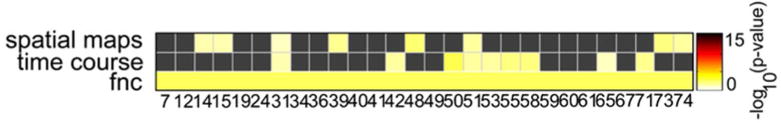
Multivariate Effects of Group. Group had an effect on all three of the examined domains: spatial maps, time course spectra, and functional network connectivity (FNC). Multiple components were affected in each domain, with the yellow bins representing networks in which significant effects were observed at α = 0.05. The observed widespread effect provided grounds to examine the univariate effects of group on each individual component in each examined domain.
Figure 4.
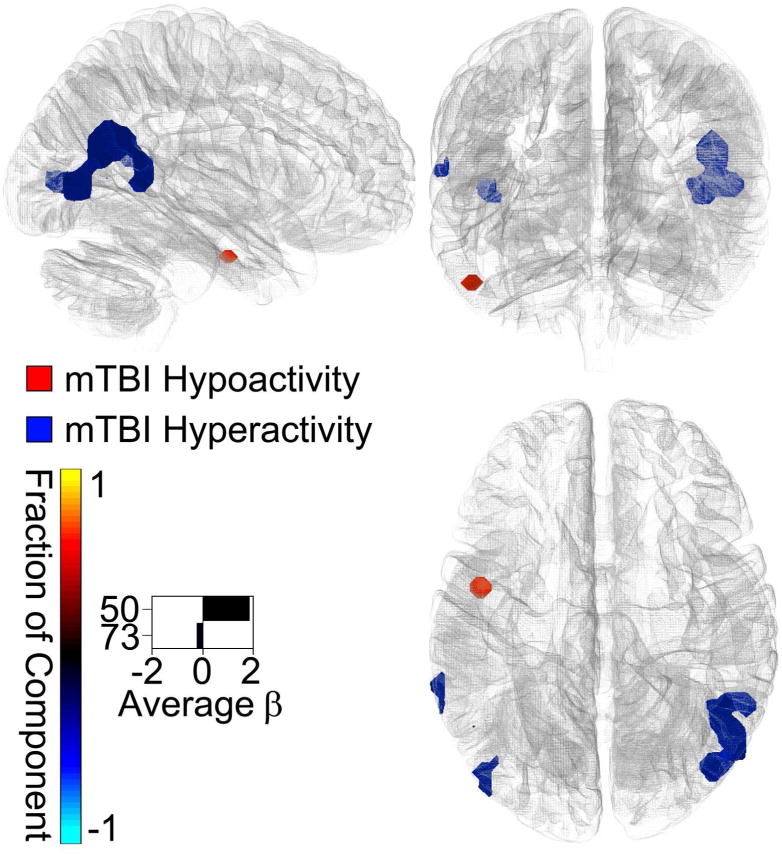
Spatial Map Results. The significant BOLD signal differences (α = 0.05) between the mTBI and control groups (control - mTBI) are plotted on the Montreal Neurological Institute brain in blue (mTBI > Control) and red (Control > mTBI). The mTBI group displayed a higher activity in the temporo-parietal junctions, while the control group had elevated activity in the left inferior temporal lobe. The effect sizes (betas) are indicated by the lengths of the bars on the bottom left. The directions of the bars indicate which group had higher activity (control - mTBI). The colours of the bars indicate the fractions of the total respective component volumes that were affected. The areas affected by group, therefore, were small fractions of visual network 73 and frontal network 50.
Figure 5.
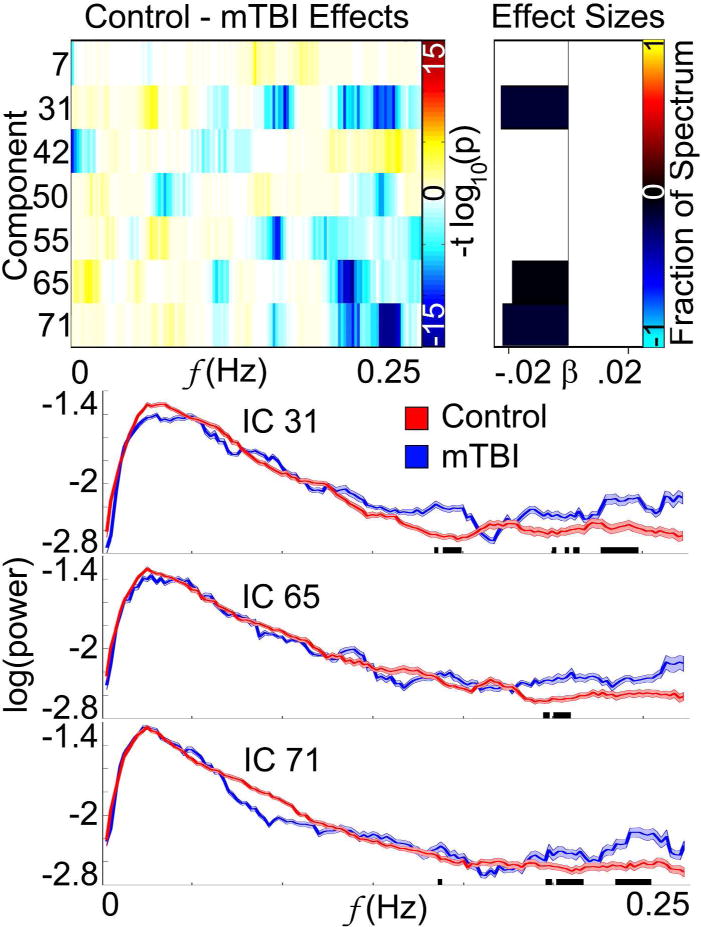
Time Course Spectra Results. The figure on the top-left shows the frequencies in components that were affected by group according to multivariate results. The bars to the right represent the effect sizes via their length, and the colours of the bars indicate the fraction of each spectrum that was affected. Univariate results found only three components that were affected by group, with the mTBI group having significantly elevated high frequency activities in components 31, 65, and 71 (α = 0.05). The time course spectra for each individual affected network are plotted on the lower half of the figure. The black bars at the bottom of the plots indicate the frequency bins in which the difference between the two groups reached statistical significance.
Discussion
We have identified multiple intrinsic networks that show significant differences between mTBI blast injury subjects and control groups across the three examined fMRI domains. The spatial map findings are interesting in demonstrating that the mTBI group exhibited hyperactivity in the temporo-parietal junctions. Previously published simulation studies by our group have shown that blast waves traveling through the cranium may create maximum shear stresses that tend to be diffusely elevated in the posterior section of the brain [38]. The cerebellum, vermis, pons, and medial temporal lobe (MTL) have previously been shown to have decreased metabolic rates of glucose in blast-induced mTBI subjects [39]. In addition, as mentioned previously, the left DLPFC, MFG, OFC, TPJ, and ACC regions, along with the right VLPFC and MFG areas, exhibited slow delta wave activity in one patient, possibly caused by neuronal deafferentation due to the damage of white matter fiber tracts in the SLF following blast exposure [19].
The FNC results are consistent with the cognitive impairments in attention and processing speed revealed by neuropsychological testing. Attentional network 59 had impaired connectivities with three of the other examined networks. The connectivities of two frontal networks 41 and 65, as well as DMN 36 were also negatively affected. Such disruptions in the DMN connectivities could potentially contribute to the observed attentional and processing speed deficits by not activating entirely or lagging in activation when required by other cortical areas. It is possible that the disrupted connectivities with the frontal networks are due to the damage in the SLF. Simultaneous ICA studies using fMRI of DMN as well as ICA of DTI may assist in providing more mechanistic linkage between such structure-function relationships.
The regions of increased activity within bilateral TPJ in subjects with mTBI are of interest, given the well-established role of these regions in sustained attention and vigilance [40]. More specifically, the right TPJ has been implicated in the salience of external stimuli, with those events with high behavioural relevance being able to interrupt ongoing cognition to actuate behavioural responses accordingly [41]. This ‘circuit breaking’ characteristic of the TPJ could be seen as an adaptive response to situations where environmental threats might be high. As exposure to trauma of any sort is associated with behavioural symptoms of increased vigilance, the extreme manifestation of which can be found in PTSD [9], it is plausible that upregulation of this ‘vigilance network’ in the brain would occur in patients exposed to unexpected blast injury. Previous studies have shown positive coupling between right TPJ and other brain regions including left TPJ, bilateral inferior frontal lobe, and precuneus during attention grabbing events presented in virtual environmental videos [42]. While speculative, it is possible that increased activation of right hemisphere vigilance networks in our cohort was associated with a corresponding decrease in left ventral pathways associated with object identification. We are unaware of corresponding studies showing inverse coupling of regions within dorsal and ventral pathways during such realistic visual processing scenarios.
One limitation of our study is the difficulty in precisely characterizing the conditions of blast wave exposure, direction, distance and magnitude. Only three of our mTBI subjects encountered blasts to the sides of their heads. Additionally, most subjects were oriented some number of degrees off true frontal or side blast directions. Given this variability in blast directions in our mTBI group, it was difficult to separate them into well-defined groups based on blast direction. Only 3 of the 13 subjects analysed in the present study had no LOC after the injury. Even with LOC, however, most veterans were able to relate remarkable detail about the circumstances of the events that led up to and followed the explosion. Most had recovered from pre-injury amnesia and had been informed of the events in detail by fellow soldiers who witnessed the explosion scenarios.
This is, to our best knowledge, the first study to demonstrate disruptions due to purely blast wave encounters in resting brain function using fMRI. In contrast to the conventional fMRI analysis tools, independent component analysis was able to detect small differences in the three examined domains and present the results in a network-based, comprehensible way. We have presented specific functional brain networks that have been affected along with the corresponding neuropsychological data that reflects such differences. Combined with the white matter disruptions that have been reported in the enormously complex mTBI field, the findings presented here are an important piece of the puzzle that demonstrates how structural damage manifests itself in cortical brain function after blast-related head injuries. We are currently analyzing parallel modeling and simulation studies to investigate how blast-induced pressure and shear waves propagate through the human head and deposit localized energy. The distributions of these shear energy depositions relative to the observed changes in RSN’s will be reported separately.
Acknowledgments
The authors would like to thank Dr. Larry E. Davis for his help in subject recruitment from the Veterans Affairs Hospital, as well as the National Library of Medicine for the use of its Visible Human data.
This work was funded through the U.S. Naval Health Research Center, Office of Naval Research, through project funding manager Mr. James Mackiewicz. Sandia National Laboratories is a multi-program laboratory managed and operated by Sandia Corporation, a wholly owned subsidiary of Lockheed Martin Corporation, for the United States Department of Energy’s National Nuclear Security Administration under contract DE-AC04-94AL85000.
Footnotes
Declaration of Interest
The authors have no conflicts of interest to declare.
Literature Cited
- 1.Traumatic Brain Injury in the US: Emergency Department Visits, Hospitalizations, and Deaths [Internet] Centers for Disease Control and Prevention (US); 2007. May, [cited 2012 Aug 08]. Available from: http://www.cdc.gov/ncipc/pub-res/TBI_in_US_04/TBI_ED.htm. [Google Scholar]
- 2.Okie S. Traumatic brain injury in the war zone. The New England Journal of Medicine. 2005;352:2043–2047. doi: 10.1056/NEJMp058102. [DOI] [PubMed] [Google Scholar]
- 3.Lippa SM, Pastorek NJ, Benge JF, Thornton GM. Postconcussive symptoms after blast and nonblast-related mild traumatic brain injuries in Afghanistan and Iraq war veterans. Journal of the International Neuropsychological Society. 2010;16:856–866. doi: 10.1017/S1355617710000743. [DOI] [PubMed] [Google Scholar]
- 4.Belanger HG, Kretzmer T, Yoash-Gantz R, Pickett T, Tupler LA. Cognitive sequelae of blast-related versus other mechanisms of brain trauma. Journal of the International Neuropsychological Society. 2009;15:1–8. doi: 10.1017/S1355617708090036. [DOI] [PubMed] [Google Scholar]
- 5.Ryan LM, Warden DL. Post concussion syndrome. Int Rev Psychiatry. 2003;15:310–316. doi: 10.1080/09540260310001606692. [DOI] [PubMed] [Google Scholar]
- 6.Hoge CW, McGurk D, Thomas JL, Cox AL, Engel CC, Castro CA. Mild traumatic brain injury in US soldiers returning from Iraq. The New England Journal of Medicine. 2008;358:453–463. doi: 10.1056/NEJMoa072972. [DOI] [PubMed] [Google Scholar]
- 7.Schneiderman AI, Braver ER, Kang HK. Understanding sequelae of injury mechanisms and mild traumatic brain injury incurred during the conflicts in Iraq and Afghanistan: persistent postconcussive symptoms and posttraumatic stress disorder. American Journal of Epidemiology. 2008;167:1446–1452. doi: 10.1093/aje/kwn068. [DOI] [PubMed] [Google Scholar]
- 8.Ling G, Bandak F, Armonda R, Grant G, Ecklund J. Explosive Blast Neurotrauma. Journal of Neurotrauma. 2007;26:815–825. doi: 10.1089/neu.2007.0484. [DOI] [PubMed] [Google Scholar]
- 9.Meares S, Shores EA, Taylor AJ, Batchelor J, Bryant RA, Baguley IJ, Chapman J, Gurka J, Dawson K, Capon L, Marosszeky JE. Mild traumatic brain injury does not predict acute postconcussion syndrome. Journal of Neurology, Neurosurgery & Psychiatry. 2008;79:300–306. doi: 10.1136/jnnp.2007.126565. [DOI] [PubMed] [Google Scholar]
- 10.Strich SJ. Diffuse degeneration of the cerebral white matter in severe dementia following head injury. Journal of Neurology, Neurosurgery & Psychiatry. 1956;19:163–185. doi: 10.1136/jnnp.19.3.163. [DOI] [PMC free article] [PubMed] [Google Scholar]
- 11.Huisman TAGM, Sorensen AG, Hergan K, Gonzalez RG, Schaefer PW. Diffusion-weighted imaging for the evaluation of diffuse axonal injury in closed head injury. Journal of Computer Assisted Tomography. 2003;27:5–11. doi: 10.1097/00004728-200301000-00002. [DOI] [PubMed] [Google Scholar]
- 12.Belanger HG, Vanderploeg RD, Curtiss G, Warden DL. Recent Neuroimaging Techniques in Mild Traumatic Brain Injury. The Journal of Neuropsychiatry and Clinical Neurosciences. 2007;19:5–20. doi: 10.1176/jnp.2007.19.1.5. [DOI] [PubMed] [Google Scholar]
- 13.Mittl RL, Grossman RI, Hiehle JF, Hurst RW, Kauder DR, Gennarelli TA, Alburger GW. Prevalence of MR Evidence of Diffuse Axonal Injury in Patients with Mild Head-Injury and Normal Head Ct Findings. American Journal of Neuroradiology. 1994;15:1583–1589. [PMC free article] [PubMed] [Google Scholar]
- 14.Hammoud DA, Wasserman BA. Diffuse axonal injuries: pathophysiology and imaging. Neuroimaging Clinics of North America. 2002;12:205–216. doi: 10.1016/s1052-5149(02)00011-4. [DOI] [PubMed] [Google Scholar]
- 15.Inglese M, Makani S, Johnson G, Cohen BA, Silver JA, Gonen O, Grossman RI. Diffuse axonal injury in mild traumatic brain injury: a diffusion tensor imaging study. Journal of Neurosurgery. 2005;103:298–303. doi: 10.3171/jns.2005.103.2.0298. [DOI] [PubMed] [Google Scholar]
- 16.Horsfield MA, Jones DK. Applications of diffusion-weighted and diffusion tensor MRI to white matter diseases – a review. NMR in Biomedicine. 2002;15:570–577. doi: 10.1002/nbm.787. [DOI] [PubMed] [Google Scholar]
- 17.Huisman TAGM, Schwamm LH, Schaefer PW, Koroshetz WJ, Shetty-Alva N, Ozsunar Y, Wu O, Sorensen AG. Diffusion tensor imaging as potential biomarker of white matter injury in diffuse axonal injury. American Journal of Neuroradiology. 2004;25:370–376. [PMC free article] [PubMed] [Google Scholar]
- 18.Arfanakis K, Haughton VM, Carew JD, Rogers BP, Dempsey RJ, Meyerand ME. Diffusion Tensor MR Imaging in Diffuse Axonal Injury. American Journal of Neuroradiology. 2002;23:794–802. [PMC free article] [PubMed] [Google Scholar]
- 19.Huang MX, Theilmann RJ, Robb A, Angeles A, Nichols S, Drake A, D’Andrea J, Levy M, Holland M, Song T, Ge S, Hwang E, Yoo K, Cui L, Baker DG, Trauner D, Coimbra R, Lee RR. Integrated imaging approach with MEG and DTI to detect mild traumatic brain injury in military and civilian patients. Journal of Neurotrauma. 2009;26:1213–1226. doi: 10.1089/neu.2008.0672. [DOI] [PubMed] [Google Scholar]
- 20.Bell AJ, Sejnowski TJ. An information-maximization approach to blind separation and blind deconvolution. Neural Computation. 1995;7:1129–1159. doi: 10.1162/neco.1995.7.6.1129. [DOI] [PubMed] [Google Scholar]
- 21.Koch W, Teipel S, Mueller S, Buerger K, Bokde ALW, Hamper H, Coates U, Reiser M, Meindl T. Effects of aging on default mode network activity in resting state fMRI: Does the method of analysis matter? Neuroimage. 2009;51:280–287. doi: 10.1016/j.neuroimage.2009.12.008. [DOI] [PubMed] [Google Scholar]
- 22.Biswal B, Yetkin F, Haughton V, Hyde J. Functional connectivity in the motor cortex of resting human brain using echo-planar MRI. Magnetic Resonance in Medicine. 1995;34:537–541. doi: 10.1002/mrm.1910340409. [DOI] [PubMed] [Google Scholar]
- 23.Calhoun VD, Liu J, Adali T. A review of group ICA for fMRI data and ICA for joint inference of imaging, genetic, and ERP data. Neuroimage. 2009;45:S163–S172. doi: 10.1016/j.neuroimage.2008.10.057. [DOI] [PMC free article] [PubMed] [Google Scholar]
- 24.Allen EA, Erhardt EB, Damaraju E, Gruner W, Segall JM, Silva RF, Havlicek M, Rachakonda S, Fries J, Kalyanam R, Michael AM, Caprihan A, Turner JA, Eichele T, Adelsheim S, Bryan AD, Bustillo J, Clark VP, Feldstein Ewing SW, Filbey F, Ford CC, Hutchison K, Jung RE, Kiehl KA, Kodituwakku P, Komesu YM, Mayer AR, Pearlson GD, Phillips JP, Sadek JR, Stevens M, Teuscher U, Thoma RJ, Calhoun VD. A baseline for the multivariate comparison of resting-state networks. Frontiers in Systems Neuroscience. 2011;5:1–23. doi: 10.3389/fnsys.2011.00002. [DOI] [PMC free article] [PubMed] [Google Scholar]
- 25.Delis DC, Kramer JH, Kaplan E, Ober BA. California Verbal Learning Test: Second Edition. San Antonio: Psychological Corporation; 2000. [Google Scholar]
- 26.Heaton RK, Chelune GJ, Talley JL, Kay GC, Curtiss G. Wisconsin card sorting manual. Odessa: Psychological Assessment Resources; 1993. [Google Scholar]
- 27.Cicerone KD, Kalmar K. Persistent postconcussion syndrome: the structure of subjective complaints after mild traumatic brain injury. The Journal of Head Trauma Rehabilitation. 1995;10:1–17. [Google Scholar]
- 28.Beck AT, Steer RA, Brown GK. Manual for the Beck Depression Inventory-II. San Antonio, TX: Psychological Corporation; 1996. [Google Scholar]
- 29.Lezak MD, Howieson DB, Loring DW, Hannay HJ, Fischer JS. Neuropsychological Assessment. New York: Oxford University Press; 2004. [Google Scholar]
- 30.Garrity AG, Pearlson GD, McKiernan K, Lloyd D, Kiehl K, Calhoun VD. Aberrant “default mode” functional connectivity in schizophrenia. The American Journal of Psychiatry. 2007;164:450–457. doi: 10.1176/ajp.2007.164.3.450. [DOI] [PubMed] [Google Scholar]
- 31.Calhoun VD, Sui J, Kiehl K, Turner J, Allen E, Pearlson G. Exploring the psychosis functional connectome: aberrant intrinsic networks in schizophrenia and bipolar disorder. Frontiers in Psychiatry. 2011;2:1–13. doi: 10.3389/fpsyt.2011.00075. [DOI] [PMC free article] [PubMed] [Google Scholar]
- 32.Jafri MJ, Pearlson GD, Stevens M, Calhoun VD. A method for functional network connectivity among spatially independent resting-state components in schizophrenia. Neuroimage. 2008;4:1666–1681. doi: 10.1016/j.neuroimage.2007.11.001. [DOI] [PMC free article] [PubMed] [Google Scholar]
- 33.Calhoun VD, Adali T, Pearlson GD, Pekar JJ. A method for making group inferences from functional MRI data using independent component analysis. Human Brain Mapping. 2001;14:140–151. doi: 10.1002/hbm.1048. [DOI] [PMC free article] [PubMed] [Google Scholar]
- 34.Erhardt EB, Rachakonda S, Bedrick EJ, Allen EA, Adali T, Calhoun VD. Comparison of multi-subject ICA methods for analysis of fMRI data. Human Brain Mapping. 2011;32:2075–2095. doi: 10.1002/hbm.21170. [DOI] [PMC free article] [PubMed] [Google Scholar]
- 35.Scott A, Courtney W, Wood D, de la Garza R, Lane S, King M, Wang R, Roberts J, Turner JA, Calhoun VD. COINS: an innovative informatics and neuroimaging tool built for large heterogeneous datasets. Frontiers in Neuroinformatics. 2011;5:1–15. doi: 10.3389/fninf.2011.00033. [DOI] [PMC free article] [PubMed] [Google Scholar]
- 36.Bockholt HJ, Scully M, Courtney W, Rachakonda S, Scott A, Caprihan A, Fries J, Kalyanam R, Segall JM, de la Garza R, Lane S, Calhoun VD. Mining the Mind Research Network: a novel framework for exploring large scale, heterogeneous translational neuroscience research data sources. Frontiers in Neuroinformatics. 2009;3:36. doi: 10.3389/neuro.11.036.2009. [DOI] [PMC free article] [PubMed] [Google Scholar]
- 37.Himberg J, Hyvärinen A, Esposito F. Validating the independent components of neuroimaging time series via clustering and visualization. Neuroimage. 2004;22:1214–1222. doi: 10.1016/j.neuroimage.2004.03.027. [DOI] [PubMed] [Google Scholar]
- 38.Taylor PA, Ford CC. Simulation of blast-induced early-time intracranial wave physics leading to traumatic brain injury. Journal of Biomechanical Engineering. 2009;131:061007. doi: 10.1115/1.3118765. [DOI] [PubMed] [Google Scholar]
- 39.Peskind ER, Petrie EC, Cross DJ, Pagulayan K, McCraw K, Hoff D, Hart K, Yu C, Raskind MA, Cook DG, Minoshima S. Cerebrocerebellar hypometabolism associated with repetitive blast exposure mild traumatic brain injury in 12 Iraq war Veterans with persistent post-concussive symptoms. Neuroimage. 2011;54:S76–S82. doi: 10.1016/j.neuroimage.2010.04.008. [DOI] [PMC free article] [PubMed] [Google Scholar]
- 40.Posner MI, Petersen SE. The attention system of the human brain. Annual Review of Neuroscience. 1990;13:25–42. doi: 10.1146/annurev.ne.13.030190.000325. [DOI] [PubMed] [Google Scholar]
- 41.Corbetta M, Shulman GL. Control of goal-directed and stumulus-driven attention in the brain. Nature Reviews Neuroscience. 2002;3:201–215. doi: 10.1038/nrn755. [DOI] [PubMed] [Google Scholar]
- 42.Nardo D, Santangela V, Macaluso E. Stimulus-driven orienting of visuo-spatial attention in complex dynamic environments. Neuron. 2011;69:1015–1028. doi: 10.1016/j.neuron.2011.02.020. [DOI] [PMC free article] [PubMed] [Google Scholar]