

Abstract
Accumulating epidemiological evidence indicates that the quantitative changes in human mitochondrial DNA (mtDNA) copy number could affect the genetic susceptibility of malignancies in a tumor-specific manner, but the results are still elusive. To provide a more precise estimation on the association between mtDNA copy number and risk of diverse malignancies, a meta-analysis was conducted by calculating the pooled odds ratios (OR) and the 95% confidence intervals (95% CI). A total of 36 case-control studies involving 11,847 cases and 15,438 controls were finally included in the meta-analysis. Overall analysis of all studies suggested no significant association between mtDNA content and cancer risk (OR = 1.044, 95% CI = 0.866–1.260, P = 0.651). Subgroup analyses by cancer types showed an obvious positive association between mtDNA content and lymphoma and breast cancer (OR = 1.645, 95% CI = 1.117–2.421, P = 0.012; OR = 1.721, 95% CI = 1.130–2.622, P = 0.011, respectively), and a negative association for hepatic carcinoma. Stratified analyses by other confounding factors also found increased cancer risk in people with drinking addiction. Further analysis using studies of quartiles found that populations with the highest mtDNA content may be under more obvious risk of melanoma and that Western populations were more susceptible than Asians.
Mitochondria are organelles in eukaryotic cells that participate in a wide range of biological actions, such as energy metabolism, free oxygen radical generation, and cell apoptosis1. Usually thousands of mitochondria exist in each cell. Mitochondria possess separate copies of DNA (mtDNA), which are double-stranded, maternally inherited circular nucleotides with 16,569 base pairs encoding for 37 RNAs, including 13 mRNA, 22 transfer RNAs and two ribosomal RNAs. mtDNA content in cells typically ranges from 103 to 104 copies per cell and varies by cell type2.
Due to the lack of protection from introns and histones, and less efficient DNA repair mechanisms, mtDNA is particularly susceptible to reactive oxidative species (ROS) and other sources of genotoxic damage, which may finally lead to sequence mutations or copy number alterations3. Changes in mtDNA copy number could alter the expression of mitochondrial genes and result in abnormal mitochondrial functions, such as energy production, signaling transduction, apoptosis and cell growth. Therefore, aberrant mtDNA content could potentially lead to alterations in oxidative phosphorylation, and enhance the production of ROS in aerobic metabolism, which can cause chromosomal aberrations such as base pair mutation and chromosome rearrangements, and finally facilitate the malignant transformation4. Contribution of mtDNA copy number alterations to nuclear genome damage has been confirmed by previous studies. Corral et al. found that introduction of mtDNA molecules to chemically-induced rat hepatomas and HT-1080 fibrosarcoma cell line caused an increased number of copies of COI, COII and COIII pseudogenes in the nuclear genome5, while Delsite et al. demonstrated that a reduction in mitochondria in HeLa cells resulted in increased lipid peroxidation6. It has been shown that increased lipid peroxidation could induce damage directly to nuclear DNA7.
Previous studies have reported quantitative changes in mtDNA content in patients’ cancerous tissues compared with their normal counterparts, including an increase of mtDNA content in breast cancer and endometrial adenocarcinoma8,9, and a decrease in colorectal cancer, cervical cancer, osteosarcoma and Ewing’s sarcoma10,11,12,13. Moreover, the alteration of peripheral blood mtDNA content has also been found to be associated with tumor progression and patient prognosis. For example, lower peripheral blood leukocyte mtDNA copy number was correlated with aggressiveness and fast progression of prostate cancer14. Also, high mtDNA copy number in peripheral blood may predict a poor prognosis for hepatocellular carcinoma15, glioma16, colorectal cancer17, and head and neck cancer18. Taken together, these results suggested that the alteration of mtDNA content might play complicated roles in tumorigenesis and progression in a cancer-specific manner.
As above, the involvement of mtDNA content changes in carcinogenesis remains controversial and ambiguous. Meanwhile, a single study might have been underpowered to detect the overall effects. Thus in this study we carried out a meta-analysis to summarize the existing evidence and to make a more precise evaluation about the relationship between mtDNA copy number and cancer risk among different populations.
Methods
Literature search
Relevant studies that estimated the association between mtDNA copy number and risk of cancers were identified from the databases of PubMed, EMBASE, and China National Knowledge Infrastructure (CNKI) up to March 1, 2016 by two investigators independently. The following key words were used for searching: “mitochondrial DNA”, “risk” and “copy number”. Other alternative spellings of these key words such as “content” and “susceptibility” were also used; only those publications in English were retained.
Inclusion and Exclusion criteria
Studies were considered eligible for the current meta-analysis if they met the following criteria: (1) they assessed the relationship between mtDNA copy number (or mtDNA content) and risk (or susceptibility) of diverse cancer types; (2) used a cohort or case–control studies design; (3) had an appropriate description of mtDNA copy number in cases and controls; and (4) reported an odds ratio (OR) with a 95% confidence interval (CI) or other available data for calculating the OR (95% CI).
Exclusion criteria: (1) review articles and editorials; (2) case reports; (3) studies not focused on the mtDNA content and cancer risk; and (4) investigation of the functional role of mtDNA in carcinogenesis.
Data extraction
The following information from each eligible study was carefully extracted independently by two investigators: name of the first author, year of publication, country of origin, number of cases and controls, numbers of genotyped cases and controls, mitochondrial DNA haplotypes, subject population (categorized as East Asian, Indian, Western and Africa populations), source of controls (hospital-based [HB] and population-based [PB]), exposure to smoking, alcohol consumption, and body mass index (BMI).
Statistical analysis
The strength of the association between mtDNA content and risk of diverse cancers was measured by calculating the odds ratio (OR) with a 95% confidence interval (95% CI), and two-tailed P < 0.05 was considered as statistically significant. First, the overall association between mtDNA content and cancer risk was assessed by categorizing mtDNA content into high and low haplotypes based on cut-off points at the median, the 1st tertile and the 2nd quintile. Specifically, for those studies that categorized the mtDNA content into dichotomies or quartiles, the cut-off point was set at the median value in controls. For those studies categorizing mtDNA into tertiles, the 1st tertile was treated as the low mtDNA content group, while the 2nd and 3rd tertiles were seen as the high mtDNA content group. For those studies that categorized mtDNA into quintiles, the 1st and 2nd quintiles were treated as the low content group, while the rest were designated as the high content group. The detailed information for the categorization is presented in supplementary Table S1. Nested case-control studies and case-control studies were then combined to calculate the odds ratio in total and separately.
Further association analysis was performed by recruiting studies of quartiles to test if a dose-dependent relationship existed, under which condition the 1st quartile was designated as the reference. Then we compared the odds ratio for the other quartiles with the reference to test whether the higher mtDNA contents correlated with cancer risk more obviously.
Heterogeneity among studies was further examined with the I2 statistic, which was interpreted as the proportion of total variation contributed by between-study variation. The Mantel–Haenszel method was used to calculate the OR for the pooled data in a fixed effects model if there was no evidence for significant heterogeneity. Otherwise a random effects model was selected to combine the data. Several subgroup meta-analyses were performed in an attempt to assess the association between the mtDNA content and cancer risk based on the population, age, gender, smoking status, alcohol drinking and BMI.
A sensitivity analysis was also performed to examine the reliability of our study by excluding individual studies orderly. Cumulative analysis was performed to explore the tendency of the changes in risk association by publication year. Evidence of publication bias was determined by visual inspection of the funnel plot and Egger’s test. All statistical analyses were performed with STATA software (version 10.0; StataCorp, College Station, TX, USA). All P values are two-sided.
Results
Characteristics of eligible studies
Finally, a total of 36 articles involving 11,847 cases and 15,438 controls were used in the current meta-analysis. By the sample sources according to original records, we classified these 36 articles into 39 independent study subgroups, among which there were twenty-five studies from Western populations, eleven from East Asia, two from India and one from Africa (Table 1). There were five studies with hospital-based controls and the others included population-based controls.
Table 1. Study and host characteristics included in this meta-analysis.
| Author | Year | Cancer type | Sample source | Country | Ethnicity | Sample size Ca/Co | Gender |
Age, year old Ca/Co | BMI, kg/m2 Ca/Co Ca/Co | Smoking status |
Drinking status |
|||
|---|---|---|---|---|---|---|---|---|---|---|---|---|---|---|
| Male Ca/Co | Female | Ever Ca/Co | Never Ca/Co | Ever Ca/Co | Never Ca/Co | |||||||||
| Lan | 2008 | lymphoma | Population | Finland | Caucasian | 104/104 | Un | Un | 58/57 | 25.5/25.4 | Un | Un | Un | Un |
| Shen | 2010 | Breast cancer | Population | USA | Caucasian | 103/103 | Un | 103/103 | 58/56 | 27.8/26.4 | 52/51 | Un | 75/78 | Un |
| 2009 | Renal cell carcinoma | Population | USA | Caucasian | 260/281 | 172/175 | 88/106 | Un | Un | 134/126 | 125/155 | Un | Un | |
| Bonner | 2009 | Lung cancer | Population | China | Asian | 113/107 | 73/68 | 40/39 | 54.9/54.5 | Un | Un | Un | Un | Un |
| Hosgood | 2010 | Lung cancer | Population | Finland | Caucasian | 227/227 | 227/227 | 0/0 | 58.7/58.4 | 25.6/26.3 | 227/227 | 0/0 | Un | Un |
| Liao | 2011 | Gastric cancer | Population | China | Asian | 162/299 | 0/0 | 162/299 | 61.0/61.0 | Un | Un | Un | Un | Un |
| Lynch | 2011 | pancreatic | Population | Finland | Caucasian | 203/656 | 203/656 | 0/0 | 58.0/58.0 | 26.2/25.7 | 203/656 | 0/0 | Un | Un |
| Qu | 2011 | Colorectal | Population | China | Asian | 320/320 | 169/151 | 169/151 | 58.4/58.2 | 23.8/23.6 | 126/105 | 194/215 | 42/35 | 278/285 |
| Zhao | 2011 | Hepatocellular carcinoma | Population | China | Asian | 274/384 | 236/218 | 38/40 | 50.1/48.7 | Un | 154/132 | 120/126 | 98/42 | 176/216 |
| Purdue | 2012 | Renal cell carcinoma | Population | USA | Caucasian | 445/379 | 256/247 | 189/132 | Un | Un | 293/231 | 152/148 | Un | Un |
| Population | African | 158/224 | 109/110 | 49/114 | Un | Un | 112/154 | 46/70 | Un | Un | ||||
| Thyagarajan | 2012 | Colorectal | Population | Singapore Chinese | Asian | 422/874 | 250/380 | 172/494 | 66.1/57.6 | 23.0/22.8 | 181/228 | 241/646 | Un | Un |
| Mondal | 2012 | Oral | Hospital | India | Asian | 124/140 | 98/26 | 101/39 | 58/56 | Un | 89/75 | 35/65 | Un | Un |
| Thyagarajan | 2013 | Breast | Population | Singapore Chinese | Asian | 183/529 | 0/0 | 183/529 | 61.1/61.1 | Un | Un | Un | Un | Un |
| Xie | 2013 | Soft tissue sarcoma | Population | USA | Mixed | 325/330 | 174/180 | 151/150 | 58.24/58.50 | Un | 122/117 | 174/212 | Un | Un |
| Xu | 2013 | Esophageal adenocarcinoma | Population | USA | Caucasian | 218/218 | 173/173 | 45/45 | 62.05/60.94 | Un | 150/122 | 68/96 | Un | Un |
| Ghosh | 2014 | Nasopharyngeal carcinoma | Hospital | India | Asian | 64/100 | 49/79 | 15/21 | Un | Un | 45/26 | 19/74 | Un | Un |
| Hoffman | 2014 | Renal cell carcinoma | Population | USA | Caucasian | 230/468 | 164/331 | 66/137 | Un | Un | 212/256 | 92/138 | Un | Un |
| Hosnijeh | 2014 | lymphoma | Population | European | Caucasian | 469/469 | 231/231 | 238/238 | 56.6/56.6 | 26.9/26.6 | 272/264 | 197/205 | Un | Un |
| Huang | 2014 | Colorectal cancer | Population | China | Asian | 444/1423 | 0/0 | 444/1423 | 58.6/55.2 | 24.6/24.4 | 11/46 | 433/1377 | 14/39 | 430/1384 |
| Jiang | 2014 | Breast cancer | Population | China | Asian | 506/520 | 0/0 | 506/520 | Un | Un | Un | Un | Un | Un |
| Kim ATBC | 2014 | Lung cancer | Population | Finland | Caucasian | 227/227 | 227/227 | 56.67/58.41 | 25.59/26.35 | 227/227 | Un | Un | Un | |
| Kim PLCO | Population | USA | Mixed | 426/436 | 259/267 | 167/169 | 64.07/63.67 | 26.84/27.43 | 380/238 | Un | Un | Un | ||
| Kim SWHS | Population | China | Asian | 221/222 | 0/0 | 221/222 | 59.2/59.2 | 24.58/25.01 | 17/11 | Un | Un | Un | ||
| Sun | 2014 | gastric | Population | USA | Caucasian | 132/125 | 74/65 | 58/60 | 58.2/55.5 | Un | 55/82 | 77/43 | Un | Un |
| Zhang | 2014 | glioma | Population | China | Asian | 414/414 | 241/241 | 173/173 | Un | Un | 96/85 | 318/329 | Un | Un |
| Zhou | 2014 | Prostate cancer | Population | China | Asian | 193/194 | 193/194 | 0/0 | 70.3/70.1 | 24.1/23.2 | 100/98 | 93/96 | Un | Un |
| Hyland | 2014 | Melanoma | Population | USA | Mixed | 136/302 | 130/63 | 172/73 | Un | Un | Un | Un | Un | Un |
| Kim ATBC | 2015 | lymphoma | Population | Finland | Caucasian | 142/142 | 142/142 | Un | Un | Un | 142/142 | 0/0 | Un | Un |
| Kim PLCO | 2015 | lymphoma | Population | USA | Mixed | 292/301 | 178/185 | 114/116 | Un | Un | 135/155 | 157/146 | Un | Un |
| Lemnrau | 2015 | Breast Cancer | Population | UK | Caucasian | 1053/1053 | Un | Un | Un | Un | 428/410 | 679/687 | 981/936 | 125/160 |
| Melkonian | 2015 | Renal cell carcinoma | Population | USA | Caucasian | 608/629 | 400/418 | 208/211 | 58.46/58.57 | Un | 297/287 | 311/342 | Un | Un |
| Shen | 2015 | breast | Population | USA | Caucasian | 1000/1000 | Un | 1000/1000 | 58/56 | 27.8/26.4 | 315/288 | 685/712 | 720/750 | 280/250 |
| Shen | 2015 | melanoma | Population | USA | Mixed | 500/500 | 238/262 | 238/262 | Un | Un | Un | Un | Un | Un |
| He | 2014 | Oralpremalignant lesion | Population | USA | Mixed | 143/357 | 87/215 | 56/142 | 57.3/58.5 | Un | 83/175 | 60/182 | 85/108 | 53/249 |
| Sun | 2015 | Endometrial | Hospital | USA | Caucasian | 139/139 | Un | Un | 62.24/61.76 | Un | 31/48 | 108/91 | Un | Un |
| Wang | 2015 | Liver Cirrhosis | Hospital | USA | Caucasian | 136/136 | 112/105 | 24/31 | 54.17/54.03 | Un | 55/54 | 81/82 | 68/60 | 68/76 |
| Williams | 2015 | Bladder cancer | Hospital | USA | Caucasian | 926/926 | 738/738 | 188/188 | Un | Un | 678/521 | 248/405 | Un | Un |
| Hashad | 2015 | Liver Carcinoma/Cirrhosis | Population | Egypt | African | 90/45 | 52/30 | 38/15 | 50.88/50 | Un | Un | Un | Un | Un |
| Shen | 2016 | Glioma | Population | USA | Caucasian | 395/425 | 242/221 | 149/204 | 49/52 | 28.2/27.6 | 175/216 | 198/204 | Un | Un |
Un: Unknown data.
Among these 36 studies, five each focused on breast cancer, four each on renal clear cell carcinoma, three each on lung cancer, colorectal cancer, lymphoma and hepatic carcinoma /cirrhosis, two each on glioma, melanoma, oral and gastric cancer, and one each on nasopharyngeal cancer, endometrial cancer, prostate cancer, esophageal carcinoma, pancreatic carcinoma, soft tissue sarcoma and bladder cancer.
Most studies used ND1 and D-loop which were located on mtDNA as target regions to determine mtDNA copy number. Hemoglobin subunit beta (HBB), human globulin (HGB), 18 s RNA and glyceraldehyde-3-phosphate dehydrogenase (GAPDH) were the most widely used reference genes, and they are widely accepted single copy nuclear genes. All the information about the measurements applied in the studies can be obtained in supplementary Table S1.
Association between mtDNA content and cancer risk in overall and stratified analyses
When all studies were pooled for the overall meta-analysis by dichotomizing mtDNA copy number into high and low content groups, there was no significant association between mtDNA content and overall cancer risk (OR = 1.044, 95% CI 0.866–1.260, P = 0.651), and there was high heterogeneity (I2 = 92.4%), which may be explained by different cancer types and populations (Fig. 1).
Figure 1. Forest plot of the ORs for the overall cancer risk in dichotomizing analysis.

The squares and horizontal lines correspond to the study-specific OR and 95% CI.
Results of the subgroup analyses are presented in Table 2. Stratification analysis by cancer types identified increased cancer risk associated with high mtDNA content in the subgroups of breast cancer (OR = 1.721, 95% CI = 1.130–2.622, p = 0.011) and lymphoma (OR = 1.645, 95% CI = 1.117–2.421, p = 0.012 respectively), with high and moderate heterogeneity, respectively (I2 = 92.6% and 51.6%). Marginal increased risk associated with high mtDNA content was found in melanoma and glioma, with an odds ratio of 1.555 (95% CI = 0.598–4.045, p = 0.365, I2 = 93.6%) and 2.510 (95% CI = 0.709–8.887, p = 0.154, I2 = 97.2%), respectively. In contrast, mtDNA content was negatively significantly correlated with hepatic malignancy (OR = 0.622, 95% CI = 0.486–0.798, p = 0.000). We further categorized the studies by organ systems, such as digestive, respiratory, gynecological and urinary carcinoma. However, no significant association was identified in any group.
Table 2. Overall and subgroup analyses of mtDNA copy number with cancer risk by dichotomizing mtDNA copy number into high and low groups.
| Subgroups | Research counts (n) | Test of association |
95% CI | P | Heterogeneity |
I2 | Tau-squared | ||
|---|---|---|---|---|---|---|---|---|---|
| Model | OR | χ | p | ||||||
| Overall | 39 | Random | 1.044 | 0.866-1.260 | 0.651 | 499.08 | 0.000 | 92.4% | 0.3139 |
| Cancer types | |||||||||
| Lymphoma | 4 | Random | 1.645 | 1.117-2.421 | 0.012a | 6.20 | 0.102 | 51.6% | 0.0769 |
| Breast cancer | 5 | Random | 1.721 | 1.130-2.622 | 0.011a | 54.16 | 0.000 | 92.6% | 0.2015 |
| Lung cancer | 5 | Random | 0.982 | 0.788-1.223 | 0.871 | 7.84 | 0.097 | 49.0% | 0.2015 |
| Colorectal cancer | 3 | Random | 1.168 | 0.638-2.139 | 0.641 | 34.38 | 0.000 | 94.2% | 0.2681 |
| Renal carcinoma | 4 | Random | 0.856 | 0.598-1.226 | 0.397 | 19.71 | 0.000 | 84.8% | 0.1126 |
| Melanoma | 2 | Random | 1.555 | 0.598-4.045 | 0.365 | 15.73 | 0.000 | 93.6% | 0.4456 |
| Glioma | 2 | Random | 2.510 | 0.709-8.887 | 0.154 | 35.96 | 0.000 | 97.2% | 0.8091 |
| Gastric | 2 | Random | 0.412 | 0.054-3.134 | 0.392 | 25.76 | 0.000 | 96.1% | 2.0587 |
| Hepatic | 3 | Fixed | 0.622 | 0.486-0.798 | 0.000a | 0.53 | 0.767 | 0.0% | |
| Oral | 2 | Random | 0.946 | 0.295-3.029 | 0.925 | 12.43 | 0.000 | 92.0% | 0.6489 |
| Organ systems | |||||||||
| Digestive system | 12 | Random | 0.861 | 0.632-1.173 | 0.344 | 95.74 | 0.000 | 88.5% | 0.2521 |
| Urogenital system | 6 | Random | 0.876 | 0.635-1.209 | 0.420 | 43.03 | 0.000 | 88.4% | 0.1398 |
| Respiratory system | 6 | Random | 0.928 | 0.730-1.179 | 0.539 | 11.74 | 0.039 | 57.4% | 0.0488 |
| Gynecologica system | 6 | Random | 1.253 | 0.744-2.109 | 0.396 | 106.55 | 0.000 | 95.3% | 0.3847 |
| Population | |||||||||
| Western | 25 | Random | 0.951 | 0.719-1.259 | 0.728 | 456.55 | 0.000 | 94.7% | 0.4628 |
| East Asian | 11 | Random | 1.296 | 0.901-1.866 | 0.162 | 147.15 | 0.000 | 93.2% | 0.3481 |
| India | 2 | Fixed | 0.508 | 0.335-0.771 | 0.001 | 0.01 | 0.938 | 0.0% | |
| Africa | 1 | 0.799 | |||||||
| Ageb | |||||||||
| Elder | 10 | Random | 1.104 | 0.655-1.860 | 0.710 | 111.22 | 0.000 | 91.9% | 0.6352 |
| Younger | 10 | Random | 1.079 | 0.670-1.738 | 0.754 | 95.11 | 0.000 | 90.5% | 0.5213 |
| Gender | |||||||||
| Male | 16 | Random | 1.036 | 0.755-1.420 | 0.828 | 155.98 | 0.000 | 90.4% | 0.3578 |
| Female | 22 | Random | 1.109 | 0.866-1.420 | 0.414 | 191.26 | 0.000 | 89.0% | 0.2788 |
| Life styles | |||||||||
| Smoking status | |||||||||
| Ever/Frequent | 21 | Random | 0.984 | 0.765-1.267 | 0.902 | 106.17 | 0.000 | 81.2% | 0.2465 |
| Never/Occasionally | 18 | Random | 1.047 | 0.736-1.491 | 0.798 | 165.82 | 0.000 | 89.7% | 0.4972 |
| Drinking Status | |||||||||
| Ever/Frequent | 5 | Fixed | 1.261 | 1.076-1.479 | 0.004a | 4.53 | 0.340 | 11.6% | |
| Never/Occasionally | 5 | Random | 1.179 | 0.971-1.432 | 0.096 | 42.69 | 0.000 | 90.6% | 0.5403 |
| BMI | |||||||||
| Highc | 4 | Random | 1.103 | 0.413-2.942 | 0.845 | 36.84 | 0.000 | 91.9% | 0.9038 |
| Lowc | 4 | Random | 1.077 | 0.550-2.109 | 0.828 | 15.12 | 0.002 | 80.2% | 0.3609 |
ap < 0.05;
bAge was classified as elder and younger according to publication records; cRelative value which means relatively high and relatively low BMI.
Further subgroup analyses were performed by stratifying studies according to population, age, and gender, as well as life styles such as smoking status, alcohol consumption and body mass index (Table 2). The results revealed that high mtDNA content may predict increased carcinogenesis risk in people with drinking addiction (OR = 1.261, 95% CI = 1.076–1.479, p = 0.004). A total of five studies that provided drinking-related data were included for stratified analysis, and it is notable that four of these studies came from digestive cancers, indicating that high mtDNA content accompanied by drinking addiction may contribute to elevated digestive cancer risk.
According to the study design, we classified the studies into nested case-control and case-control studies (supplementary Table S1), and we performed association analysis based on the study design as well (Table 3). The results from the nested case-control and case-control study did not differ significantly from the results above, which demonstrated the stability and reliability of our analysis. It was surprising to find that mtDNA content was negatively significantly correlated with renal cancer risk in the case-control studies, which was obscured in the stratified analysis in the previous section.
Table 3. Comparison of cancer risk association between nested case-control and case-control studies.
| Subgroups | Research counts (n) | Test of association |
95% CI | P | Heterogeneity |
I2 | Tau-squared | ||
|---|---|---|---|---|---|---|---|---|---|
| Model | OR | χ | p | ||||||
| Overall | |||||||||
| Nested case-control | 16 | Random | 1.133 | 0.957-1.342 | 0.651 | 62.08 | 0.000 | 75.8% | 0.0816 |
| Case-control | 23 | Random | 0.958 | 0.708-1.297 | 0.783 | 436.96 | 0.000 | 95.0% | 0.5011 |
| Cancer types | |||||||||
| Lymphomaa | 4 | Random | 1.645 | 1.117-2.421 | 0.012c | 6.20 | 0.102 | 51.6% | 0.0769 |
| Breast cancer | 2 | Fixed | 1.360 | 1.165-1.587 | 0.000c | 1.77 | 0.183 | 43.6% | |
| Breast cancerb | 3 | Random | 2.001 | 0.897-4.468 | 0.090 | 46.98 | 0.000 | 95.7% | 0.4645 |
| Lung cancer | 4 | Random | 0.888 | 0.752-1.049 | 0.163 | 2.29 | 0.514 | 0.0% | 0.2015 |
| Lung cancer | 1 | 0.669 | |||||||
| Colorectal cancer | 2 | Random | 0.891 | 0.760-1.045 | 0.156 | 14.68 | 0.000 | 93.2% | |
| Colorectal cancer | 1 | 1.991 | |||||||
| Renal carcinoma | 1 | 1.584 | |||||||
| Renal carcinoma | 3 | Fixed | 0.711 | 0.611-0.827 | 0.000c | 0.15 | 0.926 | 0.0% | |
| Melanoma | 2 | Random | 1.555 | 0.598-4.045 | 0.365 | 15.73 | 0.000 | 93.6% | 0.4456 |
| Glioma | 2 | Random | 2.510 | 0.709-8.887 | 0.154 | 35.96 | 0.000 | 97.2% | 0.8091 |
| Gastric | 2 | Random | 0.412 | 0.054-3.134 | 0.392 | 25.76 | 0.000 | 96.1% | 2.0587 |
| Hepatic | 1 | 0.600 | |||||||
| Hepatic | 2 | Fixed | 0.630 | 0.472-0.842 | 0.002c | 0.50 | 0.479 | 0.0% | |
| Oral | 2 | Random | 0.946 | 0.295-3.029 | 0.925 | 12.43 | 0.000 | 92.0% | 0.6489 |
| Organ systems | |||||||||
| Digestive system | 5 | Random | 0.920 | 0.673-1.258 | 0.602 | 20.22 | 0.204 | 80.2% | 0.0975 |
| Digestive system | 7 | Random | 0.711 | 0.399-1.266 | 0.247 | 75.74 | 0.000 | 92.1% | 0.5452 |
| Urogenital system | 1 | 1.584 | |||||||
| Urogenital system | 5 | Random | 0.808 | 0.637-1.025 | 0.079 | 16.11 | 0.003 | 75.2% | 0.0533 |
| Respiratory system | 4 | Random | 0.888 | 0.752-1.049 | 0.163 | 2.29 | 0.514 | 0.0% | 0.2015 |
| Respiratory system | 2 | Random | 0.942 | 0.279-3.181 | 0.924 | 7.97 | 0.005 | 87.4% | 0.6742 |
| Gynecologica system | 2 | Fixed | 1.360 | 1.165-1.587 | 0.000a | 1.77 | 0.183 | 43.6% | |
| Gynecologica system | 4 | Random | 1.143 | 0.443-2.949 | 0.782 | 103.65 | 0.000 | 97.1% | 0.8848 |
aThe bold inclined letters indicate the nested case-control study.
bThe thin inclined letters indicate the case-control study.
cp < 0.05.
Cancer risk increased as mtDNA content elevated by quartile analyses
To investigate the possible dose-dependent relationship between mtDNA content and cancer risk, we enrolled the studies that categorized mtDNA copy number into quartiles for further analysis and assigned the 1st quartile as the reference. A total of 20 studies were included in the dose-dependent relationship analyses. No significant difference was found in the risk among carriers of the 2nd, 3rd and 4th quartiles in the overall analysis. However, stratified analysis by cancer types found that carriers of higher mtDNA content exhibited gradually increasing risk for breast cancer and melanoma (Table 4), which is consistent with the findings in the dichotomous meta-analysis, further supporting the idea that high mtDNA predisposes increased risk in breast cancer and melanoma. After grouping studies by population, the association of mtDNA content in 4th quartiles with cancer risk was more obvious in western populations than in Asians (OR = 1.122, p = 0.016 versus OR = 0.981, p = 0.896). There were no obvious differences in cancer risk among males and females or among frequent and infrequent smokers.
Table 4. Overall and subgroup analyses of mtDNA copy number with cancer risk in quartiles.
| Study groups | Studies (n) | 4th versus 1st quartile |
p | I2 | 3rd versus 1st quartile |
p | I2 | 2nd versus 1st quartile |
p | I2 | |||
|---|---|---|---|---|---|---|---|---|---|---|---|---|---|
| OR | 95%CI | OR | 95%CI | OR | 95%CI | ||||||||
| Overall | 21 | 1.025 | 0.765-1.373 | 0.870 | 90.4% | 0.923 | 0.743-1.146 | 0.466 | 81.9% | 0.925 | 0.777-1.101 | 0.382 | 71.9% |
| Cancer types | |||||||||||||
| Breast cancer | 2 | 1.906 | 0.974-3.729 | 0.060 | 92.9% | 1.573 | 0.973-2.542 | 0.065 | 85.8% | 1.250 | 0.811-1.927 | 0.312 | 81.8% |
| Lung cancer | 4 | 1.068 | 0.783-1.456 | 0.677 | 40.5% | 0.816 | 0.640-0.040 | 0.100 | 0.0% | 1.111 | 0.880-1.401 | 0.376 | 0.0% |
| Renal cancer | 2 | 0.594 | 0.456- 0.775 | 0.000 | 97.4% | 0.572 | 0.437-0.749 | 0.000 | 96.2% | 0.511 | 0.387-0.674 | 0.000 | 93.0% |
| Melanoma | 2 | 1.792 | 1.313-2.445 | 0.000 | 87.9% | 1.696 | 1.240-2.320 | 0.001 | 49.9% | 1.544 | 1.124-2.119 | 0.007 | 10.2% |
| Organ systems | |||||||||||||
| Digestive cancers | 5 | 0.997 | 0.806-1.233 | 0.978 | 78.7% | 0.673 | 0.537-0.845 | 0.001 | 65.7% | 0.622 | 0.495-0.780 | 0.000 | 48.3% |
| Urogenital cancers | 4 | 0.788 | 0.663-0.938 | 0.007 | 92.0% | 0.860 | 0.724-1.021 | 0.085 | 84.2% | 0.864 | 0.726-1.026 | 0.096 | 57.8% |
| Population | |||||||||||||
| Western | 14 | 1.122 | 1.022-1.233 | 0.016 | 90.8% | 0.916 | 0.831-1.008 | 0.073 | 84.1% | 0.881 | 0.799-0.971 | 0.010 | 74.7% |
| East Asian | 5 | 0.981 | 0.739-1.303 | 0.896 | 80.8% | 0.962 | 0.727-1.272 | 0.784 | 73.0% | 0.962 | 0.727-1.272 | 0.784 | 73.0% |
| Gender | |||||||||||||
| Male | 6 | 0.762 | 0.622-0.934 | 0.009 | 90.7% | 0.662 | 0.535-0.819 | 0.000 | 63.7% | 0.768 | 0.625-0.944 | 0.012 | 48.0% |
| Female | 6 | 0.720 | 0.563-0.920 | 0.009 | 80.0% | 0.750 | 0.588-0.957 | 0.020 | 55.2% | 0.733 | 0.572-0.939 | 0.014 | 70.5% |
| Life styles | |||||||||||||
| Smoking staus | |||||||||||||
| Ever/Frequent | 5 | 1.121 | 1.005-1.250 | 0.040 | 43.5% | 1.031 | 0.918-1.158 | 0.603 | 57.0% | 1.036 | 0.919-1.167 | 0.563 | 0.0% |
| Never/occasionally | 5 | 1.117 | 1.001-1.247 | 0.048 | 0.0% | 1.054 | 0.939-1.182 | 0.372 | 0.0% | 1.018 | 0.906- 1.144 | 0.761 | 0.0% |
| Drinking status | |||||||||||||
| Ever/Frequent | 1 | 1.149 | 1.024-1.289 | 0.018 | 1.075 | 0.953-1.212 | 0.242 | 0.998 | 0.875-1.138 | 0.974 | |||
| Never/occasionally | 1 | 1.137 | 0.790-1.635 | 0.489 | 1.160 | 0.862-1.562 | 0.328 | 1.040 | 0.749-1.444 | 0.814 | |||
| BMI | |||||||||||||
| High | 1 | 1.398 | 1.131-1.728 | 0.002 | 1.227 | 0.976-1.543 | 0.080 | 1.053 | 0.796-1.391 | 0.719 | |||
| Low | 1 | 0.950 | 0.609-1.481 | 0.820 | 1.058 | 0.700-1.599 | 0.790 | 1.023 | 0.665-1.574 | 0.917 | |||
Cumulative analysis
The findings from the cumulative meta-analysis showed that the positive association was more obvious in early studies but decreased as the data increased by publication year, and the association strength remained stable in the 95% confidence intervals with increasing sample sizes in recent years (Fig. 2), which further demonstrated the complicated roles of mtDNA content in diverse carcinogenesis.
Figure 2. Cumulative analysis of the overall ORs.

The results were sorted by publication years.
Sensitivity analyses
A sensitivity analysis was conducted to assess the influence of each study by sequential omission of each eligible study both in the overall meta-analysis and stratified analysis. The results showed that the significance of the OR was not affected by any single study (Fig. 3), indicating the reliability of our study.
Figure 3. Sensitivity analysis of the summary ORs on the association between mtDNA content and overall cancer risk.

The results were calculated by omitting each eligible study. Meta-analysis random-effects estimates were used.
Evaluation of publication bias
Both Begg’s funnel plot and Egger’s test were performed to assess the publication bias. The shape of the funnel plots did not reveal any evidence of obvious asymmetry for any genetic model in the overall meta-analysis (Fig. 4). Next, Egger’s test was used to provide statistical evidence for the funnel plot symmetry, and the results still did not suggest any obvious evidence of publication bias (P = 0.868). Thus, there was no obvious risk of publication bias in this meta-analysis.
Figure 4. Begg’s funnel plot for publication bias analysis.
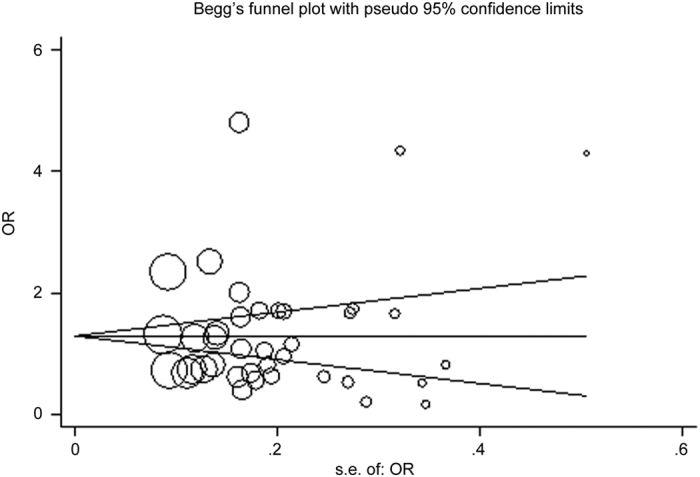
Each point represents a separate study for the indicated association. Log[or], natural logarithm of the odds ratio. Horizontal line indicates effect size.
Discussion
Mitochondria are energy factories that produce adenosine triphosphate (ATP) through oxidative phosphorylation. Both increased and decreased mtDNA copy number in blood have been previously reported to be associated with cancer risk in a cancer-specific manner. For example, it has been reported that increased mtDNA copy number contributes to high risk for breast cancer and lymphoma, while decreased mtDNA content was relevant to renal and colorectal cancers. The opposite effects brought out by altered mtDNA content may represent diverse biological roles that mtDNA plays in malignancies.
Biologically, lowered mtDNA copy number can cause deficiency in oxidative phosphorylation and enhanced production of toxic metabolites in aerobic metabolism and glycolysis, resulting in the disruption of cellular functions. Also, it has been demonstrated that mtDNA reduction promotes cancer cells to become more resistant to apoptosis, and leads to epithelial-mesenchymal transition (EMT)19,20, an important process by which epithelial cells lose their cell polarity and cell-cell adhesion and acquire mesenchymal, fibroblast-like characteristics, accompanied by increased cell migratory and invasive properties, thus endowing the incipient cancer cell with invasive and metastatic properties21. On the other hand, high mtDNA content can be an indicative marker of oxidative stress, which is associated with environmental exposure to pollutants, tobacco, smoke, drugs, xenobiotics, or radiation. High mtDNA content is also an important marker of an impaired aerobic mechanism that is thought to be involved in the molecular mechanisms of carcinogenesis22. These observations together suggest a complicated role for the changes in mtDNA copy number on the modulation of cancer risk. In the present study, we performed this meta-analysis to achieve a more conclusive result.
Our analysis included 36 studies that focused on diverse cancer types from different origins around the world23,24,25,26,27,28,29,30,31,32,33,34,35,36,37,38,39,40,41,42,43,44,45,46,47,48,49,50,51,52,53,54,55,56,57,58. To reduce the uncertainty induced by confusing factors in the meta-analysis, we evaluated the association between mtDNA content with cancer risk in an overall analysis, as well as stratified analyses by cancer types, genders, ages, ethnicity and life styles.
Finally, we did not find an obvious association between mtDNA content and cancer risk in the overall analysis, which should be the result of the heterogeneity among different cancer types. Thus subgroup analyses were performed to further detect the association strength. Stratified analysis by cancer types provided evidence on the relationship between high mtDNA content and increased breast cancer and lymphoma risk. Dose-dependent effects were also found for melanoma risk. The biological contribution of increased mtDNA content in the peripheral blood to carcinogenesis remains obscured. Previous studies found a correlation between mtDNA content and markers of oxidative stress, such as thiobarbituric acid reactive substances and 8-hydroxyguanosine59. Moreover, lower levels of antioxidants were also detected in blood with an increased mtDNA copy number. Due to lack of sufficient protective mechanisms, mtDNA mutations may occur during the process of oxidative stress, and certain mtDNA mutations may lead to the generation of increased superoxide and nitric oxide, resulting in aberrant mitochondrial biogenesis60, which has been associated with deficient or defective apoptosis, and confers a replicative advantage to the cells59. Therefore it is plausible that high mtDNA content in peripheral blood leukocytes may be indicative of increased oxidative stress, impaired aerobic metabolism, and ROS-mediated DNA damage. mtDNA copy number may increase to compensate for mtDNA damage and mitochondrial dysfunction3. Thus it is more likely that the increased mtDNA content is a significant marker of carcinogenesis associated oxidative stress, but not a cause of cancer development.
Stratified analysis also found a significant negative association between mtDNA content and susceptibility of hepatic carcinoma, suggesting the complexity of the involvement of mtDNA changes in carcinogenesis in different populations, which should not be explained by any single mechanism. It has been demonstrated that mtDNA decrease alters mitochondrial gene expression, resulting in deficiency in oxidative phosphorylation, and causes a disturbance of cellular functions. Warburg proposed that damage to the respiratory chain was a critical event in carcinogenesis61, which demonstrates that cancer cells enhanced the generation of adenosine triphosphate by glycolysis62, resulting in a stronger tolerance to hypoxia and reducing the dependence of mitochondrial oxidative phosphorylation, thus conferring tumor cells the advantages of growth. Enhanced glycolysis also leads to excessive production of lactate and prosurvival proteins, which may initiate and promote cancer development. MtDNA reduction was also found to increase cancer cells’ resistance to apoptosis and lead to epithelial-mesenchymal transition, which are both common in tumor formation and metastatic progression. Some previous studies have partially explained the mechanism by which mtDNA reduction acts on apoptosis resistance and epithelial-mesenchymal transition. Biswas et al. reported that decreased mtDNA content could activate NFkappaB/Rel factors63. Activation of nuclear factor-kappa B signaling plays a critical role in apoptosis resistance and is clearly linked to various cancer malignant transformation64. In addition, activation of the AKT pathway by an mtDNA deficiency could also inhibit cell apoptosis65,66. As for the contribution to EMT, mtDNA loss may activate PI3K/Akt2, and Raf/MAPK pathways, which may finally lead to EMT and cancer metastasis67,68.
Stratified analysis by life styles, such as smoking, drinking and BMI status, suggested alcohol users with high mtDNA content may be more susceptible to cancer development, indicating an intrinsic relationship between mtDNA and alcohol degradation. Surprisingly, we did not find any association between altered mtDNA and smoking-related malignancies, although it has been widely accepted that smoking is an important stimulator of diverse cancers. Previous evidence has shown that the metabolites of cigarettes should be oxidative phosphorylated by mitochondria, so we proposed that abnormal mtDNA content may predict altered cancer risk in the smoking population. However, we did not obtain the suspected results, indicating that tumor-genesis of smoking related cancers involves much more cellular abnormality than mtDNA changes.
In summary, our study provides evidence that increased mtDNA content is statistically significantly associated with risk of lymphoma, breast cancer and melanoma, but is negatively associated with hepatic carcinoma. The mechanism for the tumor specific associations between mtDNA content and cancer risk remain to be illustrated, although they are likely to be regulated by a wide range of genetic, molecular, and cellular determinants. For instance, elevated mtDNA content has been significantly associated with altered oxidative stress, aging, immune response activation, and response to environmental exposure. Future studies are warranted to evaluate oxidative stress related factors that influence mtDNA copy number and to provide novel insights into the biological mechanisms of mtDNA copy number variation on the development of various cancers, especially on the opposite effects of increased and decreased mtDNA content in carcinogenesis. Furthermore, many more subjects are needed to confirm the association identified by our meta-analysis in different populations.
Additional Information
How to cite this article: Hu, L. et al. Altered mitochondrial DNA copy number contributes to human cancer risk: evidence from an updated meta-analysis. Sci. Rep. 6, 35859; doi: 10.1038/srep35859 (2016).
Supplementary Material
Acknowledgments
This study was supported by the grants from the Basic Research Program of Jiangsu Province (BK20160606), and National Science Foundation of China (81172032).
Footnotes
Author Contributions L.H. and X.Y. contribute equally on data collection and analysis. Y. S. designed and directed the research.
References
- Chen X. J. & Butow R. A. The organization and inheritance of the mitochondrial genome. Nat Rev Genet 6, 815–825 (2005). [DOI] [PubMed] [Google Scholar]
- Veltri K. L., Espiritu M. & Singh G. Distinct genomic copy number in mitochondria of different mammalian organs. J Cell Physiol 143, 160–164 (1990). [DOI] [PubMed] [Google Scholar]
- Lee H. C., Yin P. H., Lu C. Y., Chi C. W. & Wei Y. H. Increase of mitochondria and mitochondrial DNA in response to oxidative stress in human cells. Biochem J 348 Pt 2, 425–432 (2000). [PMC free article] [PubMed] [Google Scholar]
- Grzybowska-Szatkowska L. & Slaska B. Mitochondrial DNA and carcinogenesis (review). Mol Med Rep 6, 923–930 (2012). [DOI] [PubMed] [Google Scholar]
- Corral M. et al. Increased level of the mitochondrial ND5 transcript in chemically induced rat hepatomas. Exp Cell Res 184, 158–166 (1989). [DOI] [PubMed] [Google Scholar]
- Delsite R. L. et al. Mitochondrial impairment is accompanied by impaired oxidative DNA repair in the nucleus. Mutagenesis 18, 497–503 (2003). [DOI] [PubMed] [Google Scholar]
- Vaca C. E., Wilhelm J. & Harms-Ringdahl M. Interaction of lipid peroxidation products with DNA. A review. Mutat Res 195, 137–149 (1988). [DOI] [PubMed] [Google Scholar]
- Lin C. S. et al. Mitochondrial DNA alterations correlate with the pathological status and the immunological ER, PR, HER-2/neu, p53 and Ki-67 expression in breast invasive ductal carcinoma. Oncol Rep 33, 2924–2934 (2015). [DOI] [PubMed] [Google Scholar]
- Wang Y. et al. The increase of mitochondrial DNA content in endometrial adenocarcinoma cells: a quantitative study using laser-captured microdissected tissues. Gynecol Oncol 98, 104–110 (2005). [DOI] [PubMed] [Google Scholar]
- Cui H. et al. Association of decreased mitochondrial DNA content with the progression of colorectal cancer. BMC Cancer 13, 110 (2013). [DOI] [PMC free article] [PubMed] [Google Scholar]
- Feng D. et al. An association analysis between mitochondrial DNA content, G10398A polymorphism, HPV infection, and the prognosis of cervical cancer in the Chinese Han population. Tumour Biol (2015). [DOI] [PubMed] [Google Scholar]
- Yu M., Wan Y. & Zou Q. Reduced mitochondrial DNA copy number in Chinese patients with osteosarcoma. Transl Res 161, 165–171 (2013). [DOI] [PubMed] [Google Scholar]
- Yu M., Wan Y. & Zou Q. Decreased copy number of mitochondrial DNA in Ewing’s sarcoma. Clin Chim Acta 411, 679–683 (2010). [DOI] [PubMed] [Google Scholar]
- Tu H. et al. Mitochondrial DNA copy number in peripheral blood leukocytes and the aggressiveness of localized prostate cancer. Oncotarget 6, 41988–41996 (2015). [DOI] [PMC free article] [PubMed] [Google Scholar]
- He X. et al. High leukocyte mtDNA content contributes to poor prognosis through ROS-mediated immunosuppression in hepatocellular carcinoma patients. Oncotarget 7, 22834–22845 (2016). [DOI] [PMC free article] [PubMed] [Google Scholar]
- Chen Y. et al. High leukocyte mitochondrial DNA content contributes to poor prognosis in glioma patients through its immunosuppressive effect. Br J Cancer 113, 99–106 (2015). [DOI] [PMC free article] [PubMed] [Google Scholar]
- Qu F. et al. Leukocyte mitochondrial DNA content: a novel biomarker associated with prognosis and therapeutic outcome in colorectal cancer. Carcinogenesis 36, 543–552 (2015). [DOI] [PubMed] [Google Scholar]
- Cheau-Feng Lin F. et al. Mitochondrial DNA copy number is associated with diagnosis and prognosis of head and neck cancer. Biomarkers 19, 269–274 (2014). [DOI] [PubMed] [Google Scholar]
- Gasparre G., Porcelli A. M., Lenaz G. & Romeo G. Relevance of mitochondrial genetics and metabolism in cancer development. Cold Spring Harb Perspect Biol 5 (2013). [DOI] [PMC free article] [PubMed] [Google Scholar]
- Chen E. I. Mitochondrial dysfunction and cancer metastasis. J Bioenerg Biomembr 44, 619–622 (2012). [DOI] [PubMed] [Google Scholar]
- Seton-Rogers S. Epithelial-mesenchymal transition: Untangling EMT’s functions. Nat Rev Cancer 16, 1 (2016). [DOI] [PubMed] [Google Scholar]
- Lee H. C. & Wei Y. H. Mitochondrial biogenesis and mitochondrial DNA maintenance of mammalian cells under oxidative stress. Int J Biochem Cell Biol 37, 822–834 (2005). [DOI] [PubMed] [Google Scholar]
- Lan Q. et al. A prospective study of mitochondrial DNA copy number and risk of non-Hodgkin lymphoma. Blood 112, 4247–4249 (2008). [DOI] [PMC free article] [PubMed] [Google Scholar]
- Xing J. et al. Mitochondrial DNA content: its genetic heritability and association with renal cell carcinoma. J Natl Cancer Inst 100, 1104–1112 (2008). [DOI] [PMC free article] [PubMed] [Google Scholar]
- Hosgood H. D. 3rd et al. Mitochondrial DNA copy number and lung cancer risk in a prospective cohort study. Carcinogenesis 31, 847–849 (2010). [DOI] [PMC free article] [PubMed] [Google Scholar]
- Shen J., Platek M., Mahasneh A., Ambrosone C. B. & Zhao H. Mitochondrial copy number and risk of breast cancer: a pilot study. Mitochondrion 10, 62–68 (2010). [DOI] [PMC free article] [PubMed] [Google Scholar]
- Liao L. M. et al. Mitochondrial DNA copy number and risk of gastric cancer: a report from the Shanghai Women’s Health Study. Cancer Epidemiol Biomarkers Prev 20, 1944–1949 (2011). [DOI] [PMC free article] [PubMed] [Google Scholar]
- Lynch S. M. et al. Mitochondrial DNA copy number and pancreatic cancer in the alpha-tocopherol beta-carotene cancer prevention study. Cancer Prev Res (Phila) 4, 1912–1919 (2011). [DOI] [PMC free article] [PubMed] [Google Scholar]
- Qu F. et al. Association between mitochondrial DNA content in leukocytes and colorectal cancer risk: a case-control analysis. Cancer 117, 3148–3155 (2011). [DOI] [PubMed] [Google Scholar]
- Zhao S. et al. Association of mitochondrial DNA content in peripheral blood leukocyte with hepatitis B virus-related hepatocellular carcinoma in a Chinese Han population. Cancer Sci 102, 1553–1558 (2011). [DOI] [PubMed] [Google Scholar]
- Bonner M. R. et al. Mitochondrial DNA content and lung cancer risk in Xuan Wei, China. Lung Cancer 63, 331–334 (2009). [DOI] [PMC free article] [PubMed] [Google Scholar]
- Purdue M. P. et al. A case-control study of peripheral blood mitochondrial DNA copy number and risk of renal cell carcinoma. PLoS One 7, e43149 (2012). [DOI] [PMC free article] [PubMed] [Google Scholar]
- Thyagarajan B., Wang R., Barcelo H., Koh W. P. & Yuan J. M. Mitochondrial copy number is associated with colorectal cancer risk. Cancer Epidemiol Biomarkers Prev 21, 1574–1581 (2012). [DOI] [PMC free article] [PubMed] [Google Scholar]
- Mondal R. et al. Mitochondrial DNA copy number and risk of oral cancer: a report from Northeast India. PLoS One 8, e57771 (2013). [DOI] [PMC free article] [PubMed] [Google Scholar]
- Thyagarajan B. et al. Mitochondrial DNA copy number is associated with breast cancer risk. PLoS One 8, e65968 (2013). [DOI] [PMC free article] [PubMed] [Google Scholar]
- Xie H. et al. Reduced mitochondrial DNA copy number in peripheral blood leukocytes increases the risk of soft tissue sarcoma. Carcinogenesis 34, 1039–1043 (2013). [DOI] [PubMed] [Google Scholar]
- Xu E. et al. Association of mitochondrial DNA copy number in peripheral blood leukocytes with risk of esophageal adenocarcinoma. Carcinogenesis 34, 2521–2524 (2013). [DOI] [PMC free article] [PubMed] [Google Scholar]
- Ghosh S. K. et al. Dysfunction of mitochondria due to environmental carcinogens in nasopharyngeal carcinoma in the ethnic group of Northeast Indian population. Tumour Biol 35, 6715–6724 (2014). [DOI] [PubMed] [Google Scholar]
- Hofmann J. N. et al. A nested case-control study of leukocyte mitochondrial DNA copy number and renal cell carcinoma in the Prostate, Lung, Colorectal and Ovarian Cancer Screening Trial. Carcinogenesis 35, 1028–1031 (2014). [DOI] [PMC free article] [PubMed] [Google Scholar]
- Hosnijeh F. S. et al. Mitochondrial DNA copy number and future risk of B-cell lymphoma in a nested case-control study in the prospective EPIC cohort. Blood 124, 530–535 (2014). [DOI] [PMC free article] [PubMed] [Google Scholar]
- Huang B. et al. Association of leukocyte mitochondrial DNA copy number with colorectal cancer risk: Results from the Shanghai Women’s Health Study. Cancer Epidemiol Biomarkers Prev 23, 2357–2365 (2014). [DOI] [PMC free article] [PubMed] [Google Scholar]
- Hyland P. L. et al. Constitutive mitochondrial DNA copy number in peripheral blood of melanoma families with and without mutations. J Carcinog Mutagen 2014 (2014). [DOI] [PMC free article] [PubMed] [Google Scholar]
- Jiang H. et al. Peripheral blood mitochondrial DNA content, A10398G polymorphism, and risk of breast cancer in a Han Chinese population. Cancer Sci 105, 639–645 (2014). [DOI] [PMC free article] [PubMed] [Google Scholar]
- Kim C. et al. Pooled analysis of mitochondrial DNA copy number and lung cancer risk in three prospective studies. Cancer Epidemiol Biomarkers Prev 23, 2977–2980 (2014). [DOI] [PMC free article] [PubMed] [Google Scholar]
- Sun Y. et al. Genetic and intermediate phenotypic susceptibility markers of gastric cancer in Hispanic Americans: a case-control study. Cancer 120, 3040–3048 (2014). [DOI] [PubMed] [Google Scholar]
- Zhang J. et al. Association of leukocyte mitochondrial DNA content with glioma risk: evidence from a Chinese case-control study. BMC Cancer 14, 680 (2014). [DOI] [PMC free article] [PubMed] [Google Scholar]
- Zhou W. et al. Peripheral blood mitochondrial DNA copy number is associated with prostate cancer risk and tumor burden. PLoS One 9, e109470 (2014). [DOI] [PMC free article] [PubMed] [Google Scholar]
- He Y. et al. Increased leukocyte mitochondrial DNA copy number is associated with oral premalignant lesions: an epidemiology study. Carcinogenesis 35, 1760–1764 (2014). [DOI] [PMC free article] [PubMed] [Google Scholar]
- Hashad D. I., Elyamany A. S. & Salem P. E. Mitochondrial DNA Copy Number in Egyptian Patients with Hepatitis C Virus-Related Hepatocellular Carcinoma. Genet Test Mol Biomarkers 19, 604–609 (2015). [DOI] [PubMed] [Google Scholar]
- Kim C. et al. Mitochondrial DNA copy number and chronic lymphocytic leukemia/small lymphocytic lymphoma risk in two prospective studies. Cancer Epidemiol Biomarkers Prev 24, 148–153 (2015). [DOI] [PMC free article] [PubMed] [Google Scholar]
- Lemnrau A. et al. Mitochondrial DNA Copy Number in Peripheral Blood Cells and Risk of Developing Breast Cancer. Cancer Res 75, 2844–2850 (2015). [DOI] [PubMed] [Google Scholar]
- Melkonian S. C. et al. Mitochondrial DNA copy number in peripheral blood leukocytes and the risk of clear cell renal cell carcinoma. Carcinogenesis 36, 249–255 (2015). [DOI] [PMC free article] [PubMed] [Google Scholar]
- Shen J., Gopalakrishnan V., Lee J. E., Fang S. & Zhao H. Mitochondrial DNA copy number in peripheral blood and melanoma risk. PLoS One 10, e0131649 (2015). [DOI] [PMC free article] [PubMed] [Google Scholar]
- Shen J., Wan J., Song R. & Zhao H. Peripheral blood mitochondrial DNA copy number, length heteroplasmy and breast cancer risk: a replication study. Carcinogenesis 36, 1307–1313 (2015). [DOI] [PMC free article] [PubMed] [Google Scholar]
- Sun Y., Zhang L., Ho S. S., Wu X. & Gu J. Lower mitochondrial DNA copy number in peripheral blood leukocytes increases the risk of endometrial cancer. Mol Carcinog (2015). [DOI] [PubMed] [Google Scholar]
- Wang C. et al. Circulating mitochondrial DNA content associated with the risk of liver cirrhosis: a nested case-control study. Dig Dis Sci 60, 1707–1715 (2015). [DOI] [PubMed] [Google Scholar]
- Williams S. B. et al. Mitochondrial DNA Content as Risk Factor for Bladder Cancer and Its Association with Mitochondrial DNA Polymorphisms. Cancer Prev Res (Phila) 8, 607–613 (2015). [DOI] [PMC free article] [PubMed] [Google Scholar]
- Shen J., Song R., Lu Z. & Zhao H. Mitochondrial DNA copy number in whole blood and glioma risk: A case control study. Mol Carcinog (2016). [DOI] [PubMed] [Google Scholar]
- Liu C. S. et al. Oxidative stress-related alteration of the copy number of mitochondrial DNA in human leukocytes. Free Radic Res 37, 1307–1317 (2003). [DOI] [PubMed] [Google Scholar]
- Fliss M. S. et al. Facile detection of mitochondrial DNA mutations in tumors and bodily fluids. Science 287, 2017–2019 (2000). [DOI] [PubMed] [Google Scholar]
- Warburg O. On the origin of cancer cells. Science 123, 309–314 (1956). [DOI] [PubMed] [Google Scholar]
- Jeng J. Y. et al. Maintenance of mitochondrial DNA copy number and expression are essential for preservation of mitochondrial function and cell growth. J Cell Biochem 103, 347–357 (2008). [DOI] [PubMed] [Google Scholar]
- Biswas G., Anandatheerthavarada H. K., Zaidi M. & Avadhani N. G. Mitochondria to nucleus stress signaling: a distinctive mechanism of NFkappaB/Rel activation through calcineurin-mediated inactivation of IkappaBbeta. J Cell Biol 161, 507–519 (2003). [DOI] [PMC free article] [PubMed] [Google Scholar]
- Lu T. & Stark G. R. Cytokine overexpression and constitutive NFkappaB in cancer. Cell Cycle 3, 1114–1117 (2004). [PubMed] [Google Scholar]
- Suzuki S. et al. Constitutive activation of AKT pathway inhibits TNF-induced apoptosis in mitochondrial DNA-deficient human myelogenous leukemia ML-1a. Cancer Lett 268, 31–37 (2008). [DOI] [PMC free article] [PubMed] [Google Scholar]
- Pelicano H. et al. Mitochondrial respiration defects in cancer cells cause activation of Akt survival pathway through a redox-mediated mechanism. J Cell Biol 175, 913–923 (2006). [DOI] [PMC free article] [PubMed] [Google Scholar]
- Moro L. et al. Mitochondrial DNA depletion in prostate epithelial cells promotes anoikis resistance and invasion through activation of PI3K/Akt2. Cell Death Differ 16, 571–583 (2009). [DOI] [PubMed] [Google Scholar]
- Naito A. et al. Progressive tumor features accompany epithelial-mesenchymal transition induced in mitochondrial DNA-depleted cells. Cancer Sci 99, 1584–1588 (2008). [DOI] [PMC free article] [PubMed] [Google Scholar]
Associated Data
This section collects any data citations, data availability statements, or supplementary materials included in this article.