Abstract
Background
Clinical TNM staging is based on a qualitative assessment of features defining T descriptors and has been found suboptimal for predicting prognosis of patients with MPM. Previous work suggests that volumetric CT (VOLCT) is prognostic and, if found practical and reproducible, could improve clinical MPM classification.
Methods
Six North American institutions electronically submitted clinical, pathologic and imaging data on patients with stages I-IV MPM to an established multicenter database and biostatistical center (BC). Two reference radiologists, blinded to clinical data, independently reviewed scans, calculated clinical TNM stage by standard criteria, performed semi-automated tumor volume calculations using commercially available software, and submitted the findings to BC. Study endpoints included feasibility of a multi-institutional VOLCT network, concordance of independent VOLCT assessments and association of VOLCT with pathologic T classification.
Results
Of 164 submitted cases, 129 were evaluated by both reference radiologists. Discordant clinical staging of most cases confirmed the inadequacy of current criteria. The overall correlation between VOLCT estimates was good (Spearman Corr. = 0.822), but some were significantly discordant. Root-cause analysis of the most discordant estimates identified four common sources of variability. Despite these limitations, median tumor volume estimates were similar within subgroups of cases representing each pathological T descriptor, and increased monotonically for each reference pathologist with increasing pathological T status.
Conclusions
Good correlation between VOLCT estimates obtained for most cases reviewed by two independent radiologists, and qualitative association of VOLCT with pathological T status combine to encourage further study. Identified sources of user error will inform design of a follow-on prospective trial to more formally assess inter-observer variability of VOLCT and its potential contribution to clinical MPM staging.
Keywords: MPM, Mesothelioma, Tumor volume, volumetric CT, clinical staging
Introduction
Staging of solid tumors using Tumor-Node-Metastasis (TNM) criteria is important for estimating prognosis, selecting among available treatment strategies, and stratifying patients for clinical trials of new therapies. Pathological stage (PS), determined by microscopic analysis of tissue or cytology specimens, provides a gold standard. Clinical staging (CS) using one or more imaging modalities is often used to predict T, N and M status prior to confirmation by invasive procedures. For patients with malignant pleural mesothelioma (MPM), CS does not accurately predict either PS or prognosis, limiting its utility for disease management and suggesting the need for revision of CS methodologies and/or criteria.1
T classification of many solid tumors is based on quantitative assessment of tumor size, combined with binary determination of direct invasion into specific tissue planes or adjacent structures. Tumor size in lung cancer and other tumors can be reliably measured in one or more planes due to round or spheroidal morphology, however the diffuse and irregular anatomy of MPM precludes consistent single or 2-dimensional measurement of tumor size,2–4 which is therefore not included among T classification criteria. Clinical T classification of MPM is instead based entirely on qualitative binary assessment of tumor invasion into adjacent anatomical structures, at a level of resolution insufficient for making such predictions accurately or consistently.
Tumor volume derived from CT scans (VOLCT) may represent a practical means of quantitatively assessing tumor burden in MPM. Two decades ago, Pass et al showed that VOLCT correlated with overall survival among patients with MPM. At that time, however, it required specialized equipment and was too labor intensive and time consuming to be clinically practical.5 Technological advances and improvements in radiology workflow with the availability of hybrid workstations now allows for efficient calculation of tumor volume at the time of reporting. A recent study using this technology confirmed a strong association of VOLCT with overall survival, controlling for other prognostic factors, in patients with epithelioid MPM.6
In preparation for designing an international study to evaluate VolCT in the context of TNM staging, a pilot study was undertaken to determine parameters required to optimize reproducibility of volume estimates. A North American multicenter network was established to electronically acquire and de-identify preoperative CT scans of retrospective MPM cases and distribute them for blind analysis by two reference radiologists. The objectives were to compare their independent volume estimates and to identify logistical, technical, disease- and observer-related parameters associated with the most discrepant estimates. Data obtained from this pilot will assist in determining optimal methods of assessing inter-observer variability of VolCT. The pitfalls identified and lessons learned will help refine the current radiological methodology, inform the design of the international study and guide training and credentialing of participating radiologists in the use of image analysis tools.
Materials and Methods
The North American Multicenter Volumetric CT study For Clinical Staging Of Malignant Pleural Mesothelioma is a prospective, multi-institutional feasibility study. Central standard TNM staging evaluation and volumetric analysis were performed using de-identified CT scans submitted by institutions already participating in the International IASLC/IMIG database for MPM project1. The sites submitting scans and data had IRB approval from their institutions and appropriate data transfer agreements were in place. Institutional Review Board (IRB) waiver was obtained at the sites analyzing the scans.
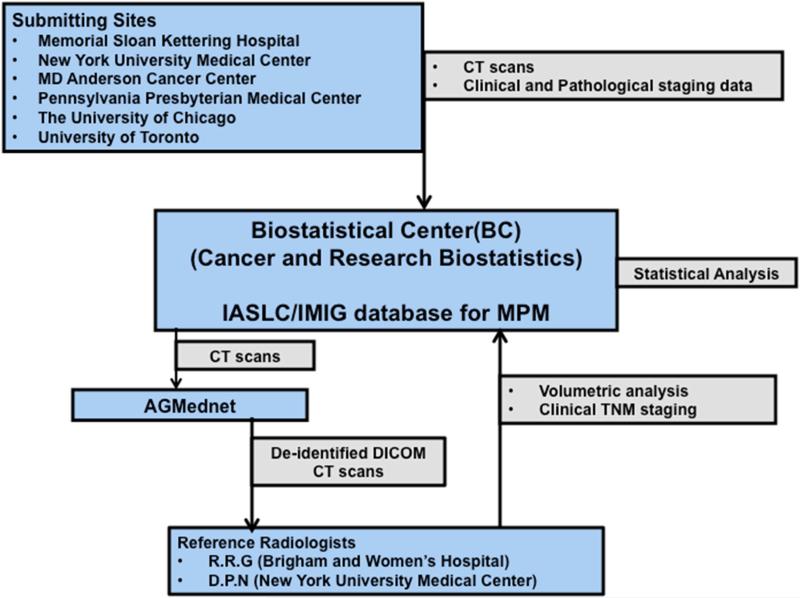
Figure 1 depicts the flow of scans and data among the submitting sites, the BC and the reference radiologists. The International IASLC/IMIG database for MPM comprises retrospective cases submitted by members of the IASLC and International Mesothelioma Interest Group (IMIG). Detailed information was obtained including clinical and pathological tumor staging, patient history, demographics, treatment and outcome of patients with clinical stages I-IV MPM who were deemed candidates for surgical resection with intent to treat. The database was formed with the intent of recommending revisions to the current UICC (International Union Against Cancer) and AJCC (American Joint Commission on Cancer) staging system for MPM. A subset of cases that were submitted from 6 participating North American institutions, (MD Anderson Cancer Center, Memorial Sloan-Kettering Cancer Center, New York University, University of Chicago, the University of Pennsylvania, and University of Toronto) formed the current study cohort. All cohort patients underwent surgery between January 1, 2005 and December 31, 2013.
Figure 1.
Flow chart showing the organizational setup of the study
The 2 reference radiologists who independently performed central readings of both standard and volumetric CT scans were experienced thoracic radiologists (R.R.G. and D.P.N.) who were blinded to scan origin, patient clinical and demographic information, and the results of one another's assessments.
Eligibility criteria
The eligibility criteria for inclusion were pathologically proven MPM, clinical Stage IIV, a preoperative CT scan in DICOM format obtained within 30 days prior to surgery, and clinical and pathological stage determined at the submitting institution, and complete clinical information in accordance with the current common data elements in the International IASLC/IMIG database for MPM7,8. Patients who had received preoperative radiotherapy on protocol at one of the submitting institutions were excluded from this study.
Image acquisition and Quality
All submitted scans had been acquired 30 days or fewer days’ priors to surgery. The scans comprised reconstruction in the soft tissue kernel (B30 for Siemens or equivalent for other vendors) ideally in 1 mm slices in axial plane, however axial slice thickness up to 5 mm was considered acceptable. Contrast enhanced scans were preferred, but non-contrast scans were also included. The site radiologists ensured that the scans were of optimal diagnostic quality prior to submission. The scan quality was assessed by each reference radiologist prior to the volumetric assessment and binned into 3 categories-poor, fair and good. Scans with extensive motion artifact or poor image quality were to be excluded from the final analysis.
Image transfer
De-identified DICOM data were transferred (AG Mednet Inc., Boston, MA) to the two sites where reference assessment was performed- Brigham and Women's Hospital, and New York University. Prior to the transfer, a training session for the participating sites on the use of the AG Mednet Desktop Agent to transmit images, and another training session for the use of the AG Mednet tools were conducted. The two reference sites downloaded the de-identified image data sets of all the patients.
Image Review
Each reference radiologist reviewed the scans to assess the quality of the images and then a detailed radiological review was performed. The CT scan review included assignment of clinical TN stage based on findings on the standard CT scan using the AJCC TNM criteria9,10. Nodal status was assessed in accordance with the TNM staging using the IASLC nodal map9; M status was presumed to be M0, as all these cases were surgically resectable. The data were then entered onto the BC website by both the radiologists using an electronic data capture form.
Volumetric CT (VolCT) assessment
VolCT assessment was performed by each reference radiologist using Vitrea Enterprise suite 6.0 (Vital Images, Minnesota, USA). The same software was used at both sites to ensure consistency of the user interface, the available features, and the algorithmic computation of tumor volume. A power-point presentation detailing the methodology for performing volumetric assessment was created and shared between the two reference radiologists prior to VolCT assessment. Eight training cases with varying amounts of tumor and complexity were identified, and 2 WebEx training sessions were organized among both sites and Vitrea technical support personnel prior to analyzing the study cases. Criteria for segmentation of tumor were discussed during the Webex and the methodology and training cases were used to establish the standard operating procedure for volumetric analysis prior to independent analysis by the two reference radiologists. A demonstration of the technique was performed with a detailed discussion on exclusion of effusion and manual inclusion of any discontinuous areas of tumor and correction of the semi-automatic segmentation to include all areas of pleural thickening representing tumor.
Volumetric assessment was semiautomatic, with initial automated tumor segmentation by the software based on Hounsfield values (using default threshold between 20 and 80 HU) followed by manual delineation and correction by the radiologist. Both radiologists have extensive expertise in thoracic radiology and especially evaluating patients with MPM. Manual exclusion of pleural effusion and chest wall musculature from the segmented area was performed to ensure correct segmentation of the tumor. Discontinuous and separate sites of involvement were separately assessed and summed to yield a total volume estimate per case. Pleural fluid was carefully eliminated from the total tumor volume.
After training, the remaining de-identified DICOM images were imported into the Vitrea workstation at each site and volumetric assessment was performed. Tumor volume was recorded and snapshots of the images were captured as JPEG files. All data were entered into the electronic data capture form and uploaded to the BC website.
Outcomes
The primary study endpoint was feasibility of developing a multicenter network to assess utility of VolCT as a quantitative element of clinical T stage in newly diagnosed MPM. Secondary objectives included identifying potential sources of interobserver variability associated with tumor volume estimates and clinical T classification as assessed by standard CT, and determining to what degree tumor volume corresponds to pathologic T classification. Additional secondary outcomes, including whether tumor volume corresponds to pathologic N classification or tumor histology and whether it is prognostic for progression-free and/or overall survival, were also assessed and are reported in a separate manuscript11.
Statistical Considerations
The surgical/pathological stage for each patient represented the “gold standard” T classification for statistical assessment of clinical classification accuracy by standard CT, and to explore correlation of T status with VolCT. Correlations and concordance rates between two reference radiologists were estimated with reasonable statistical precision, as measured by the 95% confidence intervals for the estimates. Spearman correlation was used to compare volume estimates by the two reference radiologists. The Jonkheere's trend test was used to compare pathologic T category with VolCT estimates for each reference radiologist.
Results
One hundred sixty-four cases were registered to the study from 6 participating institutions. Of these, 8 cases used for training were excluded from the final analysis. Two further cases were excluded as the scans were of poor diagnostic quality: one patient had streak artifact from a metal prosthesis limiting evaluation and one case had poor image quality. One hundred fifty-four cases were deemed eligible with adequate quality scans for volumetric analysis. Of these, 130 scans were analyzed by both reference radiologists. One of the analyzed cases was excluded from the final analysis as an extreme outlier, with volume measurements between the reference radiologists differing by approximately 4000 cm3, an order of magnitude larger than the next largest difference. Ultimately, 129 paired cases were analyzable. One hundred ten (85%) scans were obtained with contrast; slice thickness was 5 mm for 86 scans, 3.75 mm for 1 scan, 3 mm for 16 scans and 2.5 mm for 26 scans.
Clinical staging of the study cohort based on assessment by radiologists at the contributing sites included: 4 (3%) patients with Stage Ib, 37 (29%) patients with Stage II; 63 (49%) patients with Stage III, and 18 (14%) patients with Stage IV (but deemed resectable). Seven (5%) were incompletely staged. Pathological staging included: 2 cases (2%) with Stage Ia; 2 cases (2%) with Stage Ib; 9 cases (7%) with Stage II; 54 cases (42%) with Stage III; 58 cases (45%) with Stage IV; and 4 cases (3%) incompletely staged. Standard clinical staging of each case was performed as part of the central radiology review. ‘T’ categorization by standard criteria was poorly correlated between the two reference radiologists (Table 1). For example, reference radiologist B assigned 80% of cases to T3 as compared with 28% assigned to T3 by reference radiologist A. Relative to pathological stage, both reference radiologists overestimated the number of early stage tumors and underestimated the number of late stage tumors.
Table 1.
| Clinical T Category (Reader A) | Clinical T Category (Reader B) | Row Total (Reader A) | ||||
|---|---|---|---|---|---|---|
| T1a | T1b | T2 | T3 | T4 | ||
| T1a | 7 | 8 | 3 | 13 | 0 | 31 (24%) |
| T1b | 0 | 1 | 3 | 14 | 3 | 21 (16%) |
| T2 | 2 | 1 | 0 | 33 | 5 | 41 (32%) |
| T3 | 0 | 0 | 1 | 20 | 6 | 27 (21%) |
| T4 | 0 | 0 | 0 | 4 | 5 | 9 (7%) |
| Column Total (Reader B) | 9 (7%) | 10 (8%) | 7 (5%) | 84 (65%) | 19 (15%) | 129 (100%) |
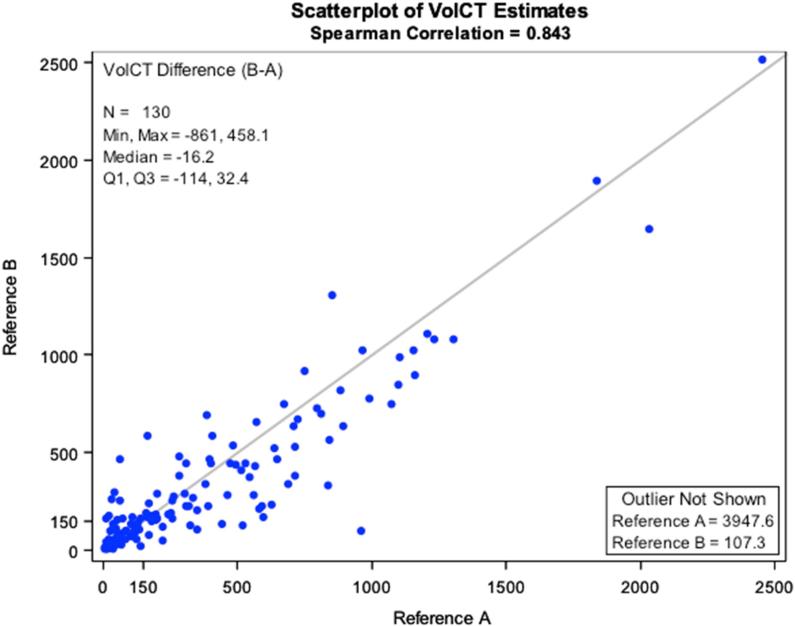
The variability of volume estimates between the two reference radiologists was quite large for several cases, but the overall correlation was good (Spearman Corr. = 0.822; Figure 2). Difference scores were obtained for each case by subtracting tumor volume estimated by reference radiologist A from that of reference radiologist B. In general, reference radiologist A tended to assign volumes larger than those assigned by reference radiologist B, as indicated by a mean difference score that differed significantly from 0 (Mean±SD = -47.9±178.2cc; p = 0.0027).
Figure 2.
Correlation of Volumetric CT analysis estimates of Reader A compared with Reader B
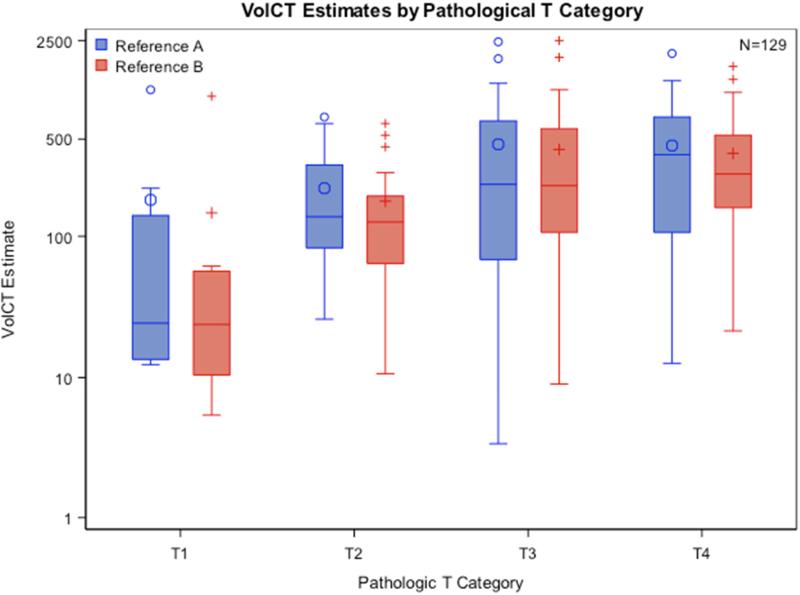
Median tumor volume estimates were similar as assessed by both reference radiologists within subgroups of cases representing each pathological T classification, and increased monotonically with increasing pathological T status (Figure 3; reference radiologist A: p = 0.0034, reference radiologist B: p = 0.0001). There was a significant correlation of pathological T stage with increase in tumor volume. Tumor volume correlated with pathological T stage and overall survival (the results are being reported in a separate manuscript11.
Figure 3.
Comparison of Tumor Volume from both Reference radiologists with Pathological T category
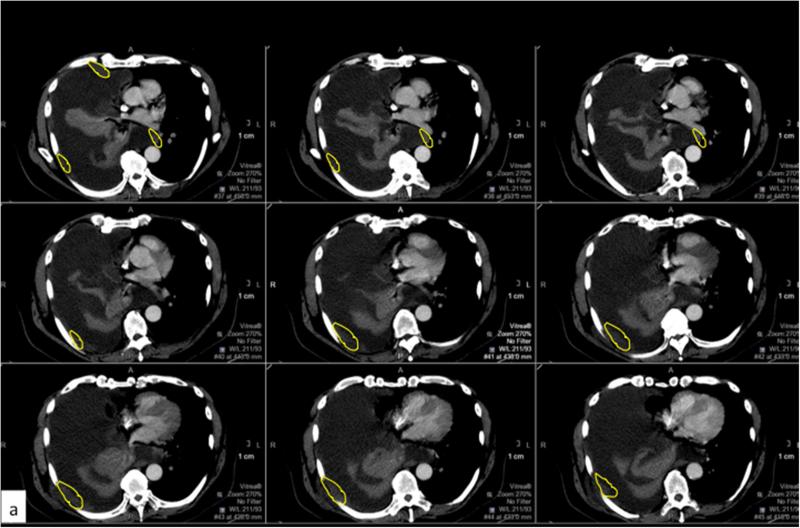
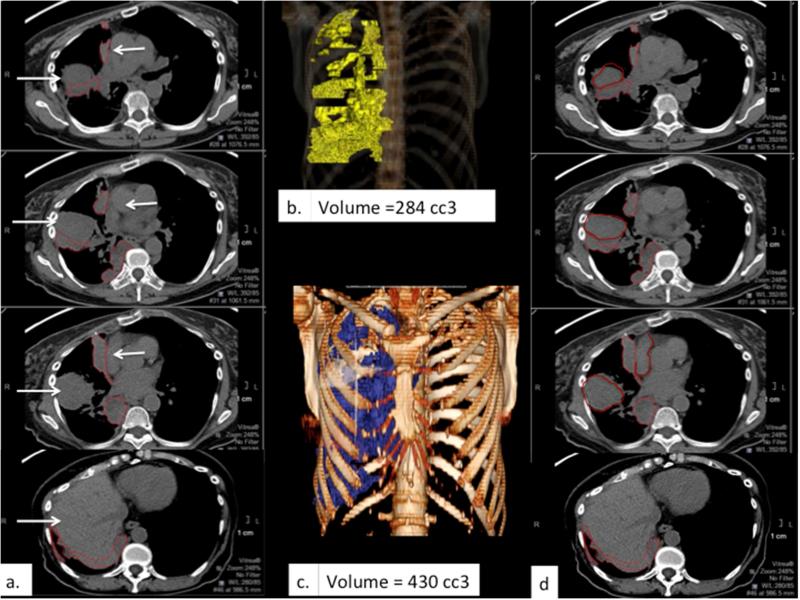
After the statistical analysis of concordance was finalized, independent and consensus root-cause analyses of the largest discrepancies were performed by the 2 reference radiologists. The 35 discordant cases with absolute volume difference larger than 60 cc were independently re-reviewed by each of the reference radiologists with a side-to-side comparison of the two volumetric analyses. A final consensus review was performed via WebEx. Reasons for discrepancy were assigned by consensus to one of four categories- data entry error, perception error, user error and error secondary to limited distinction between tumor and adjacent tissues (Table: 2). There were 8 data entry errors attributed to erroneous entry of the tumor volume into the electronic data capture form. Six perception errors were attributed to a difference in perception of the location of the tumor between the two reviewers (Figure 4). Eight cases attributed to limited distinction between tumor and adjacent tissues were either underestimated or overestimated by one or both reviewers when a moderate or large volume loculated effusion was present or due to lack of intravenous contrast, prior pleurodesis or poor signal to noise ratio between the adjacent structures (Figure 5). Twelve cases were attributed to user error in tool knowledge, involving technical factors related to using the sculpting tools.
Table 2.
Discordant cases and categorization
| Subject ID | Absolute difference in volume in cc3 | Category |
|---|---|---|
| 1098 | 860.6 | Perception error |
| 1159 | 401.7 | Limited distinction between tumor and adjacent tissues. |
| 1158 | 391.1 | Limited distinction between tumor and adjacent tissues. |
| 1312 | 387.6 | Perception error |
| 1166 | 321.2 | Limited distinction between tumor and adjacent tissues. |
| 186 | 278.6 | Perception error |
| 1180 | 273.6 | Perception error |
| 1059 | 261.5 | Perception error |
| 408 | 259.4 | Limited distinction between tumor and adjacent tissues. |
| 1178 | 258.8 | Perception error |
| 1006 | 209.4 | Limited distinction between tumor and adjacent tissues. |
| 343 | 196.2 | Perception error |
| 1311 | 194.6 | Limited distinction between tumor and adjacent tissues. |
| 1319 | 191.1 | Perception error |
| 663 | 178.5 | Limited distinction between tumor and adjacent tissues. |
| 1062 | 173.7 | Limited distinction between tumor and adjacent tissues. |
* Case removed from cohort prior to data analysis
Figure 4.
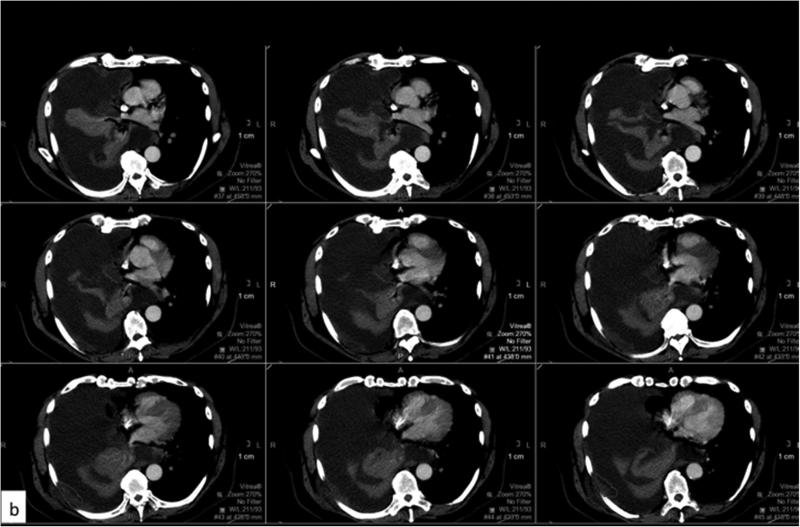
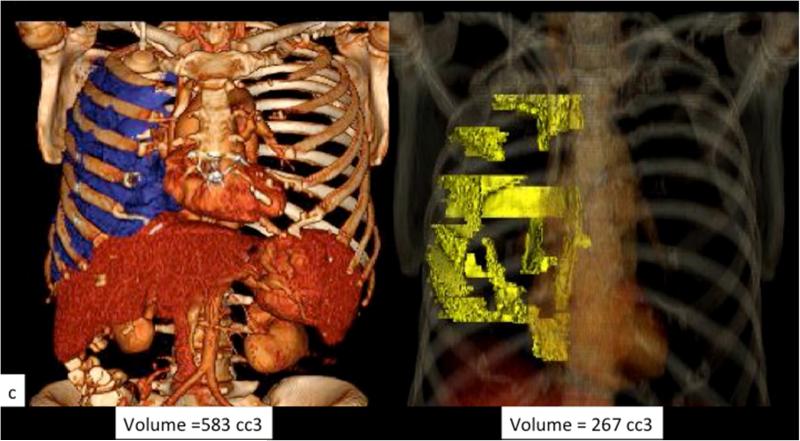
Example of perception error. Axial CT images with contrast from a patient with MPM with a large right pleural effusion and discontinuous areas of pleural thickening representing tumor. Panels a (yellow contour line) and b (red contour line) respectively represent areas perceived as tumor by the two reviewers, and the resulting difference in calculated tumor volume as depicted in the 3D volume rendered images (c).
Figure 5.
Example of limited distinction between tumor and adjacent structures. (a) and (d) depict corresponding sets of axial CT images obtained without intravenous contrast in a patient with right-sided MPM, with similar density and therefore poor contrast among tumor, chest wall musculature, liver and the mediastinal vascular structures (white arrows) demonstrating discrepant tumor delineation by the two reference radiologists, respectively. The resulting difference in calculated tumor volume is apparent comparing the respective 3D volume rendered images (b & c).
Discussion
We describe herein the results of a multi-institution pilot study for quantitative assessment of tumor volume in MPM. The information from this study will aid in planning and designing the planned larger international study open to all institutions currently participating in the International IASLC/IMIG database for MPM. This study was challenging from a technical standpoint, but demonstrated that implementation of quantitative volumetric analysis from CT scans for a morphologically complex tumor such MPM is feasible at a research level, that translation to clinical practice will require overcoming technological challenges and will require refining the methodology and standardizing imaging parameters.
There is a need to develop and validate quantitative metrics for clinically measuring MPM. Unlike lung cancer, where tumor diameter is a primary determinant of T classification, no quantitative assessment is involved for classifying MPM using the current (7th edition) AJCC criteria. Instead, classification is based exclusively on assessment of 17 specific features with binary determination of which, if any, tissue planes have been transgressed by pleural tumor with invasion into adjacent anatomic structures. The completeness of pathologic T classification for MPM depends on how many of these structures can be microscopically assessed and is limited by the absence of many relevant margins even in a complete extrapleural pneumonectomy specimen.
Clinical T classification, on the other hand, requires qualitative assessment of these planes by the radiologist at a macroscopic level of resolution. The irregular, rind-like morphology of MPM and poor contrast resolution between tumor and adjacent structures limit determination of invasion by any imaging modality.12 Classification may be influenced by differences in perception by radiologists, leading to low concordance in relation to pathological T classification. Variability is further compounded by the rarity of, and thus lack of experience with these cases in most centers, and lack of a standardized lexicon and reporting template in radiology workflow.
These limitations of current clinical staging of MPM were confirmed in the current study. Clinical determination of T classification by site radiologists did not correspond with pathological T status. The two reference radiologists were discordant in clinical T classification despite template-based assessment. They respectively assigned T3 classification to 80% and 20% of cases. Generally, both reference radiologists overestimated the number of early stage tumors and underestimated late stage tumors. These observations underscore the need to augment the accuracy and repeatability of MPM clinical staging, goals that might be accomplished by incorporating surrogate criteria that can be quantitatively assessed at the scale and resolution of standard imaging studies.
Modifications to staging standards must be evidence-based, broadly accessible and appropriately validated using internationally representative patient cohorts and qualified clinicians. Quantitative radiographic assessment of MPM tumor burden is commonly used worldwide for determining response, particularly to chemotherapy, in clinical trials. Standard uni-dimensional13, bi-dimensional14 and specifically modified RECIST criteria15 have been found suboptimal for MPM due to significant rates of interobserver variability16. The potential of uni- and bi-dimensional tumor measurements to provide quantitative criteria for clinical staging is unknown, as their correlations to 3-dimensional volume and pathological T classification have not been reported.
Single institution studies5,6 have suggested that estimating 3-dimensional tumor volume directly by VOLCT may have utility in staging based on significant associations with prognosis of surgical patients. However, such measurements have only recently become practical, and broad experience with the methodology is lacking. Importantly, the associated interobserver variability has not been measured. The current pilot study explored the feasibility of assessing tumor volume using VolCT in a multi-center setting. It identified pitfalls, parameters and standards for CT images and for radiologist training and credentialing that will be required to design an international study powered to determine interobserver variability of VOLCT and its potential to provide a practical quantitative criterion for T classification.
Our pilot study evaluated a standard set of images that were blind coded and scored by two reference radiologists using similar methodology and software. Key factors that would be critical to the design of a definitive larger study were evident. These include the need for standardization of scan quality, optimal training and credentialing requirements for radiologists and the need for standardized reporting for evaluation of this morphologically complex tumor. Increasing pathological T categories were associated with monotonically increasing tumor volume as assessed by each reference radiologist, suggesting that VOLCT may offer a useful contribution to clinical T categorization. This observation justifies formal evaluation of inter-observer variability and feasibility of VOLCT in a larger international multi-institutional prospective trial.
There were several notable limitations of our study. As a pilot, analysis was limited to only two reference radiologists, precluding formal assessment of inter-observer availability. Since this study involved obtaining CT data associated with an existing international retrospective database, broad criteria for scan quality resulted in heterogeneity of scan parameters. These factors likely contributed to the 7 discordant cases attributed to limited distinction between tumor and adjacent tissues, and 8 cases related to perception errors, and will require standardization of imaging protocols in future prospective studies. While the former can be mitigated by the addition of intravenous contrast and thin section data acquisition for volumetric analysis, the latter is a more challenging issue. Creation of a library of challenging cases with annotation and delineation of the tumor, to be used as a training set and an education resource for radiologists and potential credentialing prior to volumetric analysis may help decrease the perception errors. Further discordant estimates attributed to data entry errors highlight the need for electronic data capture from VOLCT workstations. The significant number of discordant cases attributed to user errors in tool knowledge requires that training and credentialing of reference radiologists be prioritized. These considerations will optimize assessment of intra and inter-observer variability of quantitative measurements in the planned prospective follow-on study.
There has been increasing interest in transitioning from qualitative to quantitative clinical assessment of MPM3,4,6,17 Translation from research to clinical workflow will require educating radiologists and enhancing their ability to use quantification tools which are now inbuilt in most PACS workstations. A training set can be created with scans of varying complexity selected from among the current pilot cases. Ongoing technological advances in sculpting tools and software available for quantification of tumors are encouraging and as these tools become more intuitive and user-friendly, their incorporation into clinical workflow will be increasingly feasible.
In conclusion, a network was successfully established for multicenter evaluation of VOLCT. The study provided qualitative validation of the feasibility of a more formal prospective study and suggested that VOLCT may contribute to quantitative clinical staging of MPM.
Acknowledgements
We would like to thank all the members of the IASLC and International Mesothelioma Interest Group (IMIG) for the help and support during the study. We also want to thank Vitrea, Vital images Inc. for providing the software and technical help with the study.
This study was supported in part by the Mesothelioma Applied Research Foundation Dr. Valerie Rusch's work is supported in part by National Institutes of Health/National Cancer Institute Cancer Center Support Grant P30 CA008748
Appendix 1
The Malignant Mesothelioma Volumetric CT Study Group
Memorial Sloan-Kettering Cancer Center: Dr. Valerie Rusch, Dr. Michelle Ginsberg; University of Texas and MD Anderson Cancer Center: Dr. David Rice, Dr. Jeremy Erasmus;
New York University Medical Center: Dr. Harvey Pass, Dr. David Naidich;
The University of Chicago: Dr. Hedy L, Kindler, Dr. Samuel Armato, Dr. Christopher Strauss, Dr. Wickii Vigneshwaran;
Penn Presbyterian Medical Center: Dr. Joseph Friedberg, Dr. Sharyn Katz;
University of Toronto: Dr. Marc de Perrot, Dr. Demetris Pastios MD, BA (Oxon), BM, BCh, MRCP(UK), FRCR;
Cancer Research and Biostatistics: Dori Giroux, M.S., Lynn Shemanski, Ph.D., Alan Mitchell, M.S.
Footnotes
Publisher's Disclaimer: This is a PDF file of an unedited manuscript that has been accepted for publication. As a service to our customers we are providing this early version of the manuscript. The manuscript will undergo copyediting, typesetting, and review of the resulting proof before it is published in its final citable form. Please note that during the production process errors may be discovered which could affect the content, and all legal disclaimers that apply to the journal pertain.
Presented at International Mesothelioma Interest Group, Cape Town, South Africa, 2014.
DISCLOSURES
Dr. Rusch reports grants from Mesothelioma Applied Research Foundation, during the conduct of the study.
Dr. Straus has nothing to disclose.
Mr. Mitchell has nothing to disclose.
Dr. Ginsberg has nothing to disclose.
Dr. Naidich has nothing to disclose.
Dr. Gill reports grants from Mesothelioma Applied Research Foundation, outside the submitted work.
Dr. Katz has nothing to disclose.
Dr. Armato III reports grants from Mesothelioma Applied Research Foundation, grants from Cancer Research and Biostatistics, during the conduct of the study; personal fees from Aduro Biotech, Inc., outside the submitted work; In addition, Dr. Armato III has a patent U.S. Patent Number 6,577,752 issued, and a patent U.S. Patent Number 6,813,375 issued.
Dr. Erasmus
Dr. Pastios
Dr. Richards
References
- 1.Rusch VW, Giroux D, Kennedy C, Ruffini E, Cangir AK, Rice D, et al. Initial analysis of the international association for the study of lung cancer mesothelioma database. J Thorac Oncol [Internet] 2012 Nov;7(11):1631–9. doi: 10.1097/JTO.0b013e31826915f1. Available from: http://www.ncbi.nlm.nih.gov/pubmed/23070243. [DOI] [PubMed] [Google Scholar]
- 2.Sensakovic WF, Armato SG, Straus C, Roberts RY, Caligiuri P, Starkey A, et al. Computerized segmentation and measurement of malignant pleural mesothelioma. Med Phys. 2011;38:238–44. doi: 10.1118/1.3525836. [DOI] [PMC free article] [PubMed] [Google Scholar]
- 3.Armato SG. Computerized analysis of mesothelioma on CT scans. Lung Cancer. 2005;49(SUPPL. 1) doi: 10.1016/j.lungcan.2005.03.011. [DOI] [PubMed] [Google Scholar]
- 4.Armato SG, Oxnard GR, MacMahon H, Vogelzang NJ, Kindler HL, Kocherginsky M, et al. Measurement of mesothelioma on thoracic CT scans: a comparison of manual and computer-assisted techniques. Med. Phys. 2004 doi: 10.1118/1.1688211. [DOI] [PubMed] [Google Scholar]
- 5.Pass HI, Temeck BK, Kranda K, Steinberg SM, Feuerstein IR. Preoperative tumor volume is associated with outcome in malignant pleural mesothelioma. J. Thorac. Cardiovasc. Surg. 1998 doi: 10.1016/S0022-5223(98)70274-0. [DOI] [PubMed] [Google Scholar]
- 6.Gill RR, Richards WG, Yeap BY, Matsuoka S, Wolf AS, Gerbaudo VH, et al. Epithelial malignant pleural mesothelioma after extrapleural pneumonectomy: stratification of survival with CT-derived tumor volume. Ajr Am J Roentgenol. 2012;198:359–63. doi: 10.2214/AJR.11.7015. [DOI] [PubMed] [Google Scholar]
- 7.Rusch VW, Giroux D. Do we need a revised staging system for malignant pleural mesothelioma? Analysis of the IASLC database. Ann Cardiothorac Surg [Internet] 2012;1(4):438–48. doi: 10.3978/j.issn.2225-319X.2012.11.10. [DOI] [PMC free article] [PubMed] [Google Scholar]
- 8.Rusch VW, Giroux D, Kennedy C, Ruffini E, Cangir AK, Rice D, et al. Initial Analysis of the International Association For the Study of Lung Cancer Mesothelioma Database. J Thorac Oncol Off Publ Int Assoc Study Lung Cancer. 2012;7:1631–9. doi: 10.1097/JTO.0b013e31826915f1. [DOI] [PubMed] [Google Scholar]
- 9.Beahrs OH, Hensen DE, Hutter RVP, et al. AJCC Manual for Staging of Cancer. 4rth ed. lippincott; Philadelphia: 1992. [Google Scholar]
- 10.Speissel B, Beahrs OH, Hermanek P, et al. International Union Against Cancer (UICC). TNM Atlas. 3rd ed. Springer; Berlin: 1992. [Google Scholar]
- 11.Rusch VW, et al. A Multicenter Study of Volumetric Computed Tomography for Staging Malignant Pleural Mesothelioma. Submitted to JTCVS. [DOI] [PMC free article] [PubMed]
- 12.Wang ZJ, Reddy GP, Gotway MB, Higgins CB, Jablons DM, Ramaswamy M, et al. Malignant pleural mesothelioma: evaluation with CT, MR imaging, and PET. Radiographics [Internet] 2004;24:105–19. doi: 10.1148/rg.241035058. Available from: http://www.ncbi.nlm.nih.gov/pubmed/14730040. [DOI] [PubMed] [Google Scholar]
- 13.Therasse P, Arbuck SG, Eisenhauer EA, Wanders J, Kaplan RS, Rubinstein L, et al. New Guidelines to Evaluate the Response to Treatment. J Natl Cancer Inst. 2000;92(3):205–16. doi: 10.1093/jnci/92.3.205. [DOI] [PubMed] [Google Scholar]
- 14.Miller AB, Hoogstraten B, Staquet M, Winkler A. Reporting results of cancer treatment. Cancer. 1981;47(1):207–14. doi: 10.1002/1097-0142(19810101)47:1<207::aid-cncr2820470134>3.0.co;2-6. [DOI] [PubMed] [Google Scholar]
- 15.Byrne MJ, Nowak AK. Modified RECIST criteria for assessment of response in malignant pleural mesothelioma. Ann Oncol. 2004;15(2):257–60. doi: 10.1093/annonc/mdh059. [DOI] [PubMed] [Google Scholar]
- 16.Ceresoli GL, Chiti A, Zucali PA, Cappuzzo F, De Vincenzo F, Cavina R, et al. Assessment of tumor response in malignant pleural mesothelioma. Cancer Treat Rev [Internet] 2007;33(6):533–41. doi: 10.1016/j.ctrv.2007.07.012. [DOI] [PubMed] [Google Scholar]
- 17.Nowak AK, Francis RJ, Phillips MJ, Millward MJ, Van Der Schaaf AA, Boucek J, et al. A novel prognostic model for malignant mesothelioma incorporating quantitative FDG-PET imaging with clinical parameters. Clin Cancer Res. 2010;16(8):2409–17. doi: 10.1158/1078-0432.CCR-09-2313. [DOI] [PubMed] [Google Scholar]


