Abstract
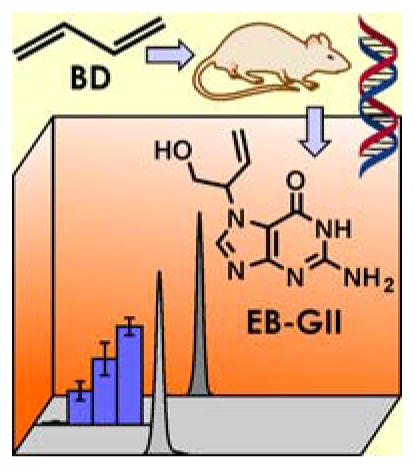
Human exposure to 1,3-butadiene (BD) present in automobile exhaust, cigarette smoke, and forest fires is of great concern because of its potent carcinogenicity. The adverse health effects of BD are mediated by its epoxide metabolites such as 3,4-epoxy-1-butene (EB), which covalently modify genomic DNA to form promutagenic nucleobase adducts. Because of their direct role in cancer, BD-DNA adducts can be used as mechanism-based biomarkers of BD exposure. In the present work, a mass spectrometry-based methodology was developed for accurate, sensitive, and precise quantification of EB-induced N-7-(1-hydroxy-3-buten-2-yl) guanine (EB-GII) DNA adducts in vivo. In our approach, EB-GII adducts are selectively released from DNA backbone by neutral thermal hydrolysis, followed by ultrafiltration, offline HPLC purification, and isotope dilution nanoLC/ESI+-HRMS3 analysis on an Orbitrap Velos mass spectrometer. Following method validation, EB-GII lesions were quantified in human fibrosarcoma (HT1080) cells treated with micromolar concentrations of EB and in liver tissues of rats exposed to sub ppm concentrations of BD (0.5–1.5 ppm). EB-GII concentrations increased linearly from 1.15±0.23 to 10.11±0.45adducts per 108 nucleotides in HT1080 cells treated with 0.5–10 μM DEB. EB-GII concentrations in DNA of laboratory rats exposed to 0.5, 1.0 and 1.5 ppm BD were 0.17±0.05, 0.33±0.08, and 0.50±0.04 adducts per 108 nucleotides, respectively. We also used the new method to determine the in vivo half-life of EB-GII adducts in rat liver DNA (2.20±0.12 days) and to detect EB-GII in human blood DNA. To our knowledge, this is the first application of nanoLC/ESI+-HRMS3 Orbitrap methodology to quantitative analysis of DNA adducts in vivo.
Graphical Abstract
Introduction
Humans are exposed to numerous exogenous and endogenous chemicals present in automobile exhaust, urban air, water, food, and cigarette smoke [1–3]. Among these is 1,3-butadiene (BD), a prominent industrial and environmental pollutant classified as a known carcinogen [4–7]. Human exposure to BD is due to its presence in automobile exhaust (20–60 ppb) [8], cigarette smoke (8.5–48.2 μg/cigarette) [9], wood fires (0.14–0.17 ppb) [10], and occupational sources in BD monomer and polymer industries [11–13].
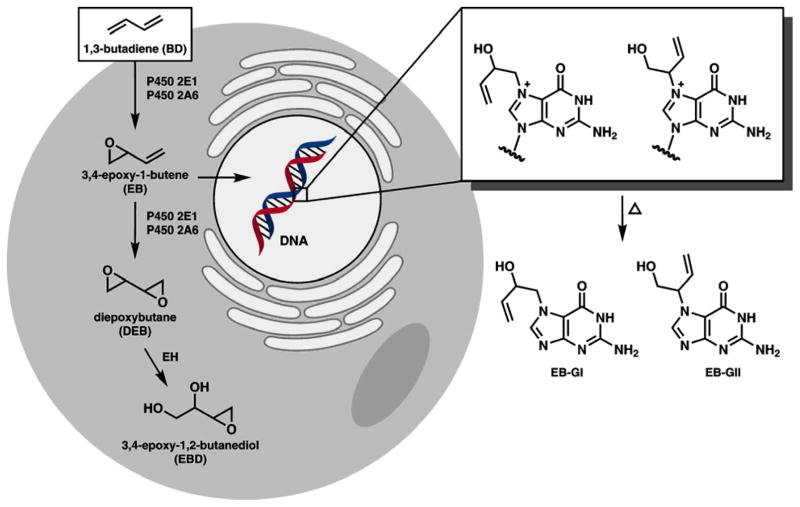
BD undergoes cytochrome P450-mediated metabolic activation to three epoxide metabolites: 3,4-epoxy-1-butene (EB), 1,2,3,4-diepoxybutane (DEB), and 1,2-dihydroxy-3,4-epoxybutane (EBD) (Scheme 1) [14]. These electrophilic epoxides are held responsible for the carcinogenicity and mutagenicity of BD because of their propensity to react with DNA to form covalent nucleobase adducts [15–19], which can cause DNA polymerase errors [20–23]. Sensitive and specific quantitative methods for BD-DNA adducts in vivo are needed because they can be used in human cancer risk assessment [24, 25].
Scheme 1.
Bioactivation of BD to electrophilic epoxides and the formation of EB-guanine adducts in DNA. EH, epoxide hydrolase; EB-GI, N-7-(2-hydroxy-3-buten-1-yl) guanine; EB-GII, N-7-(1-hydroxy-3-buten-2-yl) guanine.
3,4-Epoxy-1-butene (EB) is the second most abundant epoxide formed upon metabolic activation of BD. EB reacts with the N7-position of guanine in DNA to form N-7-(2-hydroxy-3-buten-1-yl) guanine (EB-GI) and N-7-(1-hydroxy-3-buten-2-yl) guanine (EB-GII) adducts (Scheme 1) [19, 26]. EB-GI and EB-GII can be used as biomarkers of BD exposure and bioactivation, along with the corresponding hemoglobin adducts (N-(2-hydroxy-3-buten-1-yl)-valine (HB-Val)) [27] and urinary metabolites (2-(N-acetyl-L-cystein-S-yl)-1-hydroxybut-3-ene and 1-(N-acetyl-L-cystein-S-yl)-2-hydroxybut-3-ene (MHBMA) [28]. While globin adducts and urinary metabolites have been extensively used as biomarkers of BD exposure and metabolic activation [27–32], one important advantage of DNA adducts is that they represent the biologically relevant dose of BD and thus are directly associated with BD-mediated mutagenesis and cancer.
In the present study, a nanoHPLC-high resolution tandem mass spectrometry (nanoLC/ESI+-HRMS3) methodology utilizing an Orbitrap Velos mass spectrometer was developed to allow for sensitive and specific quantitation of EB-GII adducts in vivo. EB-GII adducts were quantified by isotope dilution with the corresponding 15N-labeled internal standard. The new method was fully validated and applied to determine the concentrations of EB-GII in human fibrosarcoma (HT1080) cells treated with increasing concentrations of EB (50 nM to 10 μM), in liver tissues of laboratory rats exposed to BD by inhalation, and in human blood DNA.
Experimental
Note: EB is a known carcinogen and must be handled with adequate safety precautions. Phenol and chloroform are toxic chemicals which should be used only in a well-ventilated fume hood with appropriate personal protective equipment.
Puregene DNA purification reagents were obtained from Qiagen (Valencia, CA). LC-MS grade water, methanol and acetonitrile were purchased from Fisher Scientific (Pittsburgh, PA). All other chemicals and solvents were obtained from Sigma-Aldrich (Millwaukee, WI, St. Louis, MO). Nonsmoker blood buffy coat fractions were purchased from BioChemed (Winchester, VA). Blood samples from known smokers and nonsmokers were acquired from the NCI CRCHD repository (PI: Dr. Peter Shields).
Synthesis of EB-guanine standards and the corresponding 15N5 internal standards
EB-GI and EB-GII were prepared as previously reported [26, 33]. Briefly, dG (105 mg, 0.393 mmol) was reacted with 3,4-epoxy-1-butene (EB) (266 mg, 3.93 mmol) in 5 mL of glacial acetic acid at 50 °C for 5 h. The reaction mixture was precipitated with one volume of acetone and 4 volumes of ether, and the resulting white precipitate was air dried and dissolved in 1.5 mL of 1N HCl. The reaction mixtures was heated at 80 °C for 5 h to induce depurination, cooled down, and neutralized with NaOH. EB-GI and EB-GII were isolated by reverse phase HPLC on a Synergi Hydro RP 80R semipreparative column (250 mm × 10 mm, 4μ) (Phenomenex, Torrance, CA) using a gradient of water and acetonitrile at 2 mL/min. Under these conditions, EB-GI and EB-GII eluted at 22.5 and 24.1 min, respectively. Both adducts were characterized by UV spectrophotometry, 1H NMR, and MS/MS, which were consistent with literature data [26]. 15N5-EB-GI and 15N5-EB-GII were prepared analogously starting with 15N5–dG. Molar concentrations of EB-G and 15N5-EB-G standard solutions were determined by UV spectrophotometry using the molar extinction coefficient (ε) of 8030 M-1 cm-1 at 284 nm at neutral pH [33]. Isotopic purity of 15N5-EB-GI and II as determined by mass spectrometry was 99.97 and 99.93 %, respectively.
HT1080 cell culture experiments
Human fibrosarcoma cells (HT1080) were grown in Dulbecco’s modified Eagle’s media supplemented with 9% fetal bovine serum (Life technologies, Grand Island, NY). Cells were cultured in a humidified atmosphere of 5% carbon dioxide and 95% air, at 37 °C. HT1080 cells were plated into 15 cm dishes using Dulbecco’s modified Eagle’s medium containing 9% FBS and permitted to adhere overnight at 37 °C. On the following morning, cells (in duplicate) were treated with increasing concentrations of EB (0, 500 nM, 1 μM, 5 μM or 10 μM) for 3 h at 37 °C. The EC50 for EB in HT1080 cells treated with 0.25 to 50 m for 48 h was 13.8 mM as determined by the alamar blue assay (Life technologies, Grand Island, NY). Control and treated cells (N = 2) were harvested, washed with ice cold phosphate-buffered saline (PBS), and suspended in 5mL of PBS for DNA extraction as described below.
Animals and Treatment
In the first study, male and female F344 rats (N = 3 per group) were exposed to 0.5, 1.0, or 1.5 ppm for 2 weeks (6 h/day, 5 days/week) using whole-body exposure chambers at the Lovelace Respiratory Research Institute (LRRI, Albuquerque, NM) as reported previously [34].
In a separate study, female F344 rats (3 per group) were exposed to 1250 ppm BD by whole-body exposure chamber inhalation for 10 days (7 h/day) at LRRI. The animals were sacrificed either immediately at the end of the exposure period or 1, 3, or 6 days post exposure as reported previously [16]. Liver tissue was collected, flash frozen, and shipped to the University of MN on dry ice, where they were stored at − 80 °C until DNA extraction. All protocols are approved by the Institutional Animal Care and Use Committee at LRRI.
Human study subjects
Human smoker and nonsmoker blood buffy coat (white blood cells) samples were obtained from the National Cancer Institute. These samples were a part of the NCI 3ARM study supported by National Cancer Institute contract HHSN261200644002 (Laboratory Assessment of Tobacco Use Behavior and Exposure to Toxins Among Users of New Tobacco Products Promoted to Reduce Harm; PI: Peter Shields, M.D.). National Cancer Institute, Washington, DC. Nonsmoker (N = 5) and smoker subjects (N = 3) were between the ages of 18 and 65. Smokers smoked at least 10 cigarettes daily for the past year had exhaled carbon monoxide (CO) levels of > 10 ppm. The nonsmokers have smoked less than 100 cigarettes in their life time. Smoking status was confirmed through CO measures and self-reported tobacco use diaries. All subjects were in good physical and mental health. Fasting blood was collected through venipuncture at various time points during the study. Samples were stored at − 80 °C until further analysis.
DNA isolation
DNA from control and EB-treated human fibrosarcoma (HT1080) cells was isolated using standard phenol-chloroform extraction [35]. DNA concentrations were estimated by nanodrop UV spectrophotometer (Thermo Scientific, Waltham, MA), and the DNA purity was assessed from A260/A280 absorbance ratios, which was typically between 1.8 and 1.9. DNA amounts were accurately determined by dG quantitation in enzymatic hydrolysates as described previously [35, 36].
DNA from human blood samples was isolated using the manufacturer’s protocol for DNA purification from buffy coat (Qiagen, Valencia, CA) [37] with minor modifications [36]. DNA isolation from rat liver was performed using the manufacturer’s protocol for DNA purification from tissue (Qiagen, Valencia, CA). Briefly, 100–200 mg of liver tissue was homogenized in 4 mL of cell lysis buffer. Cell lysis was performed overnight following addition of 15 μL of proteinase K solution (20 mg/mL). On the following day, RNA digestion was performed by addition of 15 μL of RNase A solution (4 mg/mL) and incubation at room temperature for 2 h. Protein precipitation solution (1 mL) was added to the cell lysate, and the mixture was vortexed at a high speed for 20 s and centrifuged at 2000g for 15 min for removal of proteins. DNA was precipitated with isopropyl alcohol (5 mL) and washed twice with 1 mL of 70% ethanol in water.
Sample preparation and EB-GII enrichment (Scheme 2)
Scheme 2.
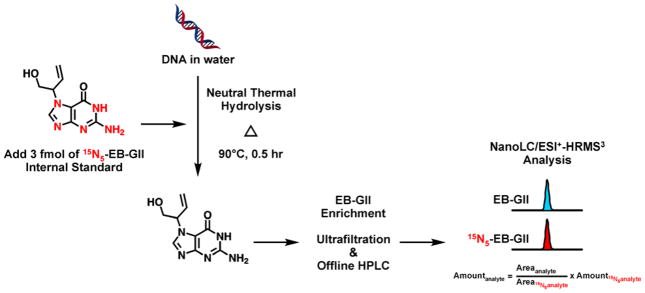
Analytical procedure for isotope dilution nanoLC/ESI+ HRMS3 analysis of EB-GII in DNA.
DNA samples (3–76 μg in water) were spiked with 3 fmol of 15N5-EB-GII internal standard and heated at 90 ºC for 0.5 h to release EB-GII adducts from the DNA backbone as free bases. Partially depurinated DNA was removed by ultrafiltration with Nanosep 10K filters (Pall Life Sciences, Ann Arbor, MI) at 5000 g for 10 min. The filtrates containing EB-GII and its internal standard were subjected to offline HPLC purification using an Agilent 1100 series HPLC equipped with a UV detector and an automated fraction collector (Agilent Technologies, Palo Alto, CA). Offline HPLC purification was carried out using Zorbax Eclipse XDB-C18 column (4.6 × 150 mm, 5 μm, from Agilent Technologies, Palo Alto, CA) eluted at flow rate of 1 mL/min with a gradient of 0.4% formic acid in Milli-Q water (A)and HPLC grade acetonitrile (B). UV absorbance was monitored at 254 nm. Solvent composition was maintained at 0% for 5 min and then linearly changed to 3% in 10 min and further to 40% B in 5 min. The solvent composition was returned to 0% acetonitrile in 5 min and held at 0% for 15 min for column equilibration. Either 2′-deoxyadenosine (dA, 0.60 nmol) or 2′-deoxythymidine (dT, 0.62 nmol on column) was added as retention time markers, which eluted at 13.2 or 18.3 min, respectively. EB-GII typically eluted at 16.4 min. HPLC fractions containing EB-GII and its internal standard (15.8 – 17.8 min, 1 mL each) were collected in 1.2 mL MS total recovery vials (Thermo Fischer Scientific, Waltham, MA), concentrated under vacuum, and re-dissolved in water (10 μL) for nano-HPLC-nanoESI+-HRMS3 analysis. Typical injection volume was 5 μL.
nanoLC/ESI+-HRMS3 analysis of EB –GII
A Nano2D-LC HPLC system (Eksigent, Dublin, CA) with 5 μL injection loop was interfaced to an LTQ Orbitrap Velos instrument equipped with a nanospray source (Thermo Fisher Scientific Corp., Waltham, MA). HPLC solvents were LC-MS grade water containing 0.01% acetic acid (A) and LC-MS grade acetonitrile containing 0.02% acetic acid (B). Samples (5 μL) were injected onto a trapping column (Symmetry C18 nanoAcquity, 0.18 × 20 mm, Waters Corp., Millford, MA) in line with a nano-LC column (0.075× 200 mm). The nano-LC column was prepared by manually packing a fused-silica emitter (New Objective, Woburn MA) with Synergi Hydro-RP, 80Å, 4 μm chromatographic packing (Phenomenex, Torrance, CA). Following sample injection (5 μL), the HPLC flow (2% B) was maintained at 1 μL/min for 5.5 min to enable sample loading onto the trapping column. The HPLC flow was then decreased to 300 nL/min and maintained at 2% B for 0.5 min. The organic phase content linearly increased to 25% B in 19 min and further to 50% B in 10 min, returned to 2% B in 2 min, and equilibrated for 7 min. Under these conditions, EB-GII eluted as a sharp peak at 20 min.
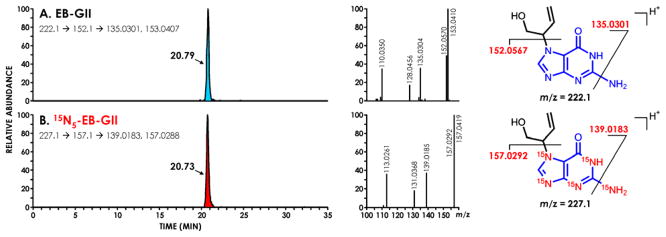
HPLC-MS3 analyses were conducted in the nanoESI+ mode using an LTQ Orbitrap Velos instrument (Thermo Scientific, Waltham, MA). Typical instrument settings included the spray voltage at 2.0 kV, capillary temperature at 350 °C, and S-Lens RF level at 40%. MS analysis was performed by fragmenting [M + H]+ ions of EB-GII (m/z 222.1) via collision induced dissociation (CID) in the linear ion trap, with a normalized collision energy set at 25 units and the isolation width of 1.0 amu. The resulting MS/MS fragment ions at m/z 152.1 corresponding to protonated guanine [Gua + H]+ were subjected to further fragmentation in the high collision dissociation (HCD) cell using nitrogen as collision gas, normalized collision energy of 75 units, and an isolation width of 1.0 amu. The resulting MS3 fragment ions were detected in the mass range of m/z 50 to m/z 270 using the Orbitrap mass analyzer at a resolution of ~ 25,000. EB-GII was quantified using extracted ion chromatograms from the combined signal of m/z 135.0301 ([Gua – NH3]+) and m/z 153.0407 ([Gua – NH3 + H2O]+) at a mass tolerance of 5 ppm. The MS3 fragments at m/z 153.0407 ([Gua – NH3 + H2O]+) correspond to the adduction of water to m/z 135.0301 ([Gua – NH3]+) in the collision cell [38]. The 15N5 labeled internal standard ([15N5]-EB-GII) was quantified using an analogous MS3 scan event consisting of fragmentation of m/z 227.1 ([M + H]+) to m/z 157.1 [15N5-Gua + H]+ and further to m/z 139.0183 ([15N5-Gua – NH3]+). Extracted ion chromatograms corresponding to the sum of m/z 139.0183 ([15N5-Gua – NH3]+) and m/z 157.0288 ([15N5-Gua – NH3 + H2O]+) at 5 ppm were generated and used for quantitation (Figure 1). A full scan event was also performed over the mass range of m/z 100–500 at a resolution of 7500 to monitor for any co-eluting matrix components. EB-GII amounts in DNA were expressed as adduct numbers per 108 normal nucleotides.
Figure 1.
Nano-HPLC-nanoESI+-HRMS3 extracted ion chromatograms and MS3 spectra of synthetic EB guanine II (0.1 fmol) (A) and [15N5]-EB guanine II (5 fmol) (B).
NanoLC/ESI+-HRMS3 standard curves were constructed by analyzing aqueous solutions containing fixed amounts of 15N5-EB-GII (5 fmol) and increasing amounts of EB-GII (0.1, 0.5, 1, 3, 5, and 10.0 fmol) (in triplicate ), followed by regression analysis of the actual and the observed amounts of EB-GII (Figure S-2). 5 μL injections were made out of a 25 μL sample volume. Solvent blanks were periodically injected to monitor for any potential analyte carry-over.
Method validation
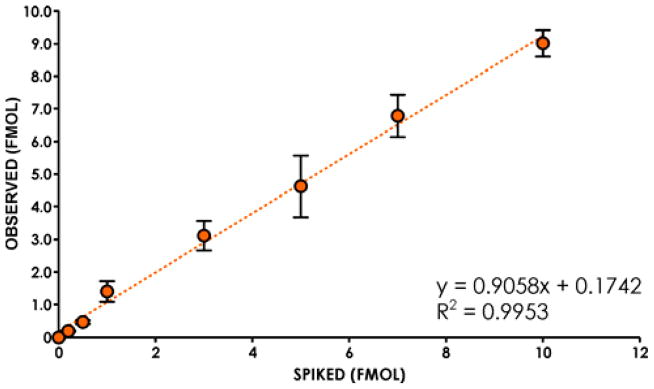
DNA isolated from unexposed human leukocyte DNA (150 μg aliquots, in triplicate) was spiked with fixed amount of 15N5-EB-GII (3 fmol, internal standard) and increasing amounts of EB-GII (0, 0.2, 0.5, 1, 3, 5, 7 or 10 fmol). Samples were processed by neutral thermal hydrolysis, ultrafiltration, and off-line HPLC as described above and subjected to nanoLC/ESI+-HRMS3 analysis. The observed amounts of EB-GII were plotted against the theoretical values, followed by regression analysis (Figure 2).
Figure 2.
Nano-HPLC-nanoESI+-HRMS3 method validation: correlation between the spiked and the observed amounts of EB-GII spiked into blank DNA. DNA isolated from nonsmoker blood leukocytes (150 μg) was spiked with 0, 0.2, 0.5, 1, 3, 5, 7 or 10 fmol of EB-GII and 3 fmol of 15N5- EB-GII (internal standard), followed by sample processing and nano-HPLC-nanoESI+-HRMS3 analysis.
Determination of method LOD, LOQ, precision, and accuracy
The LOD values of the quantitative method for EB-GII were determined by spiking blank human DNA (150 μg) with increasing amounts of EB-GII (0, 0.05, 0.1, or 0.2 fmol) and a fixed amount of 15N5-EB-GII (3 fmol), followed by sample processing and nanoLC/ESI+-HRMS3 analysis by standard methodology. The LOD value was determined as the analyte amount that consistently produced signal-to-noise ratios above 3. The limit of quantitation was defined as minimum analyte amount that produced a coefficient of variation less than 15% and a signal-to-noise ratio (S/N) greater than 10.
To evaluate the inter-day and intra-day accuracy and precision of the new method, EB-GII (0.2 fmol) and 15N5-EB-GII (3.0 fmol) were spiked into blank human DNA (150 μg). Samples were processed as described above and analyzed three times per day on three consecutive days. Method accuracy was calculated from the equation (Am/Aa × 100%), where Am is the measured amount of EB-GII and Aa is the actual analyte amount added.
Results and Discussion
Because of their critical role in cancer development, DNA adducts represent mechanism-based biomarkers of carcinogen exposure, and their quantitation is particularly useful for cancer risk assessment. DNA adducts are also valuable in mechanistic studies linking tumorigenic effects of environmental and industrial carcinogens to specific electrophilic species generated from their metabolism. As discussed above, BD is among the most important industrial and environmental chemicals classified as known carcinogens [39, 40]. Humans can be exposed to BD in an occupational setting at BD monomer/polymer industries [11] or as a result of inhaling cigarette smoke [9], automobile exhaust [8], and smoke from cooking and wood fires [10]. This is a cause of concern because of the established carcinogenicity of BD [4–7].
The long term goal of this work is to develop sensitive biomarkers of human exposure to BD. We recently reported an isotope dilution accurate mass spectrometric method for another BD-DNA adduct, N7-(2,3,4-trihydroxybut-1-yl)-guanine (N7-THBG), which was detected in leukocyte DNA of smokers, nonsmokers, and occupationally exposed workers [36]. Unexpectedly, N7-THBG was also observed in samples from individuals with no known exposure to BD, and no significant decrease in N7-THBG levels was observed upon smoking cessation [36]. Therefore, THBG may be formed endogenously and does not accurately reflect human exposure to BD.
In an effort to develop a new BD-specific DNA biomarker, we turned our attention to structurally analogous EB-G adducts (Scheme 1). EB-GI and EB-GII are formed upon N7-guanine alkylation by 3,4-epoxybut-1-ene (EB). Because EB is formed in lower amounts than 3,4-epoxy-1,2-butanediol (EBD), in vivo concentrations EB-GI and EB-GII adducts are approximately 10-fold lower than those of THBG following exposure to BD [41], calling for a highly sensitive methodology.
Our method for quantitative analysis of EB-G adducts in vivo starts with DNA extraction from cells or tissues (Scheme 2). DNA purity is estimated by UV spectrophotometry (A 260/280 ratios) to minimize any contamination with cellular proteins. DNA samples (7–76 μg) are spiked with isotopically labeled internal standard (15N5-EB-GII) to account for any analyte loss during sample workup and to allow for absolute quantification. Since N7-guanine alkylation generates a positive charge on the adducted base and destabilizes the N-glycosidic bond, EB-G adducts can be selectively released from the DNA backbone as free bases by neutral thermal hydrolysis (Scheme 2) [41, 42]. This step was optimized upon analyzing EB-treated calf thymus DNA. A range of depurination conditions were tested, including heating at 90 °C for 0.5 h (pH 6.8), 70 °C for 1 h (pH 6.8), and acidic thermal hydrolysis at 90 °C for 0.5 h (0.1N HCl). Since all three conditions were equally effective at releasing EB-G adducts from the DNA backbone (not shown), neutral thermal hydrolysis at 90 °C for 0.5 h in water was selected to minimize the depurination of unmodified nucleobases. Following ultrafiltration to remove partially depurinated DNA, EB-GII adducts were enriched by offline HPLC. Retention time markers (dT or dA) were added to account for any sample-dependent retention time shifts. Under our HPLC conditions, dA, EB-GI, EB-GII, and dT typically eluted at 13.2, 15.3, 16.4, and 18.3 min, respectively. In our experience, offline HPLC purification is the best option for isolating trace amounts of DNA adducts from DNA hydrolysates prior to LC-MS analysis because it affords nearly quantitative analyte recovery, can be readily automated, and avoids the introduction of solid phase particles which can clog nano HPLC columns [43]. However, cross-contamination and analyte carryover can be a serious problem, so multiple HPLC blanks must be introduced throughout the analysis.
NanoLC/ESI+-HRMS3 method development
Our ultimate goal was to develop a quantitative method sensitive enough to detect EB-G adducts in tissues of laboratory animals exposed to sub-ppm levels of BD and in leukocyte DNA of smokers and occupationally exposed individuals. NanoHPLC-nanospray HPLC-MS methodology was employed because of its enhanced sensitivity as compared to conventional capillary LC-MS. Nanospray ionization is more efficient than conventional electrospray because of an improved ionization efficiency and an increased ion transport from the source into the mass spectrometer [44]. A number of stationary HPLC phases were tested, including Zorbax SB-C18 (Agilent Technologies), Hypercarb (Phenomenex), Luna C18 (Phenomenex), Synergi Hydro- RP 80Å (Phenomenex), and Synergi Polar-RP (Phenomenex). These solid phases were manually packed into commercial fused-silica Self-Pack PicoFrit emitters (200 mm x 75 μm, New Objective), with a 15 μm tip orifice diameter. The best results in terms of analyte retention and HPLC peak shape were obtained when using a Synergi Hydro-RP column eluted with a gradient of 0.01% acetic acid in water (A) and 0.02% acetic acid in acetonitrile (B) (Figure 1) This system has afforded a good EB-GII peak shape (Peak Asymmetry factor=1.16, tailing factor = 1.08), along with good retention time (RT 20.7 min) and theoretical plates (N) close to 40000, without any co-eluting peaks (Figure 1).
Our initial method development efforts have attempted to employ nanoHPLC-ESI-MS/MS on a triple quadrupole mass spectrometer. However, preliminary experiments with EB-G I and EB-G II pure standards spiked into synthetic DNA indicated that the sensitivity of this approach was insufficient for BD-DNA adduct detection in human samples (Figure S-1A). Other published HPLC-ESI-MS/MS methods for EB-guanine adducts [41] similarly reported moderate sensitivity for this analyte (typical LOD, 0.5 adducts/106nucleotides). To achieve detection limits in the low fmol to amol range (1 per 108–1 per 109 nucleotides) as required for our in vivo studies, we employed nanoLC/ESI+-HRMS3 methodology on an Orbitrap Velos mass spectrometer. We and others have recently reported the use of high resolution mass spectrometry for DNA adduct analysis in complex samples and have shown that it dramatically reduces the matrix background, leading to greatly improved signal to noise ratios [37, 45, 46].
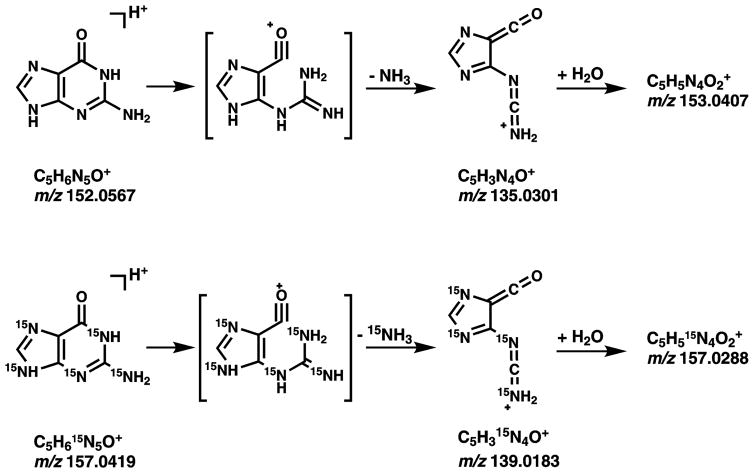
An LTQ Orbitrap Velos mass spectrometer was operated in the high resolution MS3 scan mode to allow for highly selective detection of EB-GII adducts in a complex biological matrix. Protonated molecules of the analyte were trapped and fragmented in the linear ion trap (LTQ), and specific MS2 fragments were axially ejected, fragmented in the HCD cell, and collected in a C-shaped ion trap (C-Trap) to be analyzed in the Orbitrap for accurate mass analysis. Initial fragmentation of protonated molecules of EB-GII and 15N5-EB-GII (m/z 222.1 [M + H]+ → m/z 152.1 [Gua + H]+ and m/z 227.1 [15N5-M + H]+ → m/z 157.1 [15N5-Gua + H]+ ) was performed in the linear ion trap via CID, while subsequent fragmentation (m/z 152.1 [Gua + H]+ → m/z 135.0301 [Gua – NH3]+, 153.0407 [Gua – NH3+ H2O]+) and m/z 157.1 [15N5-Gua + H]+ → m/z 139.0183 ([15N5-Gua – NH3]+), 157.0288 (15N5-Gua – 15NH3 + H2O) was performed in the HCD cell (Scheme 3). The ions at 153.0407 [Gua – NH3+ H2O]+ are generated via neutral gain of H2O by [Gua – NH3]+ ions (Scheme 3), a process that have been shown to takes place in the MS collision cell due to the presence of residual water [38]. MS3 fragment ions were analyzed in the accurate mass mode over a range m/z 50–270 at a resolution of ~ 25,000. We found that the MS3 scan mode afforded better signal to noise ratios as compared to the MS2 due to its selectivity for the analyte of interest in the presence of co-eluting contaminant peaks (Figure S-1B). Using nanoLC/ESI+-HRMS3 methodology, the sensitivity for EB-G adducts was dramatically improved as compared to standard SRM on a triple quadrupole mass analyzer (Compare Figures S-1A and S-1B), with excellent S/N ratios for the low and sub fmol analyte amounts. As an additional benefit, MS3 spectra are available for each sample, providing additional confirmation of analyte identity. Quantitation is based on peak areas corresponding to the analyte and its internal standard. Standard curves obtained by nanoLC/ESI+-HRMS3 analysis of known amounts of pure standards of EB-G and its 15N5-labeled internal standard are given in the supplementary Figure S-2.
Scheme 3.
Dissociation scheme to explain the formation of fragment ions at 153.0407 [Gua - NH3 + H2O]+. Adopted from [38].
Our initial studies have attempted to quantify both regioisomers of the adduct, EB-GI and EB-GII (Scheme 1). Under our offline HPLC conditions, pure standards of EB-GI and EB-GII eluted as sharp peaks well resolved from each other (not shown). However, when the two analytes were spiked in synthetic oligodeoxynucleotide or into blank human DNA (150 μg), processed as described above, and subjected to nanoLC/ESI+-HRMS-SRM analysis, a co-eluting peak was observed at similar HPLC retention time as EB-GI (Figure S-3). Our efforts to separate EB-GI from this interfering impurity under various chromatographic conditions (a range of HPLC stationary phases, HPLC gradients, and HPLC buffers such as 0.05% formic acid, 5 mM ammonium acetate buffer (pH 6.8) and 0.1% formic acid with a gradient of methanol or acetonitrile as organic phase) were not successful. Although the co-elute signal was somewhat decreased when narrowing the precursor ion (m/z 222.1) isolation width from 3.0 amu to 1.0 amu, this also led to a significant loss of sensitivity for the analyte (not shown). MS2 experiments have revealed that the co-eluting impurity from sample matrix had a different MS2 fragmentation pattern as compared to authentic EB-GI, but unfortunately shared the same major fragment ion at m/z 152.0567 (Figure S3). Our efforts to eliminate the interfering peak using MS3 also proved unsuccessful and the co-eluting impurity interfered with accurate analysis of EB-GI (results not shown). We therefore focused our efforts on EB-GII (Scheme 1), which is formed upon nucleophilic attach of N7-guanine at an internal carbon of EB and is produced in similar amounts as its regioisomer [41].
NanoLC/ESI+-HRMS3 Method Validation
The newly developed method was validated by analyzing samples prepared by spiking known amounts of EB-GII (0.2 – 10 fmol) and 3 fmol of 15N5-EB-GII internal standard into 150 μg of blank human buffy coat DNA. Samples were analyzed by the methodology described above. An excellent correlation (R2 = 0.9953) was observed between the spiked and the observed amounts of EB-GII in the targeted sample matrix analysis (Figure 2). Method accuracy and interday/intraday precision were determined by analyzing replicate samples of EB-GII (0.2 fmol) spiked into blank human DNA (see example in Figure S-4). The accuracy of the analytical method for 0.2 fmol spiked into 150 μg of blank human DNA was calculated as 92.9 ± 7.19 % (N = 9), while the interday and intraday precision were less than 8% RSD (Table 1). In order to evaluate the method’s sensitivity (LOD), aliquots of blank human DNA (150 μg each) were spiked with known amounts of EB-GII standard (0, 0.05, 0.1 or 0.2 fmol), followed by thermal hydrolysis and sample processing as described above (Scheme 2). The nanoLC/ESI+-HRMS3 limit of detection for EB-GII was determined as 0.05 fmol in 150 μg of DNA (0.1 adducts/109 nucleotides), which gave the signal-to-noise ratio ≥3. No EB-GII was detected in blank human DNA derived from blood leukocytes of a nonsmoker, confirming that there was no artifactual formation of EB-GII during the sample preparation and analysis. The method’s limit of quantitation was defined as the lowest amount of EB-GII spiked into blank human DNA (150 μg) that afforded the signal-to-noise ratios of >10 and intra/inter day precision within 15% CV. We found that the LOQ value of our LC-MS3 method for EB-guanine II was 0.2 fmol analyte in 150 μg of DNA, corresponding to 0.4 adducts/109 nucleosides (see Figure S-4).
Table 1.
Accuracy and precision results for NanoLC/ESI+ HRMS3 analysis of EB-GII (0.2 fmol) spiked into 150 μg of blank human DNA.
| Day 1 | Mean | 0.17 |
| RSD (%) | 3.75 | |
| Accuracy(%) | 86.0 | |
| N | 3 | |
|
| ||
| Day 2 | Mean | 0.18 |
| RSD (%) | 1.23 | |
| Accuracy(%) | 91.8 | |
| N | 3 | |
|
| ||
| Day 3 | Mean | 0.20 |
| RSD (%) | 5.29 | |
| Accuracy(%) | 100.8 | |
| N | 3 | |
|
| ||
| Interday | Mean | 0.18 |
| RSD (%) | 7.74 | |
| Accuracy(%) | 92.9 | |
| N | 9 | |
EB–GII quantitation in Human Cell Culture
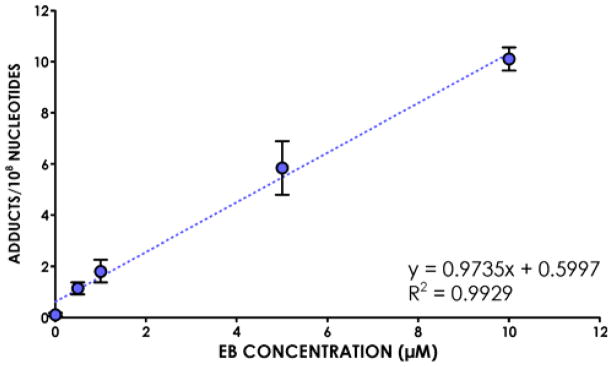
The applicability of the new HPLC-MS3 analytical method for EB-GII was initially tested by quantifying these adducts in human fibrosarcoma (HT1080) cells treated with increasing concentrations of EB (0.5–10 μM) for 3 h. These concentrations are well below the EC50 of EB in HT1080 cells (13.8 mM). Following DNA extraction, EB-GII adducts were released by neutral thermal hydrolysis and analyzed by nanoLC/ESI+-HRMS3 as described above. Adduct concentrations in cells treated with 0.5 μM –10 μM DEB increased in a concentration-dependent manner from 1.15±0.23 to 10.11±0.45 adducts/108 nucleotides (Figure 3).
Figure 3.
Concentration-dependent formation of EB-GII adducts in HT1080 cells treated with increasing amounts of EB (0.5–10 μM).
EB –GII quantitation in rat liver tissue DNA
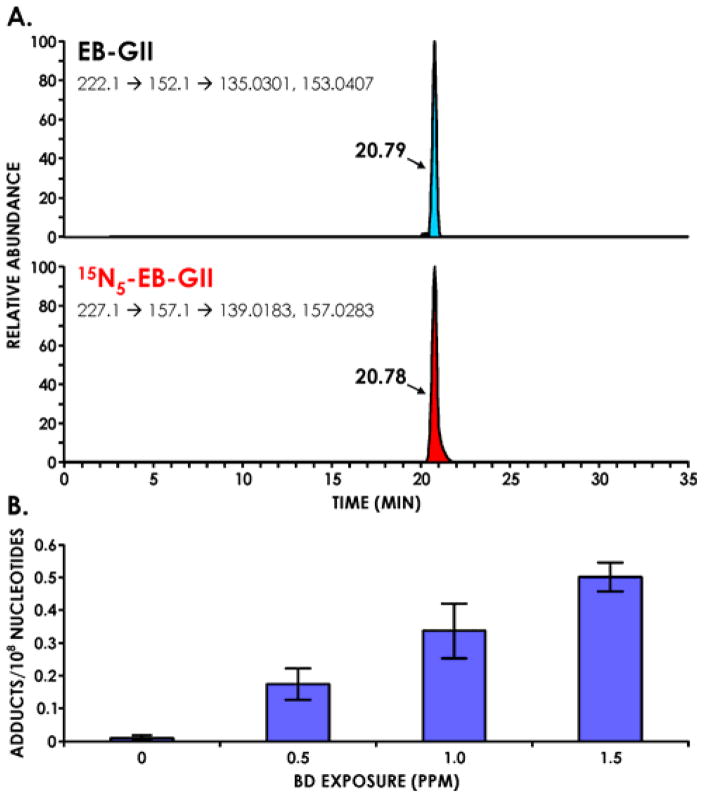
The new method was next used to quantify EB-GII DNA adducts in liver tissue DNA of F344 rats exposed to sub ppm concentrations of BD (0.5 –1.5 ppm). According to literature reports, laboratory rats are a better animal model of human exposure to BD than laboratory mice due to interspecies similarities in the metabolic pathways [47]. We chose low to sub-ppm exposures because this concentration range is comparable to occupational BD exposures in polymer or monomer industries [11]. NanoLC/ESI+-HRMS3 analyses of EB-GII in liver DNA of BD-exposed rats have revealed prominent analyte peaks with little to no background noise (Figure 4A). A dose dependent increase in adduct amounts was observed in animals treated with higher BD concentrations, with EB-GII numbers changing from 0.17 ± 0.05 adducts/108 nucleotides following 0.5 ppm exposure to 0.33 ± 0.08 adducts/108 nucleotides following 1.0 ppm exposure, and further to 0.50 ± 0.04 adducts/108 nucleotides following exposure to 1.5 ppm BD (Figure 4B). No EB-GII adducts were detected in control animals exposed to ambient air only.
Figure 4.
A. Representative extracted ion chromatogram for nano-HPLC-nanoESI+-HRMS3 analysis of EB-GII adducts in liver DNA of a laboratory rat exposed to 1.0 ppm BD by inhalation for 2 weeks. Liver DNA (53.3 μg) was spiked with 15N5-EB-GII (internal standard for quantitation) and subjected to neutral thermal hydrolysis, sample processing, and nano-HPLC-nanoESI+-HRMS3 analysis on an Obitrap Velos mass spectrometer. B. Concentration-dependent formation of EB-GII adducts in liver DNA of laboratory rats exposed to low ppm (0.5, 1.0, 1.5 ppm) concentrations of BD.
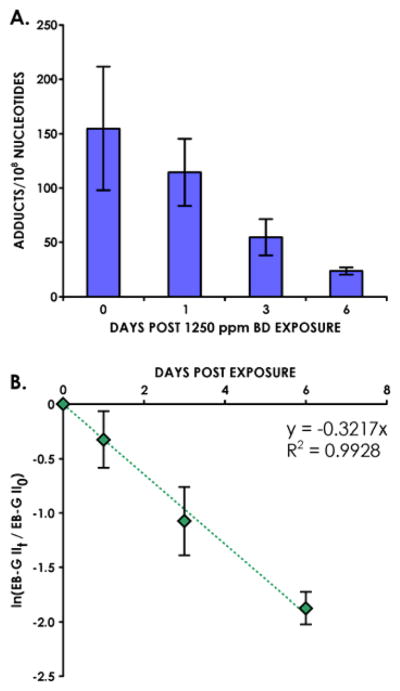
The new method was further applied to determine the in vivo half-lives of EB-GII adducts in liver of laboratory rats exposed to 1250 ppm BD. Only 7 μg of DNA was used in this case due to the high adduct levels in these samples. EB-GII adduct concentrations in rat tissues gradually decreased 1, 3 and 6 days post exposure to BD (Figure 5A). Data processing via first order kinetics analysis yielded the EB-GII half-life in rat liver DNA as 2.20 ± 0.12 days (Figure 5B), which is significantly shorter than the half-life of structurally analogous N7-THBG adducts in vivo (t1/2 = 3.6–4.0 days) [16].
Figure 5.
Persistence of EB-GII adducts in liver DNA of rats exposed to1250 ppm BD by inhalation (A) and first order kinetic analysis for estimation of adduct half-life in vivo (B).
Attempted EB –GII quantitation in human blood leukocyte DNA
To test the ability of the new method to detect BD-DNA adducts in humans, it was applied to blood leukocyte DNA of confirmed smokers (N = 8). Smokers are exposed to BD due to its relatively high concentrations in cigarette smoke (8.5–48.2 μg/cigarette) [9]. Although we were able to successfully detect EB-GII adducts in human DNA (Figure S-5), adduct amounts were below the limit of quantitation of our method (0.4 adducts/109 nucleotides). Unfortunately, DNA amounts could not be increased due to the limited human sample availability. Furthermore, our in vivo persistence data (Figure 5) suggest that EB-GII adducts are rapidly released from the DNA backbone by spontaneous hydrolysis and/or active repair. Our current efforts are to develop a nanoLC/ESI+-HRMS3 methodology for EB-GII adducts in human urine, which is readily available, but will require additional sample cleanup steps to remove salts and other polar matrix compounds prior to analysis. Our final goal is to develop analytical methodology that has adequate sensitivity, accuracy, and precision for quantitation of EB-G II adducts in human populations.
Conclusions
In conclusion, sensitive, accurate, and specific nanoLC/ESI+-HRMS3 isotope dilution methodology has been developed for accurate and precise quantitation of BD-specific EB-GII adducts in vivo. The applicability of this method was demonstrated by quantitation of EB-GII adducts in human fibrosarcoma cells exposed to low micromolar concentrations of EB and in liver DNA of laboratory rats exposed to sub-ppm concentration of BD, which mimic occupational exposure in humans. The method had adequate sensitivity to quantify EB-GII DNA adducts in human leukocyte DNA, provided that that adequate DNA amounts are available for analysis. We conclude that nanoLC/ESI+-HRMS3 methodology holds a great promise in quantitative analyses of trace levels of DNA adducts in human and animal samples due to an increased sensitivity, specificity, and detailed structural confirmation from MS3 spectra.
Supplementary Material
Acknowledgments
Funding for this work is supported by a Program Project Grant from the National Cancer Institute (1P01 CA138338). We thank Professor Vernon Walker (University of Vermont) for conducting the animal inhalation studies. The shared mass spectrometry resources of the Masonic Cancer Center are supported in part by Cancer Center Support Grant CA-77598 and the Orbitrap Velos mass spectrometer was purchased using NIH Shared Instrumentation Grant S10-RR-024618. We thank the National Cancer Institute for providing human smoker and nonsmoker buffy coat samples from NCI 3ARM study and its activities were supported by National Cancer Institute contract HHSN261200644002 (Laboratory Assessment of Tobacco Use Behavior and Exposure to Toxins Among Users of New Tobacco Products Promoted to Reduce Harm; PI: Peter Shields, M.D.). We are grateful to Bob Carlson for preparing figures for this manuscript.
Abbreviations
- BD
1,3-butadiene
- EB
3,4-epoxy-1-butene
- EBD
1,2-dihydroxy-3,4-epoxybutane
- DEB
1,2,3,4-diepoxybutane
- EB-GI
N-7-(2-hydroxy-3-buten-1-yl) guanine
- EB-GII
N-7-(1-hydroxy-3-buten-2-yl) guanine
- N7-THBG
N7-(2,3,4-trihydroxybut-1-yl) guanine
- nanoHPLC-nanoESI+-HRMS3
nanoflow high performance liquid chromatography nano electrospray ionization high resolution tandem mass spectrometry in positive mode
- SPE
solid-phase extraction
- LOD
limit of detection
- LOQ
limit of quantitation
Reference List
- 1.Lewtas J. Airborne carcinogens. Pharmacol Toxicol. 1993;72:S55–S63. doi: 10.1111/j.1600-0773.1993.tb01670.x. [DOI] [PubMed] [Google Scholar]
- 2.Dayan AD. Carcinogenicity and drinking water. Pharmacol Toxicol. 1993;72(Suppl 1):108–115. doi: 10.1111/j.1600-0773.1993.tb01678.x. [DOI] [PubMed] [Google Scholar]
- 3.Abnet CC. Carcinogenic food contaminants. Cancer Investigation. 2007;25:189–196. doi: 10.1080/07357900701208733. [DOI] [PMC free article] [PubMed] [Google Scholar]
- 4.Owen PE, Glaister JR, Gaunt IF, Pullinger DH. Inhalation toxicity studies with 1,3-butadiene. 3. Two year toxicity/carcinogenicity study in rats. Am Ind Hyg Assoc J. 1987;48:407–413. doi: 10.1080/15298668791384959. [DOI] [PubMed] [Google Scholar]
- 5.Melnick RL, Huff J, Chou BJ, Miller RA. Carcinogenicity of 1,3-butadiene in C57BL/6 x C3H F1 mice at low exposure concentrations. Cancer Res. 1990;50:6592–6599. [PubMed] [Google Scholar]
- 6.Himmelstein MW, Acquavella JF, Recio L, Medinsky MA, Bond JA. Toxicology and epidemiology of 1,3-butadiene. Crit Rev Toxicol. 1997;27:1–108. doi: 10.3109/10408449709037482. [DOI] [PubMed] [Google Scholar]
- 7.Agency for Toxic Substances and Disease Registry (ATSDR) [accessed July 26, 2013];Public Health Statement for 1,3-Butadiene page. http://www.atsdr.cdc.gov/PHS/PHS.asp?id=457&tid=81.
- 8.Neligan RE. Hydrocarbons in the Los Angeles atmosphere. A comparison between the hydrocarbons in automobile exhaust and those found in the Los Angeles atmosphere. Arch Environ Health. 1962;5:581–591. doi: 10.1080/00039896.1962.10663334. [DOI] [PubMed] [Google Scholar]
- 9.Counts ME, Hsu FS, Tewes FJ. Development of a commercial cigarette “market map” comparison methodology for evaluating new or non-conventional cigarettes. Regul Toxicol Pharmacol. 2006;46:225–242. doi: 10.1016/j.yrtph.2006.07.002. [DOI] [PubMed] [Google Scholar]
- 10.Gustafson P, Barregard L, Strandberg B, Sallsten G. The impact of domestic wood burning on personal, indoor and outdoor levels of 1,3-butadiene, benzene, formaldehyde and acetaldehyde. J Environ Monit. 2007;9:23–32. doi: 10.1039/b614142k. [DOI] [PubMed] [Google Scholar]
- 11.United States Department of Labor. [accessed July 26, 2013];Occupational Health and Safety Administration Standards for 1,3-Butadiene Page. https://www.osha.gov/SLTC/butadiene/index.html#standards.
- 12.Fajen JM, Roberts DR, Ungers LJ, Krishnan ER. Occupational exposure of workers to 1,3-butadiene. Environ Health Perspect. 1990;86:11–18. doi: 10.1289/ehp.908611. [DOI] [PMC free article] [PubMed] [Google Scholar]
- 13.Vacek PM, Albertini RJ, Sram RJ, Upton P, Swenberg JA. Hemoglobin adducts in 1,3-butadiene exposed Czech workers: female-male comparisons. Chem Biol Interact. 2010;188:668–676. doi: 10.1016/j.cbi.2010.06.017. [DOI] [PubMed] [Google Scholar]
- 14.Duescher RJ, Elfarra AA. Human liver microsomes are efficient catalysts of 1,3-butadiene oxidation: evidence for major roles by cytochromes P450 2A6 and 2E1. Arch Biochem Biophys. 1994;311:342–349. doi: 10.1006/abbi.1994.1246. [DOI] [PubMed] [Google Scholar]
- 15.Goggin M, Swenberg JA, Walker VE, Tretyakova N. Molecular dosimetry of 1,2,3,4-diepoxybutane-induced DNA-DNA cross-links in B6C3F1 mice and F344 rats exposed to 1,3-butadiene by inhalation. Cancer Res. 2009;69:2479–2486. doi: 10.1158/0008-5472.CAN-08-4152. [DOI] [PMC free article] [PubMed] [Google Scholar]
- 16.Goggin M, Sangaraju D, Walker VE, Wickliffe J, Swenberg JA, Tretyakova N. Persistence and repair of bifunctional DNA adducts in tissues of laboratory animals exposed to 1,3-butadiene by inhalation. Chem Res Toxicol. 2011;24:809–817. doi: 10.1021/tx200009b. [DOI] [PMC free article] [PubMed] [Google Scholar]
- 17.Park S, Anderson C, Loeber R, Seetharaman M, Jones R, Tretyakova N. Interstrand and intrastrand DNA-DNA cross-linking by 1,2,3,4-diepoxybutane: role of stereochemistry. J Am Chem Soc. 2005;127:14355–14365. doi: 10.1021/ja051979x. [DOI] [PubMed] [Google Scholar]
- 18.Oe T, Kambouris SJ, Walker VE, Meng Q, Recio L, Wherli S, Chaudhary AK, Blair IA. Persistence of N7-(2,3,4-trihydroxybutyl)guanine adducts in the livers of mice and rats exposed to 1,3-butadiene. Chem Res Toxicol. 1999;12:247–257. doi: 10.1021/tx980193s. [DOI] [PubMed] [Google Scholar]
- 19.Tretyakova NY, Chiang SY, Walker VE, Swenberg JA. Quantitative analysis of 1,3-butadiene-induced DNA adducts in vivo and in vitro using liquid chromatography electrospray ionization tandem mass spectrometry. J Mass Spectrom. 1998;33:363–376. doi: 10.1002/(SICI)1096-9888(199804)33:4<363::AID-JMS643>3.0.CO;2-E. [DOI] [PubMed] [Google Scholar]
- 20.Kotapati S, Maddukuri L, Wickramaratne S, Seneviratne U, Goggin M, Pence MG, Villalta P, Guengerich FP, Marnett L, Tretyakova N. Translesion synthesis across 1,N6-(2-hydroxy-3-hydroxymethylpropan-1,3-diyl)-2′-deoxyadenosine (1,N6-gamma-HMHP-dA) adducts by human and archebacterial DNA polymerases. J Biol Chem. 2012;287:38800–38811. doi: 10.1074/jbc.M112.396788. [DOI] [PMC free article] [PubMed] [Google Scholar]
- 21.Carmical JR, Zhang M, Nechev L, Harris CM, Harris TM, Lloyd RS. Mutagenic potential of guanine N2 adducts of butadiene mono- and diolepoxide. Chem Res Toxicol. 2000;13:18–25. doi: 10.1021/tx9901332. [DOI] [PubMed] [Google Scholar]
- 22.Steen AM, Meyer KG, Recio L. Analysis of hprt mutations occurring in human TK6 lymphoblastoid cells following exposure to 1,2,3,4-diepoxybutane. Mutagenesis. 1997;12:61–67. doi: 10.1093/mutage/12.2.61. [DOI] [PubMed] [Google Scholar]
- 23.Seo KY, Jelinsky SA, Loechler EL. Factors that influence the mutagenic patterns of DNA adducts from chemical carcinogens. Mutat Res. 2000;463:215–246. doi: 10.1016/s1383-5742(00)00047-8. [DOI] [PubMed] [Google Scholar]
- 24.Poirier MC. DNA adducts as exposure biomarkers and indicators of cancer risk. Environ Health Perspect. 1997;105(Suppl 4):907–912. doi: 10.1289/ehp.97105s4907. [DOI] [PMC free article] [PubMed] [Google Scholar]
- 25.Rundle A. Carcinogen-DNA adducts as a biomarker for cancer risk. Mutat Res. 2006;600:23–36. doi: 10.1016/j.mrfmmm.2006.05.031. [DOI] [PubMed] [Google Scholar]
- 26.Tretyakova N, Lin Y, Sangaiah R, Upton PB, Swenberg JA. Identification and quantitation of DNA adducts from calf thymus DNA exposed to 3,4-epoxy-1-butene. Carcinogenesis. 1997;18:137–147. doi: 10.1093/carcin/18.1.137. [DOI] [PubMed] [Google Scholar]
- 27.Swenberg JA, Christova-Gueorguieva NI, Upton PB, Ranasinghe A, Scheller N, Wu KY, Yen TY, Hayes R. 1,3-butadiene: cancer, mutations, and adducts. Part V: Hemoglobin adducts as biomarkers of 1,3-butadiene exposure and metabolism. Res Rep Health Eff Inst. 2000:191–210. [PubMed] [Google Scholar]
- 28.van Sittert NJ, Megens HJ, Watson WP, Boogaard PJ. Biomarkers of exposure to 1,3-butadiene as a basis for cancer risk assessment. Toxicol Sci. 2000;56:189–202. doi: 10.1093/toxsci/56.1.189. [DOI] [PubMed] [Google Scholar]
- 29.Boysen G, Georgieva NI, Bordeerat NK, Sram RJ, Vacek P, Albertini RJ, Swenberg JA. Formation of 1,2;3,4-Diepoxybutane specific hemoglobin adducts in 1,3-butadiene exposed workers. Toxicol Sci. 2011 doi: 10.1093/toxsci/kfr272. [DOI] [PMC free article] [PubMed] [Google Scholar]
- 30.Perez HL, Lahdetie J, Landin H, Kilpelainen I, Koivisto P, Peltonen K, Osterman-Golkar S. Haemoglobin adducts of epoxybutanediol from exposure to 1,3-butadiene or butadiene epoxides. Chem Biol Interact. 1997;105:181–198. doi: 10.1016/s0009-2797(97)00049-5. [DOI] [PubMed] [Google Scholar]
- 31.Boogaard PJ, van Sittert NJ, Megens HJ. Urinary metabolites and haemoglobin adducts as biomarkers of exposure to 1,3-butadiene: a basis for 1,3-butadiene cancer risk assessment. Chem Biol Interact. 2001;135–136:695–701. doi: 10.1016/s0009-2797(01)00205-8. [DOI] [PubMed] [Google Scholar]
- 32.Carmella SG, Chen M, Han S, Briggs A, Jensen J, Hatsukami DK, Hecht SS. Effects of smoking cessation on eight urinary tobacco carcinogen and toxicant biomarkers. Chem Res Toxicol. 2009;22:734–741. doi: 10.1021/tx800479s. [DOI] [PMC free article] [PubMed] [Google Scholar]
- 33.Citti L, Gervasi PG, Turchi G, Bellucci G, Bianchini R. The reaction of 3,4-epoxy-1-butene with deoxyguanosine and DNA in vitro: synthesis and characterization of the main adducts. Carcinogenesis. 1984;5:47–52. doi: 10.1093/carcin/5.1.47. [DOI] [PubMed] [Google Scholar]
- 34.Georgieva NI, Boysen G, Bordeerat N, Walker VE, Swenberg JA. Exposure-response of 1,2:3,4-diepoxybutane-specific N-terminal valine adducts in mice and rats after inhalation exposure to 1,3-butadiene. Toxicol Sci. 2010;115:322–329. doi: 10.1093/toxsci/kfq060. [DOI] [PMC free article] [PubMed] [Google Scholar]
- 35.Michaelson-Richie ED, Ming X, Codreanu SG, Loeber RL, Liebler DC, Campbell C, Tretyakova NY. Mechlorethamine-induced DNA--protein cross-linking in human fibrosarcoma (HT1080) cells. J Proteome Res. 2011;10:2785–2796. doi: 10.1021/pr200042u. [DOI] [PMC free article] [PubMed] [Google Scholar]
- 36.Sangaraju D, Villalta P, Goggin M, Agunsoye MO, Campbell C, Tretyakova N. Capillary HPLC-accurate mass MS/MS quantitation of N7-(2,3,4-trihydroxybut-1-yl)-guanine adducts of 1,3-butadiene in human leukocyte DNA. Chem Res Toxicol. 2013;26:1486–1497. doi: 10.1021/tx400213m. [DOI] [PMC free article] [PubMed] [Google Scholar]
- 37.Balbo S, Villalta PW, Hecht SS. Quantitation of 7-ethylguanine in leukocyte DNA from smokers and nonsmokers by liquid chromatography-nanoelectrospray-high resolution tandem mass spectrometry. Chem Res Toxicol. 2011;24:1729–1734. doi: 10.1021/tx200262d. [DOI] [PMC free article] [PubMed] [Google Scholar]
- 38.Tuytten R, Lemiere F, Van Dongen W, Esmans EL, Witters E, Herrebout W, Van DV, Dudley E, Newton RP. Intriguing mass spectrometric behavior of guanosine under low energy collision-induced dissociation: H2O adduct formation and gas-phase reactions in the collision cell. J Am Soc Mass Spectrom. 2005;16:1291–1304. doi: 10.1016/j.jasms.2005.03.026. [DOI] [PubMed] [Google Scholar]
- 39.Delzell E, Sathiakumar N, Hovinga M, Macaluso M, Julian J, Larson R, Cole P, Muir DC. A follow-up study of synthetic rubber workers. Toxicology. 1996;113:182–189. doi: 10.1016/0300-483x(96)03443-9. [DOI] [PubMed] [Google Scholar]
- 40.Downs TD, Crane MM, Kim KW. Mortality among workers at a butadiene facility. Am J Ind Med. 1987;12:311–329. doi: 10.1002/ajim.4700120307. [DOI] [PubMed] [Google Scholar]
- 41.Koc H, Tretyakova NY, Walker VE, Henderson RF, Swenberg JA. Molecular dosimetry of N-7 guanine adduct formation in mice and rats exposed to 1,3-butadiene. Chem Res Toxicol. 1999;12:566–574. doi: 10.1021/tx980265f. [DOI] [PubMed] [Google Scholar]
- 42.Gates KS, Nooner T, Dutta S. Biologically relevant chemical reactions of N7-alkylguanine residues in DNA. Chem Res Toxicol. 2004;17:839–856. doi: 10.1021/tx049965c. [DOI] [PubMed] [Google Scholar]
- 43.Tretyakova N, Villalta PW, Kotapati S. Mass spectrometry of structurally modified DNA. Chem Rev. 2013;113:2395–2436. doi: 10.1021/cr300391r. [DOI] [PMC free article] [PubMed] [Google Scholar]
- 44.Smith RD, Shen Y, Tang K. Ultrasensitive and quantitative analyses from combined separations-mass spectrometry for the characterization of proteomes. Acc Chem Res. 2004;37:269–278. doi: 10.1021/ar0301330. [DOI] [PubMed] [Google Scholar]
- 45.Sangaraju D, Goggin M, Walker V, Swenberg J, Tretyakova N. NanoHPLC-nanoESI(+)-MS/MS quantitation of bis-N7-guanine DNA-DNA cross-links in tissues of B6C3F1 mice exposed to subppm levels of 1,3-butadiene. Anal Chem. 2012;84:1732–1739. doi: 10.1021/ac203079c. [DOI] [PMC free article] [PubMed] [Google Scholar]
- 46.Stepanov I, Muzic J, Le CT, Sebero E, Villalta P, Ma B, Jensen J, Hatsukami D, Hecht SS. Analysis of 4-Hydroxy-1-(3-pyridyl)-1-butanone (HPB)-Releasing DNA Adducts in Human Exfoliated Oral Mucosa Cells by Liquid Chromatography-Electrospray Ionization-Tandem Mass Spectrometry. Chem Res Toxicol. 2013 doi: 10.1021/tx300282k. [DOI] [PMC free article] [PubMed] [Google Scholar]
- 47.Bond JA, Himmelstein MW, Seaton M, Boogaard P, Medinsky MA. Metabolism of butadiene by mice, rats, and humans: a comparison of physiologically based toxicokinetic model predictions and experimental data. Toxicology. 1996;113:48–54. doi: 10.1016/0300-483x(96)03426-9. [DOI] [PubMed] [Google Scholar]
Associated Data
This section collects any data citations, data availability statements, or supplementary materials included in this article.


