

Abstract
The MErcury Surface, Space ENvironment, GEochemistry, and Ranging (MESSENGER) mission to Mercury has provided a wealth of new data about energetic particle phenomena. With observations from MESSENGER's Energetic Particle Spectrometer, as well as data arising from energetic electrons recorded by the X‐Ray Spectrometer and Gamma‐Ray and Neutron Spectrometer (GRNS) instruments, recent work greatly extends our record of the acceleration, transport, and loss of energetic electrons at Mercury. The combined data sets include measurements from a few keV up to several hundred keV in electron kinetic energy and have permitted relatively good spatial and temporal resolution for many events. We focus here on the detailed nature of energetic electron bursts measured by the GRNS system, and we place these events in the context of solar wind and magnetospheric forcing at Mercury. Our examination of data at high temporal resolution (10 ms) during the period March 2013 through October 2014 supports strongly the view that energetic electrons are accelerated in the near‐tail region of Mercury's magnetosphere and are subsequently “injected” onto closed magnetic field lines on the planetary nightside. The electrons populate the plasma sheet and drift rapidly eastward toward the dawn and prenoon sectors, at times executing multiple complete drifts around the planet to form “quasi‐trapped” populations.
Keywords: Mercury magnetosphere, particle bursts, substorms, electron acceleration
Key Points
Shows where energetic particles are accelerated at Mercury
Demonstrates quasi‐trapping of energetic electrons
Answers decades‐old questions about Mercury substorms
1. Introduction
An intriguing discovery by the Mariner 10 mission as it flew by Mercury in March 1974 was that energetic particle bursts were present inside the miniature Mercury magnetosphere [Simpson et al., 1974]. The nature of the particles causing the Mariner 10 signals proved to be controversial, however. Armstrong et al. [1975] asserted that the signals in the Mariner 10 proton channels and in the high‐energy electron channels were due to pileup of much‐lower‐energy electrons rather than the nominal protons or high‐energy electrons reported by Simpson et al. What was clear was that the bursts were associated with large‐amplitude magnetic field changes that were interpreted as terrestrial‐type magnetospheric substorms [Siscoe et al., 1975; Eraker and Simpson, 1986; Baker et al., 1986]. Christon et al. [1987] compared the Mariner 10 energetic particle and magnetic field changes with measurements taken in geosynchronous orbit at Earth. They found that the Mariner 10 observations were analogous to particle injections and magnetic field dipolarization at Earth. Since the first Mariner 10 flyby of Mercury, researchers have been anxious to understand more deeply the species identification, energy spectrum, acceleration location, and transport mechanisms for energetic particles in the vicinity of Mercury.
The first encounters of the MErcury Surface, Space ENvironment, GEochemistry, and Ranging (MESSENGER) spacecraft with Mercury were brief flyby trajectories in 2008 and 2009 [see Ho et al., 2011a, 2011b]. These near‐equatorial passes occurred during the lowest solar activity conditions in the last century or more [e.g., Baker et al., 2009], and consequently, there were almost no energetic particle bursts seen during those flybys [Ho et al., 2011b]. In contrast, by the time of MESSENGER's insertion into orbit around Mercury in March 2011, the Sun had become much more active [e.g., Baker et al., 2013], and energetic electron enhancements were seen on almost every MESSENGER orbit of the planet [Ho et al., 2011a, 2012].
The studies by Ho et al. [2011a, 2011b, 2012] made use of the Energetic Particle Spectrometer (EPS) system [Andrews et al., 2007] on the MESSENGER spacecraft. The EPS was designed to distinguish between electrons and ions and also was capable of making directional measurements. The EPS detector geometric factor was sufficiently small to avoid the high‐count‐rate pileup effects that plagued the Mariner 10 measurements. Importantly, the MESSENGER science payload also included other sensors that responded to suprathermal and energetic electrons incident on the spacecraft. Notably, the X‐Ray Spectrometer [Starr et al., 2012] and the Gamma‐Ray and Neutron Spectrometer (GRNS) [Goldsten et al., 2007] instruments have been shown to have good sensitivity to electrons with energies in the range from several to a few hundred keV. The GRNS sensors were designed with very large geometric factors and responded in an omnidirectional way. These characteristics give the GRNS sensors several observational advantages for particle detection compared with the EPS system.
A thorough survey of energetic electron burst properties as observed at Mercury with the GRNS sensor system was recently provided by Lawrence et al. [2015]. The survey covered the period from orbit insertion (18 March 2011) through 31 December 2013. Although some Gamma‐Ray Spectrometer (GRS) data were presented by Lawrence et al. [2015], the primary analysis was done for electron events detected with the Neutron Spectrometer (NS). Those energetic electron events typically were observed on the NS with time resolutions of 1 s and 20 s and dominantly corresponded to incident electrons at energies greater than 20 to ~40 keV. The Lawrence et al. [2015] study identified over 2700 electron burst events and showed their temporal, spatial, and spectral behavior.
As described by Lawrence et al. [2015], the GRS system had two electron detection components. The high‐purity germanium detector was cryocooled and measured gamma rays from 50 keV to 10 MeV energies (and detected electrons directly). This system operated from orbit insertion until June 2012 (at which time the cryocooler failed). The GRS also contained a borated plastic anticoincidence shield (ACS) that surrounded the Ge detector. This ACS system responded to electrons with energies greater than 50 keV (up to several hundred keV) as they produced bremsstrahlung photons in the surrounding spacecraft material. The ACS had very high electron detection sensitivity. After the cryocooler failure, the GRS telemetry was reprogrammed (on 25 February 2013) to be devoted to the ACS detection system. This change included the addition of a high‐time‐resolution mode, which allowed for near‐continuous measurement of energetic electrons at 10 ms timing within the Mercury magnetosphere. Here we report on such high‐resolution GRS data acquired from 1 March 2013 to October 2014. This data set covers a different (but somewhat overlapping) period from that analyzed by Lawrence et al. [2015]. The use of the ACS data emphasizes observations at higher energy and higher time resolution than were emphasized by Lawrence et al. [2015].
2. Data Analysis and Event Selection
As noted above, the high‐time‐cadence data acquisition period for the GRS ACS system began after the cryocooler failure in mid‐2012. A new phase of MESSENGER orbital operation also began in April 2012 when the apoapsis of the spacecraft orbit was reduced from the original value (~15,000 km) to a lower value (~10,000 km). This change had the effect of reducing the orbital period of MESSENGER from 12 to 8 h. As described by Lawrence et al. [2015], data from the 8 h orbits showed some distinctive differences in the occurrence characteristics of energetic electron events from the 12 h orbits. In this study we use data only from March 2013 to October 2014, so that only 8 h orbits are analyzed here. Figure 1 shows a projection of all orbits examined for the 19 month period of this study onto the X‐Y plane of the Mercury solar orbital (MSO) coordinate system. In that system, which is centered on the planet, +X points toward the Sun, +Y points duskward, and +Z points northward. The figure indicates that MESSENGER sampled all longitudes (and local times) nearly uniformly.
Figure 1.
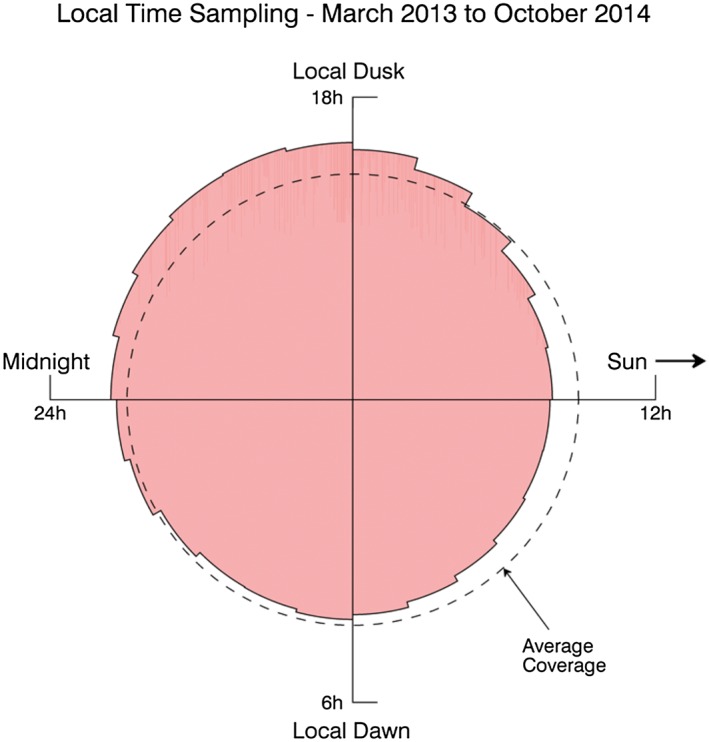
MESSENGER coverage in local time (LT) over the period of study, grouped into 1‐h bins. The radius of each bin denotes its relative coverage, and the dashed circle marks the average coverage. For this study, “average” coverage constituted 608.4 h of data accumulation. The minimum coverage (10–11 LT) was 531.2 h, and the maximum coverage (19–20 LT) was 703.7 h. Hence, MESSENGER observations were relatively uniform in local time, with a slight bias toward postdusk/premidnight.
MESSENGER data for the period 0147 to 0206 UTC on 17 March 2014 are shown in Figure 2. Figure 2a shows GRS ACS count rate data for this interval. The high time resolution of the data is evident by the “forest” of count rate peaks (at 10 ms sampling) and fluctuations ranging from near zero to approximately 1000 counts/second (c/s). This range of fluctuations constitutes an ambient background for the sensor. Remarkably, however, there are statistically significant individual spikes of up to 2000 c/s, each lasting just one or two 10 ms intervals. Two much more prominent peaks extend far above the background rate, one at ~0152 UTC and the other at ~0201 UTC. These events both have a rapid rise and then show a much slower decay lasting up to ~1 min. The count rate events in Figure 2a constitute one important class (rapid rise‐slow decay) of electron events seen on the GRS ACS and chosen for analysis in this paper. Other classes of events will be described below. The key detection criterion used in this study is that the GRS ACS counting rates rise substantially (i.e., with a signal‐to‐noise ratio greater than 4) for multiple successive 10 ms samples. Each isolated enhancement event fulfilling this amplitude criterion, grouped with any other enhancements within a 30 min time window, was counted as a separate and distinctive GRS energetic electron event [see also Lawrence et al., 2015]. Applying this criterion, 99 identifiable GRS electron enhancements were found from March 2013 to October 2014. These high count rate events constitute the data set analyzed here.
Figure 2.
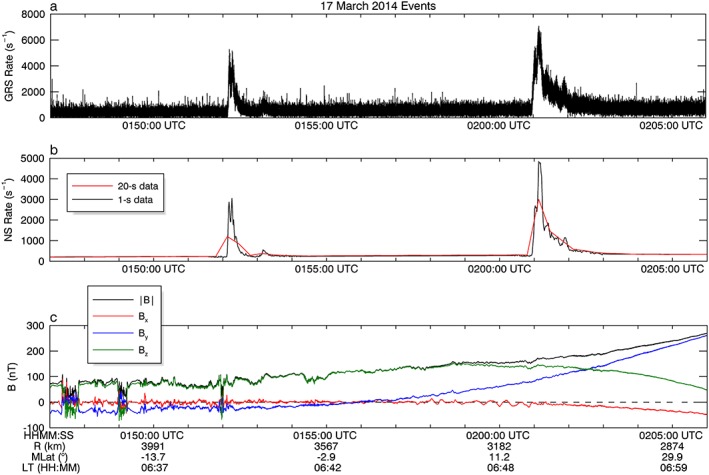
(a) High‐time‐resolution (10‐ms sampling) records from the Gamma‐Ray Spectrometer (GRS) anticoincidence shield detector on the MESSENGER spacecraft. Data are shown for the period from 0147 to 0206 UTC on 17 March 2014. (b) Data for the same time interval as in Figure 2a from the MESSENGER Neutron Spectrometer. The black trace shows data at 1‐s cadence from NS, and the red curve shows data sampled every 20 s. (c) Magnetic field data from 17 March 2014. Magnetic field components are in the MSO coordinate system.
With respect to event selection, as noted above, we initially used 30 min time windows for our event identification. Even though the timescales for Mercury's magnetospheric dynamics are short (2–3 min) [e.g., Slavin et al., 2009], many identified counting rate enhancements persisted in aggregate for longer than those “burst” times, a result that led to our use of the 30 min windows. After the initial screening, any enhancements that spanned intervals longer than 30 min were merged. Within the revamped windows, the precise start and stop times were then used to specify the event durations in this paper. Consequently, it might be more accurate to say that our study identified 99 intervals with individual or multiple electron enhancements within them. As will be shown, these event intervals have many associated acceleration and drift properties that are important to examine over and above just counting single‐flux spikes.
Note that in studying the NS data set (8 h orbit) for the period April 2012 through December 2013, Lawrence et al. [2015] identified 1920 separate energetic electron events. Their total is equivalent to an average rate of about 100 events per month. In contrast, in our analysis of GRS data given our stringent amplitude criterion, we identify on average only about five event intervals per month (99 events in 19 months). This difference means that only the strongest 5–10% of electron event intervals meet our selection criterion. Importantly, we examined for each of our selected intervals the concurrent NS data (as shown, for example, in Figure 2b). We found that >91% of our analyzed GRS events were also observed in the corresponding NS data record owing primarily to the much greater geometry factor for the GRS system. It should thus be emphasized that in this study we are looking at only the most intense energetic electron events observed by MESSENGER during the period examined.
3. Case Studies: Rapid Rise Events on 17 March 2014
As noted above and as shown in Figure 2a, one important class of energetic electron events detected by MESSENGER sensors can be characterized as count rate enhancements with a rapid rise and slow decay. Figure 2 emphasizes the point that such events seen in the GRS data (Figure 2a) are also typically seen in the NS data set (Figure 2b). Figure 2c shows the concurrently measured magnetic field data for the same period. Note that the field data (20 samples per second) are plotted as full magnetic components in MSO coordinates. Hence, the strong contributions from the dipolar magnetic field have not been suppressed in Figure 2c, and the fluctuating field components are not always prominent. Below we also show data as deviations from the modeled magnetospheric field [e.g., Korth et al., 2014].
As may be seen in Figure 2c, prior to 0150 UTC on 17 March 2014, and notably just before the energetic electron burst commencing at ~0152 UTC, the vector magnetic field B showed very large deflections (especially in the Bz component). The overall magnetic field magnitude (B) on three occasions jumped to values ≥100 nT. We interpret these field excursions as brief passages of the MESSENGER spacecraft through the local magnetopause boundary [e.g., Slavin et al., 2009], corresponding to movement of the spacecraft into the local magnetosheath. Note the strong southward (negative) values of Bz in each case (~0147:30, 0149:00, and 0151:50 UTC). This pattern means that solar wind forcing and dayside magnetic reconnection would have been very strong during this time period [DiBraccio et al., 2013]. In light of these conditions, we expect that on the Mercury nightside there was strong magnetotail reconnection along with substorm‐like activity [Slavin et al., 2010; Sundberg et al., 2012; Sun et al., 2015] and energetic particle acceleration [e.g., Baker et al., 1986; Lawrence et al., 2015].
Detailed analysis of the 0152 UTC energetic electron enhancement event supports the above interpretation of magnetopause passages. Figure 3a shows the GRS electron counting rate data on an expanded scale for the time interval 0151 to 0153 UTC. Figure 3b shows the corresponding NS data. Figures 3c–3f show, respectively, the model‐differenced X, Y, and Z components δBx, δBy, and δBz and the residual magnetic field value δB for the same time period; i.e., the field values have had a reference model field [see Korth et al., 2014] subtracted, leaving the residual field values. Minimum variance analysis of the magnetic field rotations [see DiBraccio et al., 2013] at 0151:53 and 0152:03 UTC indicates that these current sheets are rotational discontinuities, as would be expected for crossings of the magnetopause. Note by comparing electron data (Figure 3a) with field changes (Figures 3c–3f) that the energetic electron enhancement at 0152 UTC occurred very shortly after the MESSENGER spacecraft was “re‐enveloped” by the expanding Mercury magnetopause. Hence, the plasma sheet inside the magnetospheric boundary was probably transiently filled just after the magnetopause expansion with energetic electrons, and these electrons were then briefly detected by GRS after the boundary swept back over the spacecraft. Because of rapid drift of such electrons and their prompt loss by magnetopause escape or impact onto the Mercury surface, we would not expect to observe the particle enhancement for a long time inside the magnetopause.
Figure 3.
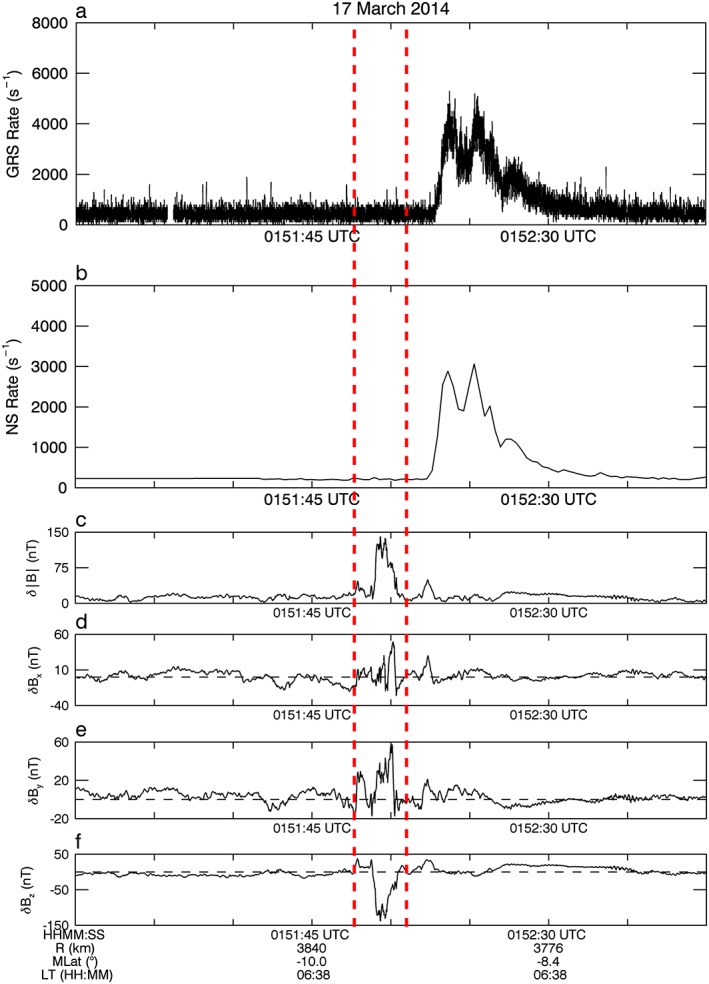
Detailed (a) GRS and (b) NS data for the period from 0151 to 0153 UTC on 17 March 2014. (c‐f) Residual magnetic field data from MESSENGER for the same period: δB, δB x, δB y, and δB z, respectively. The vertical dashed lines delineate magnetopause crossings by the spacecraft.
The second rapid rise‐slow decay event on this day occurred at ~0201 UTC. The detailed data for this event are shown in Figure 4. Note in the magnetic field data (Figures 4c–4f) that there were only modest discernible field signatures associated with the 0201 UTC electron burst. A slight possible “diamagnetic” field depression was detected just before the electron burst from 0200:50 to 0201:05 UTC, but no other major field deflections were evident. This behavior was in marked contrast to the conditions preceding the 0152 UTC event shown in Figure 3.
Figure 4.
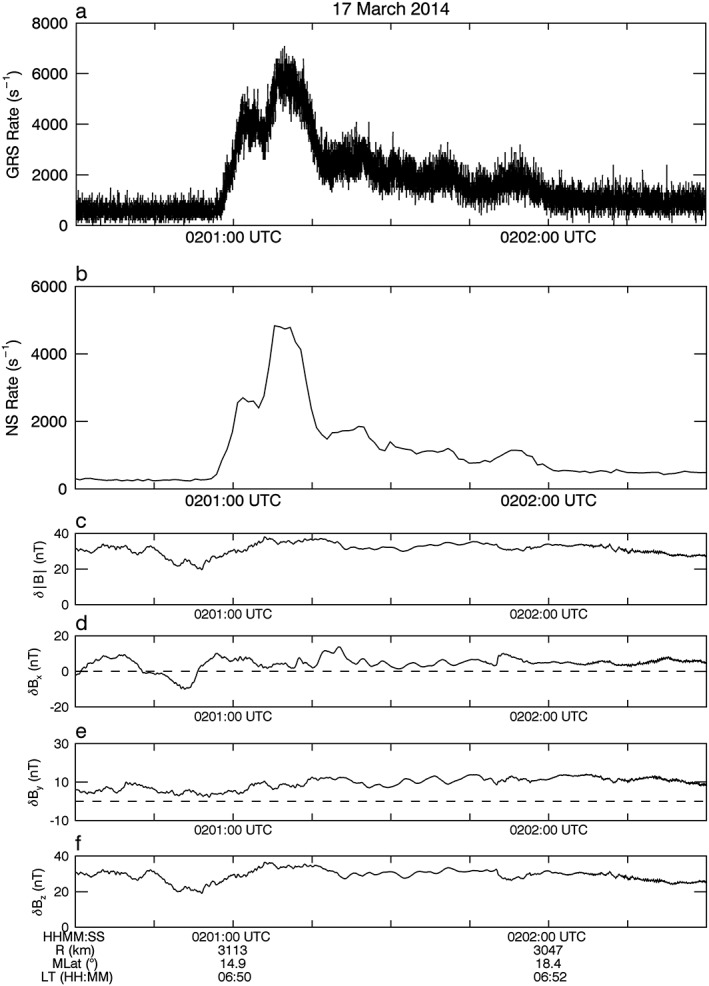
Plots similar to those of Figure 3 but for the time period from 0200:30 to 0202:30 UTC on 17 March 2014.
When examined at the high time resolution (10 ms) available with the GRS sensor, it is evident from Figure 4a that the electron enhancement actually exhibited a remarkable amount of temporal structure within the overall burst envelope. The rise of the event beginning at 0200:56 UTC occurred over a brief but discernible time span of 4–6 s. There was a second count rate peak that commenced at ~0201:06 UTC. This burst subsequently decreased rapidly at about 0201:15 UTC. Note the several seemingly periodic pulses in the electron data from ~0201:20 to at least ~0202:00 UTC.
To help clarify the periodic pulses of particles from ~0201 UTC to somewhat beyond 0202 UTC, we show in Figure 5a GRS data with a 10‐point smoothing filter applied. This slight smoothing helps reduce the counting statistical fluctuations and reveals more clearly the time structure of the pulses. From Figure 5a we see that the first rise in the overall count rate peak started at 0200:56 UTC (as noted above) but consisted of two obvious counting peaks. The first reached a maximum at ~0201:02 UTC, and the second reached a (higher) maximum at ~0201:09 UTC. Note thereafter the successive and somewhat complex count rate peaks that continued until at least 0202:00 UTC. As indicated by the tick mark sequence denoted in Figure 5a by B1–B4, the peaks starting at 0201:02 UTC fell precisely at 15 s intervals. Similarly (although somewhat less clearly), starting with the first peak at 0200:56 UTC, there can be discerned a “family” of count rate peaks (A1–A5) that also occurred at 15 s intervals. The A peaks are weaker than the B peaks and seem to be partially masked (at times) by the shoulders of the B series of enhancements. Figure 5b shows the power spectral analysis for the time series shown in Figure 5a. Strong periodicities at periods between 10 and 30 s are suggested by the analysis.
Figure 5.
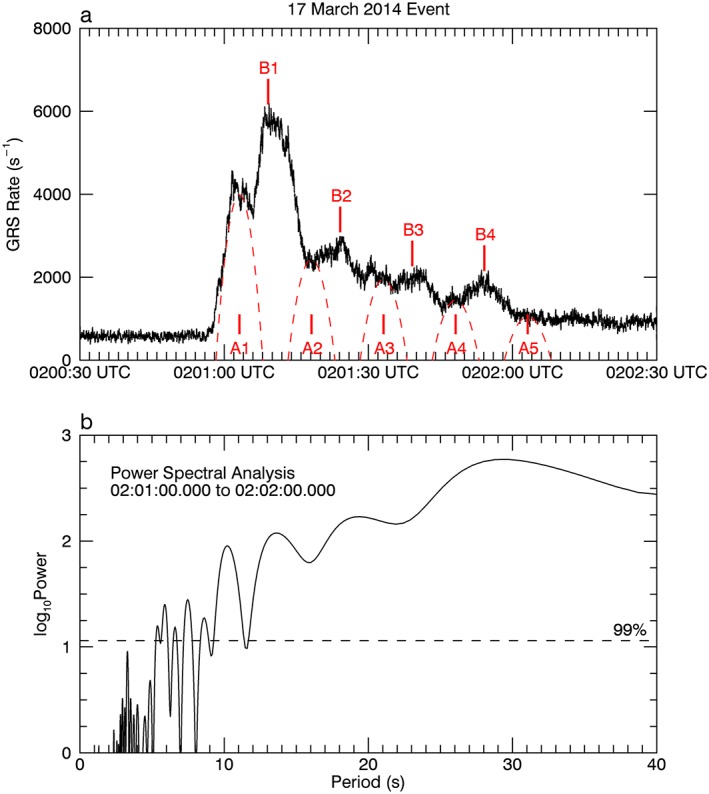
(a) GRS data for 17 March 2014 for the same period as that shown in Figure 3a but with a 10‐sample smoothing filter applied. This plot shows the 15‐s period “drift echoes” in the data set indicated by the tick marks labeled A1, A2, … and B1, B2, …, as described in the text. The red dashed curves indicate the A population. (b) Power spectral analysis for the time series in Figure 5a.
Our interpretation of the data in Figure 5 is that energetic electrons were injected onto closed magnetic field lines to the west of the MESSENGER location just before 0201 UTC. These electrons then drifted on closed (nearly dipolar) magnetic field lines to the spacecraft location near dawn. In keeping with analysis cases at Earth during magnetospheric substorms [Baker et al., 1996], the particles subsequently drifted several times around the planet, thus forming “drift echoes.” In this case, we interpret the data to mean that a double injection of electrons occurred about 6 s apart. Alternatively, two spatially distinct injection locations could have been active near midnight. In either case, the injected electron bunches drifted around Mercury as coherent (but gradually dispersing) entities over the next minute. During that time, some of the electrons undoubtedly scattered into the planetary magnetic “loss cone” and impacted Mercury's surface [see Baker et al., 1987]. Others could readily have been lost through the magnetopause boundary. In either case, by 0203 UTC the electron fluxes had subsided so as to be nearly back to the preinjection count rate level.
As shown by Baker et al. [1986], the drift period for an energetic particle of mass m 0 and charge q in a dipole magnetic field is given by
where M 0 is the planetary dipole magnetic moment, L is the drift shell parameter, c is the speed of light, RM is Mercury's radius, γ = (1 − v 2/c 2)−1/2, and β = v/c, where v is the particle velocity. Given RM = 2439 km and M 0 = 190 nT R M 3, electrons with energy E ~ 200 keV drift around Mercury at L ~ 1.3 in 15 s. Thus, such electrons would execute complete azimuthal drifts at ~15 s periods in the offset magnetic dipole field of Mercury [see Korth et al., 2014] for the radial location of the spacecraft at the time of these events.
4. Energetic Electron Injection: Mercury Substorm Events?
The energetic electron events shown in Figures 2, 3, 4, 5 were acquired when the MESSENGER spacecraft was in the dawn sector of the planet. Consequently, the region of observation was far from the magnetotail current sheet region and, hence, from the likely location of substorm‐like injections [e.g., Baker et al., 1986]. To look for events corresponding more closely to direct substorm injection events, we examined GRS energetic electron enhancements in the midnight and immediate postmidnight sectors of Mercury. Of the ~100 electron events studied in our GRS data set, 8–10 events were found near local midnight and showed strong associated magnetic field signatures.
An example of a likely energetic electron injection event is shown in Figure 6. The sharp enhancement of energetic electrons (~100–200 keV) detected by GRS occurred at ~1801:36 UTC on 21 November 2013. The MESSENGER spacecraft was located at a planetocentric distance of 1.90 RM and was in the postmidnight region at ~0054 local time (LT). Figure 6a shows that there was a pulse of energetic electrons with complex burst structures lasting until ~1801:45 UTC. The magnetic field associated with this electron event showed “tail‐like” stretching of the magnetic field [Sundberg et al., 2012; Sun et al., 2015] prior to the particle injection, with the Bx component strengthening and the Bz component diminishing between ~1801:00 and 1801:35 UTC. At the time of the energetic electron flux injection (1801:36 UTC) the Bx component decreased and the Bz component increased. This kind of behavior (on a much slower timescale, of course) would constitute a classic “dipolarization” field signature during substorm onset at Earth [see Baker et al., 1996].
Figure 6.
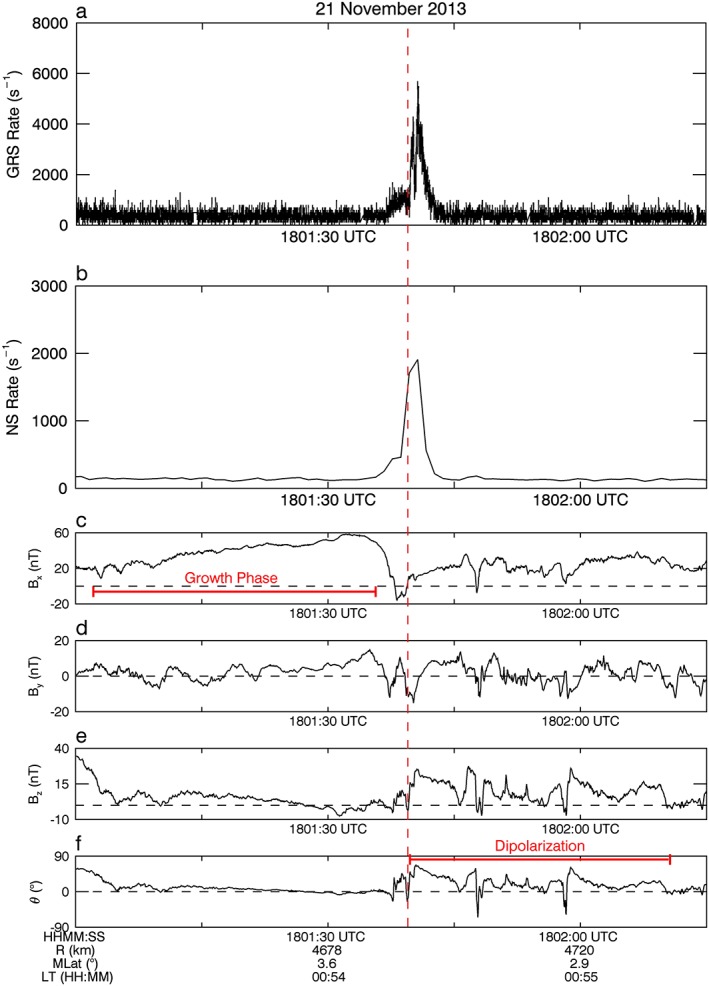
An electron injection event in (a) GRS and (b) NS data near Mercury local midnight on 21 November 2013. The format follows that in Figure 2. (c–f) Magnetic field inclination angle data show substorm‐like field changes, as described in the text.
We interpret the enhancement of energetic electrons in Figure 6a as direct evidence of injection by substorm reconfiguration of the nightside Mercury magnetosphere driven by the formation of a near‐Mercury neutral line [Baker et al., 1996]. Presumably, and in close analogy with the situation at Earth, these energetic electrons became entrained on the newly closed magnetic field lines and underwent betatron and Fermi acceleration as the field dipolarized and subsequently drifted in longitude around Mercury (as was directly witnessed for the examples shown above from 17 March 2014). Thus, these MESSENGER data support earlier speculations about Mercury reconnection‐driven magnetospheric dynamics [Siscoe et al., 1975; Slavin and Holzer, 1979] and substorm production of energetic electrons [Eraker and Simpson, 1986; Baker et al., 1986].
5. Event Classification and Location Analysis
As noted above, there are many different types of energetic electron enhancements detected by MESSENGER instruments [see also Lawrence et al., 2015]. These different types can be distinguished by spatial locations, temporal profiles, and peak intensity levels. In this section, we illustrate several of the categorizations we have used to examine the origin and nature of intense events detected with the GRS ACS.
Analysis presented above shows some of the relevant properties of electron enhancements. Rapid rise‐slow decay events (Figure 2) illustrate one important class of energetic electron event. Often these are characterized—such as the case shown in Figure 4—by abrupt counting rate increases but otherwise are lacking strong associated magnetic field signatures. As discussed above, we regard this class of electron enhancement as having been generated at a point quite removed from the observation location. The detected electrons most likely then drifted to the observing point as a result of magnetic gradient and curvature forces.
Another class of electron event is exemplified by the event shown in Figure 6. This type of event can be quite similar in its rapid rise‐slow decay character, but it has strong associated magnetic perturbations. These events were typically seen close to local midnight and, as argued above, are probably a direct result of substorm‐like activity driven by reconnection in the near‐Mercury tail region. Another example of this kind of energetic electron event (occurring at ~1836:40 UTC on 18 February 2014) is shown in Figure 7a. Similar to the ~0201 UTC 17 March 2014 event, the event on 18 February shows drift echo features, but at much smaller (~3 s) periods (owing to the spacecraft being at a different L shell and higher injected electron energies). The 10 ms time resolution of the GRS system allows drift echoes to be more easily and confidently determined than with the 1 s resolution of the NS system. About 54% of the GRS events we have studied show at least some drift echo patterns, such as those in Figures 5 and 7a, and can occur on time scales of ~3 s to ~1 min [see also Lawrence et al., 2015].
Figure 7.
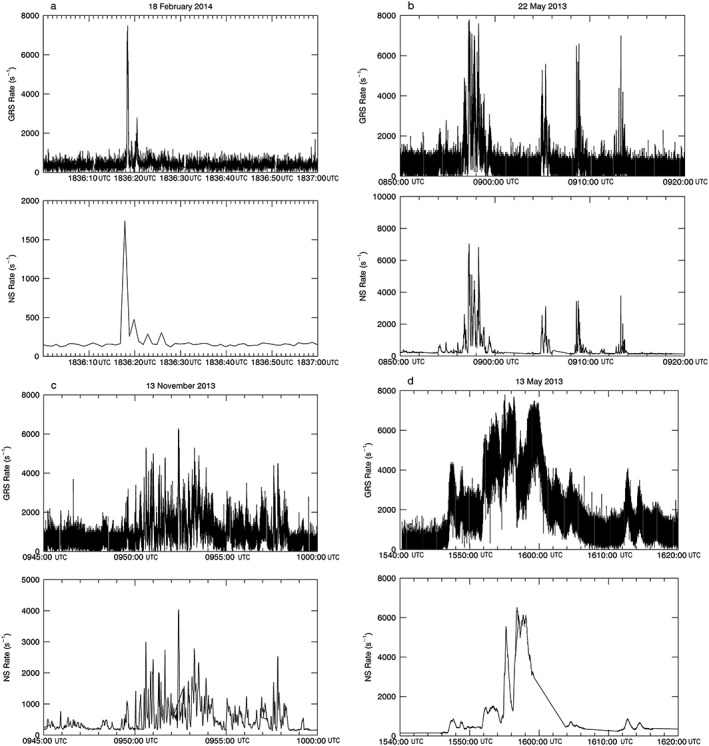
Different types of energetic electron enhancement events analyzed in this study. (a) Another near‐midnight injection event. (b) Multievent enhancement. (c) Periodic electron event. (d) Smooth type of energetic electron event.
About 25% of the events we have studied from GRS data occur with rapid count rate fluctuations and are therefore rich in temporal structure. The timing of the fluctuations is quasiperiodic, often at periods of ~15–30 s, and the events are always rather long lasting in electron enhancement (≥10 min). An example of this “periodic”‐type event is shown in Figure 7c. The event shown occurred on 13 November 2013 and lasted from ~0950 UTC until after 1000 UTC. Events that fall in the periodic category were seen most typically from 0200 to ~0800 LT and at middle (northern) latitudes. We suggest that events with periodic and/or rapid rise features are all part of the same nightside‐generated population of electrons. As such, they constitute >85% of the cases.
Finally, about 46% of the events detected show smooth features in their time profile [see also Lawrence et al., 2015]. The most substantial of these events (having the largest, sustained enhancements) tend to be seen at negative magnetic latitudes (between −10° and −80°) and toward the dayside of the magnetosphere. An example of this type (observed on 19 November 2013 after ~1010 UTC) is shown in Figure 7d. These events often were seen under strong external forcing conditions (e.g., following coronal mass ejections or flares).
Although we have grouped electron events into three distinct classes—rapid rise, periodic, and smooth—these categories are not mutually exclusive; some events exhibit features from two or more of these categories. For example, the event shown in Figure 7c is periodic in nature from ~0950 to ~0955 UTC but shows more characteristic rapid rise features between 0955 and 1000 UTC. About 53% of the events in this study contain features from multiple classes of event or contain more than one distinct, but rapid, succession of energetic electron enhancements, such as the 22 May 2013 event in Figure 7b. The classification of the 99 events analyzed here from GRS data is summarized in Figure 8b. The most common recurrence frequency, ~2–4 min, is very close to the substorm Dungey cycle period of ~2–3 min determined from tail loading and unloading events in MESSENGER observations [Slavin et al., 2010; Sun et al., 2015].
Figure 8.
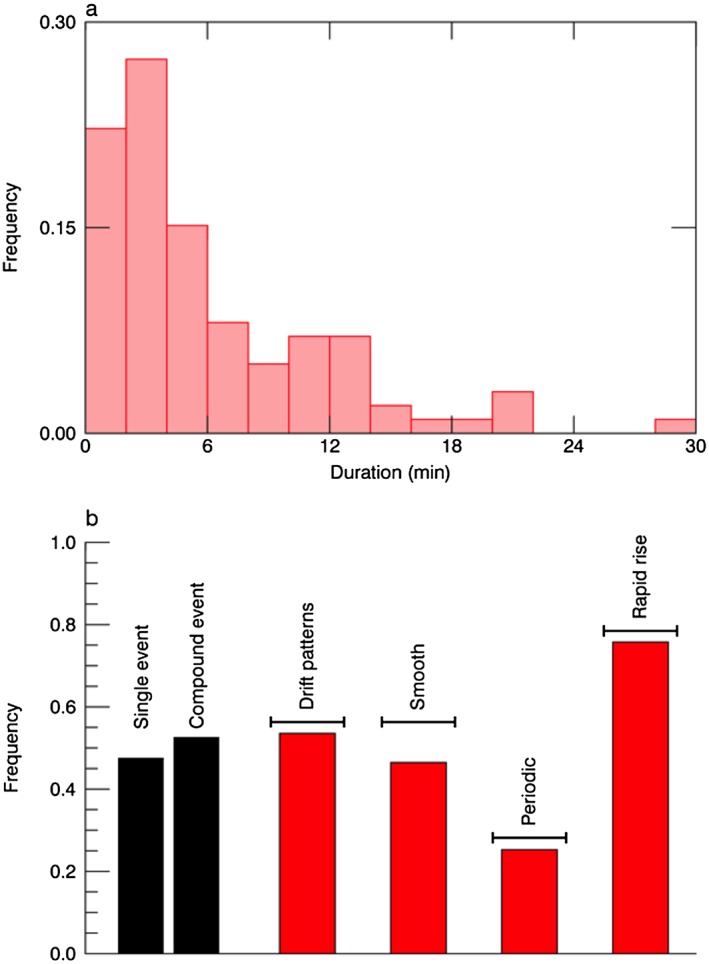
(a) Frequency of occurrence versus duration of events for energetic electron enhancements analyzed in this study. (b) Percentage of different types of electron enhancement events in this study.
Some of the other occurrence characteristics for our data set are shown in Figures 8a and 9. Figure 8a displays the frequency of occurrence for electron events of various time durations. Obviously, the events are strongly skewed to durations of a few minutes or less. Figure 9 summarizes the locations where the various electron events analyzed in this paper were observed. Figure 9a shows a two‐dimensional projection (onto the MSO X‐Y plane) of the 99 event interval locations. As can clearly be seen, the events overwhelmingly were observed in the midnight to local noon sectors. This distribution strongly reinforces the view that these were energetic electron events generated near local midnight that subsequently drifted eastward toward local noon. Figure 9b shows the same occurrence distribution information but in a three‐dimensional representation of the locations. Because of MESSENGER's orbit [see Lawrence et al., 2015], the sensors detected electrons relatively close to the planet primarily in the northern hemisphere.
Figure 9.
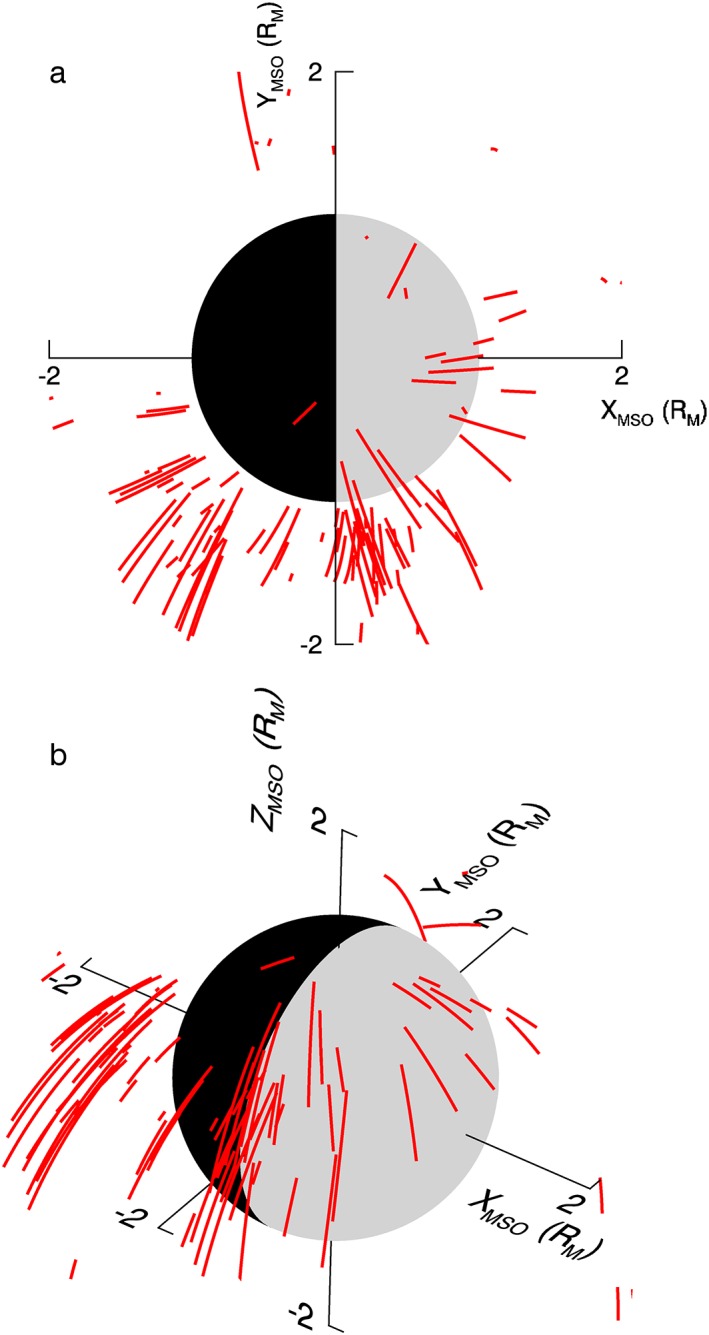
Diagrams showing spatial locations and extents of all energetic electron events in this study. (a) Projection of MESSENGER orbits onto the MSO X‐Y plane during times when events were detected. (b) Representation of orbit trajectory segments during electron bursts shown in a three‐dimensional projection.
6. Discussion and Conclusions
Among the longstanding and most intriguing issues about Mercury's space environment has been the detailed nature of the interaction between the solar wind and the magnetosphere. Mariner 10 and MESSENGER flyby data suggested strongly that substorm‐like events occur in Mercury's magnetosphere, but on a time scale much shorter, ~2–3 min, than at Earth [Siscoe et al., 1975; Slavin et al., 2010]. Measurements from the MESSENGER spacecraft [Slavin et al., 2009, 2010, 2014; DiBraccio et al., 2013; Imber et al., 2014] have demonstrated convincingly that strong magnetic reconnection occurs at Mercury between the incident interplanetary magnetic field and the dayside Mercury magnetic field. Reconnection events and flux transfer event signatures at the dayside magnetopause, as well as “plasmoids” and magnetic traveling compression regions on the nightside, clearly demonstrate and extend our understanding of the dynamic nature of Mercury's magnetosphere. What has been lacking has been a full understanding of the energetic particle burst events first reported from Mariner 10 [Simpson et al., 1974; Eraker and Simpson, 1986; Baker et al., 1986; Christon et al., 1987].
We suggest that the analysis in this paper provides at least some of the closure that has been sought. From high‐time‐resolution energetic electron data, we have been able to study in considerable detail the acceleration, transport, and loss of electrons within the inner magnetosphere of Mercury. From the corresponding high‐resolution magnetic field data from MESSENGER, we have been able to understand more completely the energetic electron occurrence properties. From the evidence presented in this study, the most energetic and intense electron bursts detected by MESSENGER sensors appear clearly to be produced in the midnight sector of Mercury's magnetosphere (see Figure 9). The evidence presented here shows that the accelerated electrons (as previously inferred by Mariner 10) often are injected onto closed, rapidly reconfiguring magnetic field lines during substorm‐like events. Importantly, our high‐time‐resolution (10 ms sampling) electron data show directly that injected electrons can—under some circumstances—make multiple drifts around the planet on closed, quasi‐trapped orbits, creating Earth‐like drift echo events (see Figure 5).
Given the evidence from other MESSENGER instruments [Lawrence et al., 2015] as well as the analysis of GRS data presented here, we believe that the magnetospheric dynamical framework shown in Figure 10 is supported by MESSENGER observations. This framework is based on the concept of the near‐Earth neutral line, which has proven very successful in explaining terrestrial substorms [Baker et al., 1996]. Enhanced solar wind forcing leads to growth of available free energy in the Mercury magnetotail [Slavin et al., 2010]. By analogy with Earth, a magnetic reconnection (X‐line) region forms in the near‐tail region of the Mercury system. Tailward of the X‐line, there are plasma flow bursts, plasmoids (flux ropes), and substantial releases of stored tail energy [Slavin et al., 2009, 2010; DiBraccio et al., 2015]. Planetward of the X‐line region, stretched magnetic field lines are rapidly reconfigured into more dipolar states and energetic electrons are swept toward Mercury along with rapidly dipolarizing magnetic field lines [Sundberg et al., 2012; Sun et al., 2015]. The energetic electrons so entrained are able then to drift around the magnetosphere on closed magnetic shells to form the kinds of energetic electron bursts summarized above (see Figure 8).
Figure 10.
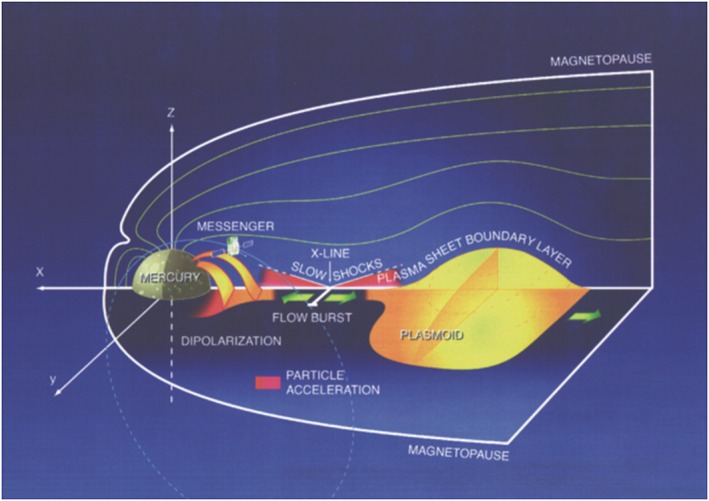
Schematic diagram of Mercury's magnetosphere showing substorm phenomenology as observed by MESSENGER, including energetic particle acceleration and near‐midnight magnetic field reconfigurations [Slavin et al., 2007].
The particle acceleration we have documented in this study can be well accounted for, we argue, by the inductive electric fields associated with collapsing, rapidly reconfiguring fields illustrated in Figure 10 [Slavin et al., 2007]. As discussed recently in detail by Birn et al. [2012], the changing magnetic field creates powerful inductive electric fields [see also Baker et al., 1986; Hoshino, 2005; Drake et al., 2006] that can readily accelerate electrons to energies of hundreds of keV on very short time scales. These electrons can then form the rapid rise events we have studied in this paper. The often more slowly decaying time profiles for many of the electron bursts seem usually to be due to the suddenly energized electrons being progressively lost by scattering into the magnetic loss cone (ultimately striking the Mercury surface) or else leaking out of the system through the very nearby magnetopause boundary.
It is important to bear in mind (see Figure 10) how compressed and compact the dayside magnetosphere of Mercury really is. In many cases, it seems likely that substorm‐injected electrons would not be able to execute even one complete azimuthal drift around the planet before being lost. Thus, for the high‐energy and high‐intensity events studied here, we see relatively few instances in which strong electron events were observed in the dusk or premidnight sectors. In the study of Lawrence et al. [2015], much weaker events were included, and some energetic electron bursts were, in fact, seen near dusk or even in the premidnight sectors. But even in that study, the vast majority (see their Figure 10) of energetic electron events were detected between midnight and local noon.
In summary, we suggest that the use of high‐time‐resolution, high‐sensitivity data has provided answers to some of the most enduring questions about Mercury's magnetosphere. The data show that substorm‐like events that play such a crucial role for energetic particles in Earth's magnetosphere also play a similar role at Mercury. However, the rapidity with which the acceleration and transport occur at Mercury has demanded extremely sensitive and high‐time‐resolution data. Fortunately, by using the 10 ms sampling of the GRS ACS system on MESSENGER, we have been able to witness the details of the highly dynamic Mercury accelerator in action.
Acknowledgments
The MESSENGER project is supported by the NASA Discovery Program under contract NAS5‐97271 to The Johns Hopkins University Applied Physics Laboratory and contract NASW‐00002 to the Carnegie Institution of Washington. All GRS (and NS) data can be found at http://pds‐geosciences.wustl.edu/missions/messenger/grns.htm. The authors thank their colleagues on the MESSENGER Atmosphere and Magnetosphere Discipline Group and two anonymous reviewers for helpful comments concerning this work.
Baker, D. N. , Dewey R. M., Lawrence D. J., Goldsten J. O., Peplowski P. N., Korth H., Slavin J. A., Krimigis S. M., Anderson B. J., Ho G. C., et al. (2016), Intense energetic electron flux enhancements in Mercury's magnetosphere: An integrated view with high‐resolution observations from MESSENGER, J. Geophys. Res. Space Physics, 121, 2171–2184, doi:10.1002/2015JA021778.
References
- Andrews, G. B. , et al. (2007), The Energetic Particle and Plasma Spectrometer instrument on the MESSENGER spacecraft, Space Sci. Rev., 131, 523–556, doi:10.1007/s11214-007-9272-5. [Google Scholar]
- Armstrong, T. P. , Krimigis S. M., and Lanzerotti L. J. (1975), A reinterpretation of the reported energetic particle fluxes in the vicinity of Mercury, J. Geophys. Res., 80, 4015–4017, doi:10.1029/JA080i028p04015. [Google Scholar]
- Baker, D. N. , Simpson J. A., and Eraker J. H. (1986), A model of impulsive acceleration and transport of energetic particles in Mercury's magnetosphere, J. Geophys. Res., 91, 8742–8748, doi:10.1029/JA091iA08p08742. [Google Scholar]
- Baker, D. N. , Borovsky J. E., Burns J. O., Gisler G. R., and Zeilik M. (1987), Possible calorimetric effects at Mercury due to solar wind magnetosphere interactions, J. Geophys. Res., 92, 4707–4712, doi:10.1029/JA092iA05p04707. [Google Scholar]
- Baker, D. N. , Pulkkinen T. I., Angelopoulos V., Baumjohann W., and McPherron R. L. (1996), Neutral line model of substorms: Past results and present view, J. Geophys. Res., 101, 12,975–13,010, doi:10.1029/95JA03753. [Google Scholar]
- Baker, D. N. , et al. (2009), Space environment of Mercury at the time of the first MESSENGER flyby: Solar wind and interplanetary magnetic field modeling of upstream conditions, J. Geophys. Res., 114, A10101, doi:10.1029/2009JA014287. [Google Scholar]
- Baker, D. N. , et al. (2013), Solar wind forcing at Mercury, WSA‐ENLIL model results, J. Geophys. Res. Space Physics, 118, 45–57, doi:10.1029/2012JA018064. [Google Scholar]
- Birn, J. , Artemyev A. V., Baker D. N., Echim M., Hoshino M., and Zelenyi L. M. (2012), Particle acceleration in the magnetotail and aurora, Space Sci. Rev., 173, 49–102, doi:10.1007/s11214-012-9874-4. [Google Scholar]
- Christon, S. P. , Feynman J., and Slavin J. A. (1987), Dynamic substorm injections: Similar magnetospheric phenomena at Earth and Mercury, in Magnetotail Physics, edited by Lui A. T. Y., pp. 393–400, Johns Hopkins Univ. Press, Baltimore, Md. [Google Scholar]
- DiBraccio, G. A. , Slavin J. A., Boardsen S. A., Anderson B. J., Korth H., Zurbuchen T. H., Raines J. M., Baker D. N., McNutt R. L. Jr., and Solomon S. C. (2013), MESSENGER observations of magnetopause structure and dynamics at Mercury, J. Geophys. Res. Space Physics, 118, 997–1008, doi:10.1002/jgra.50123. [Google Scholar]
- DiBraccio, G. A. , et al. (2015), MESSENGER observations of flux ropes in Mercury's magnetotail, Planet. Space Sci., 115, 77–89, doi:10.1016/j.pss.2014.12.016. [Google Scholar]
- Drake, J. F. , Swisdak M., Che H., and Shay M. S. (2006), Electron acceleration from contracting magnetic islands during reconnection, Nature, 443, 553–556, doi:10.1038/nature05116. [DOI] [PubMed] [Google Scholar]
- Eraker, J. H. , and Simpson J. A. (1986), Acceleration of charged particles in Mercury's magnetosphere, J. Geophys. Res., 91, 9973–9993, doi:10.1029/JA091iA09p09973. [Google Scholar]
- Goldsten, J. O. , et al. (2007), The MESSENGER Gamma‐Ray and Neutron Spectrometer, Space Sci. Rev., 131, 339–391, doi:10.1007/s11214-007-9262-7. [Google Scholar]
- Ho, G. C. , et al. (2011a), MESSENGER observations of transient bursts of energetic electrons in Mercury's magnetosphere, Science, 333, 1865–1868, doi:10.1126/science.1211141. [DOI] [PubMed] [Google Scholar]
- Ho, G. C. , Starr R. D., Gold R. E., Krimigis S. M., Slavin J. A., Baker D. N., Anderson B. J., McNutt R. L. Jr., Nittler L. R., and Solomon S. C. (2011b), Observations of suprathermal electrons in Mercury's magnetosphere during the three MESSENGER flybys, Planet. Space Sci., 59, 2016–2025. [Google Scholar]
- Ho, G. C. , Krimigis S. M., Gold R. E., Baker D. N., Anderson B. J., Korth H., Slavin J. A., McNutt R. L. Jr., Winslow R. M., and Solomon S. C. (2012), Spatial distribution and spectral characteristics of energetic electrons in Mercury's magnetosphere, J. Geophys. Res., 117, A00M04, doi:10.1029/2012JA017983. [Google Scholar]
- Hoshino, M. (2005), Electron surging in magnetic reconnection, J. Geophys. Res., 110, A10215, doi:10.1029/2005JA011229. [Google Scholar]
- Imber, S. M. , Slavin J. A., Boarden S. A., Anderson B. J., Korth H., McNutt R. L. Jr., and Solomon S. C. (2014), MESSENGER observations of large dayside flux transfer events: Do they drive Mercury's substorm cycle?, J. Geophys. Res. Space Physics, 119, 5613–5623, doi:10.1002/2014JA019884. [Google Scholar]
- Korth, H. , Anderson B. J., Gershman D. J., Raines J. M., Slavin J. A., Zurbuchen T. H., Solomon S. C., and McNutt R. L. Jr. (2014), Plasma distribution in Mercury's magnetosphere derived from MESSENGER Magnetometer and Fast Imaging Plasma Spectrometer observations, J. Geophys. Res. Space Physics, 119, 2917–2932, doi:10.1002/2013JA019567. [Google Scholar]
- Lawrence, D. J. , et al. (2015), Comprehensive survey of energetic electron events in Mercury's magnetosphere with data from the MESSENGER Gamma‐Ray and Neutron Spectrometer, J. Geophys. Res. Space Physics, 120, 2851–2876, doi:10.1002/2014JA020792. [Google Scholar]
- Simpson, J. A. , Eraker J. H., Lamport J. E., and Walpole P. H. (1974), Electrons and protons accelerated in Mercury's magnetic field, Science, 185, 160–166. [DOI] [PubMed] [Google Scholar]
- Siscoe, G. L. , Ness N. F., and Yeates C. M. (1975), Substorms on Mercury?, J. Geophys. Res., 80, 4359–4363, doi:10.1029/JA080i031po4359. [Google Scholar]
- Slavin, J. A. , and Holzer R. E. (1979), The role of erosion on the solar wind stand‐off distance at Mercury, J. Geophys. Res., 84, 2076–2082, doi:10.1029/JA084iA05p02076. [Google Scholar]
- Slavin, J. A. , et al. (2007), MESSENGER: Exploring Mercury's magnetosphere, Space Sci. Rev., 131, 133–160, doi:10.1007/s1/214-007-9154-x. [Google Scholar]
- Slavin, J. A. , et al. (2009), MESSENGER observations of magnetic reconnection in Mercury's magnetosphere, Science, 324, 606–610, doi:10.1126/science.1172011. [DOI] [PubMed] [Google Scholar]
- Slavin, J. A. , et al. (2010), MESSENGER observations of extreme loading and unloading of Mercury's magnetic tail, Science, 329, 665–668, doi:10.1126/science.1188067. [DOI] [PubMed] [Google Scholar]
- Slavin, J. A. , et al. (2014), MESSENGER observations of Mercury's dayside magnetosphere under extreme solar wind conditions, J. Geophys. Res. Space Physics, 119, 8087–8116, doi:10.1002/2014JA020319. [Google Scholar]
- Starr, R. D. , Schriver D., Nittler L. R., Weider S. Z., Byrne P. K., Ho G. C., Rhodes E. A., Schlemm C. E. II, Solomon S. C., and Trávníček P. M. (2012), MESSENGER detection of electron‐induced X‐ray fluorescence from Mercury's surface, J. Geophys. Res., 117, E00L02, doi:10.1029/2012JE004118. [Google Scholar]
- Sun, W.‐J. , et al. (2015), MESSENGER observations of magnetospheric substorm activity in Mercury's near magnetotail, Geophys. Res. Lett, 42, 3692–3699, doi:10.1002/2015GL064052. [Google Scholar]
- Sundberg, T. , et al. (2012), MESSENGER observations of dipolarization events in Mercury's magnetotail, J. Geophys. Res., 22, A00M03, doi:10.1029/2012JA017756. [Google Scholar]