Abstract
Voltage-dependent CaV1.2 L-type Ca2+ channels (LTCC) are the main route for calcium entry in vascular smooth muscle cells (VSMC). Several studies have also determined the relevant role of store-operated Ca2+ channels (SOCC) in vascular tone regulation. Nevertheless, the role of Orai1- and TRPC1-dependent SOCC in vascular tone regulation and their possible interaction with CaV1.2 are still unknown. The current study sought to characterize the co-activation of SOCC and LTCC upon stimulation by agonists, and to determine the possible crosstalk between Orai1, TRPC1, and CaV1.2. Aorta rings and isolated VSMC obtained from wild type or smooth muscle-selective conditional CaV1.2 knock-out (CaV1.2KO) mice were used to study vascular contractility, intracellular Ca2+ mobilization, and distribution of ion channels. We found that serotonin (5-HT) or store depletion with thapsigargin (TG) enhanced intracellular free Ca2+ concentration ([Ca2+]i) and stimulated aorta contraction. These responses were sensitive to LTCC and SOCC inhibitors. Also, 5-HT- and TG-induced responses were significantly attenuated in CaV1.2KO mice. Furthermore, hyperpolarization induced with cromakalim or valinomycin significantly reduced both 5-HT and TG responses, whereas these responses were enhanced with LTCC agonist Bay-K-8644. Interestingly, in situ proximity ligation assay revealed that CaV1.2 interacts with Orai1 and TRPC1 in untreated VSMC. These interactions enhanced significantly after stimulation of cells with 5-HT and TG. Therefore, these data indicate for the first time a functional interaction between Orai1, TRPC1, and CaV1.2 channels in VSMC, confirming that upon agonist stimulation, vessel contraction involves Ca2+ entry due to co-activation of Orai1- and TRPC1-dependent SOCC and LTCC.
Keywords: calcium, calcium release-activated calcium channel protein 1 (ORAI1), excitation-contraction coupling (E-C coupling), ion channel, vascular smooth muscle cells, CaV1.2 channel, TRPC1, CaV1.2, Orai1, Vascular tone regulation
Introduction
Vasoactive agonists are known to promote vessel contraction by a rise in intracellular free Ca2+ concentration ([Ca2+]i). This increase in [Ca2+]i has been classically considered to occur first, due to a rapid Ca2+ release from sarcoplasmic reticulum (SR)2 stimulated by inositol 1,4,5-trisphosphate (InsP3), and then to a transmembrane Ca2+ influx through L-type Ca2+ channels (LTCC), especially CaV1.2 channels, which are the main path for Ca2+ entry responsible for the excitation-contraction coupling process in excitable vascular smooth muscle cells (VSMC) (1). Other voltage-independent channels are also involved in transmembrane Ca2+ influx, such as store-operated Ca2+ channels (SOCC) responsible of extracellular Ca2+ entry, known as store-operated Ca2+ entry (SOCE) (2, 3). SOCC have been characterized both in freshly dispersed and in primary cultured VSMC from systemic and resistance vessels (4–6). It is well established that SOCE is mainly due to the activation of the Ca2+-sensing regulatory protein stromal interaction molecule 1 (STIM1) and Orai1, the pore-forming subunit of SOCC in a wide range of non-excitable cells (7). Additionally, Orai1 was suggested to form a non-Ca2+ selective SOCC due to its association with TRPC1 in excitable cells (8, 9). Interestingly, evidence showed that TRPC1, Orai1, and CaV1.2 might interact with the proteins of other channels to form a signal complex in VSMC (10–12).
Taking into consideration that Ca2+ enters mainly through LTCC in VSMC, further understanding of how Orai1 and TRPC1 might influence the role of LTCC in Ca2+ signaling and contractility is needed to explain the physiological role of SOCC in vessel contraction, which still remains under debate (13). We hypothesized that Ca2+ release from the SR, induced by a vasoactive agonist such as serotonin (5-HT), could activate SOCE, leading to depolarization of the VSMC, which would stimulate LTCC. Therefore, the main aims of this study were first, to investigate whether SOCC activity might substitute LTCC function in VSMC, and second, to determine the endogenous distribution of Orai1, TRPC1, and CaV1.2 in VSMC.
Results
Agonist-induced Vasoconstriction Involves Ca2+ Entry through SOCC and LTCC in Endothelium-denuded Mouse Aorta
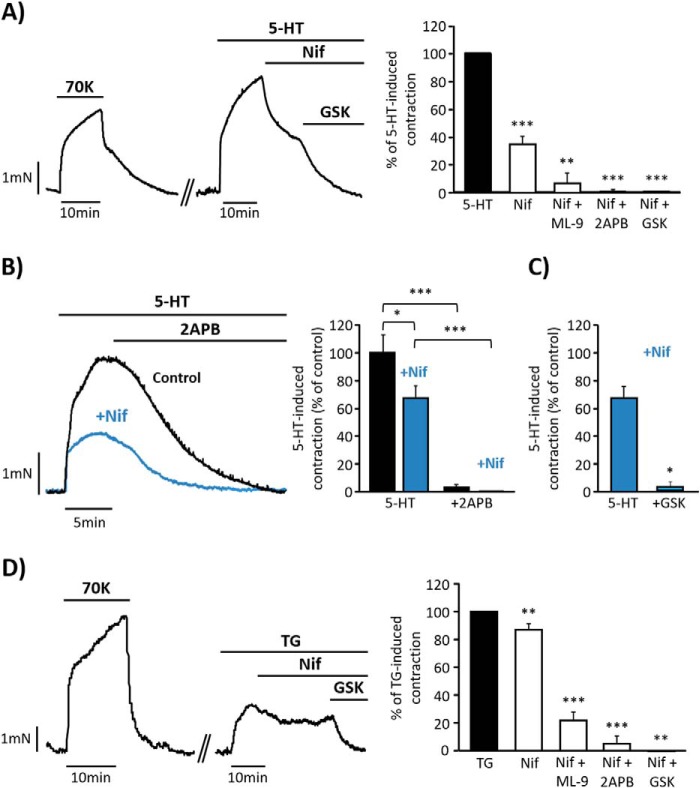
The role of SOCC and LTCC in contractile responses of aorta was studied using 5-HT as vasoactive agonist. Fig. 1A shows that 5-HT (10 μm) evoked a potent vasoconstriction in endothelium-denuded aorta, which was partially inhibited by nifedipine (1 μm), a specific inhibitor of LTCC in VSMC (14). The cumulative addition of GSK-7975A (10 μm), considered a specific inhibitor of Orai1 (15), further produced the complete relaxation of the vessel. Similar effects were also observed when other less specific inhibitors of SOCE, 2APB (50 μm) or ML-9 (25 μm) (3), were added after nifedipine, as summarized in Fig. 1A. Additionally, pre-treatment of aortic rings with 1 μm nifedipine attenuated but did not prevent 5-HT responses (Fig. 1, B and C); meanwhile the supplementary addition of 2APB (50 μm) or GSK-7975A (10 μm, Fig. 1C) produced the complete relaxation of the vessel. As shown in Fig. 1B, the addition of 2APB alone (50 μm) promoted the full relaxation of 5-HT-induced contraction, in contrast to the effect of nifedipine (Fig. 1A). Interestingly, the specific activation of SOCC with thapsigargin (TG, 10 μm), a SERCA inhibitor (16), evoked a nifedipine- (1 μm) sensitive vasoconstriction, although the inhibitory effect of nifedipine was smaller in comparison with its effect on 5-HT responses (Fig. 1D). Further relaxation was also produced by the addition of GSK-7975A (10 μm), 2APB (50 μm), or ML-9 (50 μm), indicating that TG-induced vasoconstriction involves LTCC and SOCC co-activation.
FIGURE 1.
Isometric contractions induced by serotonin and thapsigargin in mouse endothelium-denuded aorta. A, representative recording showing high KCl (70 mm; 70K) and 5-HT (10 μm) evoked contractions in endothelium-denuded mouse aorta. The cumulative addition of nifedipine (Nif, 1 μm) and GSK-7975A (GSK, 10 μm) fully relaxes 5-HT-induced contraction. GSK-7975A was substituted by 2APB (50 μm) or ML-9 (25 μm) in other experiments to inhibit SOCC. The right panel shows a data summary of the effects of Nif (34.08% ± 4.25; n = 16), Nif + ML-9 (7.28% ± 7.28; n = 3), Nif + 2APB (0.87% ± 0.65; n = 8), and Nif + GSK (0.57% ± 0.57; n = 4) on 5-HT-induced contraction (control; n = 17). B, representative traces and data summary showing 5-HT- (10 μm) induced contraction in control rings (black bar and trace; 100% ± 13.01; n = 10) and rings pre-treated with 1 μm Nif for 10 min (blue trace and bars; 69.30% ± 8.45; n = 16). 50 μm 2APB was added as indicated in control (3.13% ± 2.40) and in rings pretreated with nifedipine (0.18% ± 0.13). Values were normalized to 70K responses. C, data summary showing 5-HT- (10 μm) induced contraction in rings pre-treated with 1 μm nifedipine (69.31% ± 8.45; n = 16) and after GSK-7975A (10 μm) administration in rings pretreated with Nif (3.20% ± 3.20; n = 3). D, representative recording and data summary of 10 μm TG- (n = 20) elicited aorta contraction. 1 μm Nif (86.05% ± 3.84; n = 22) was added followed by GSK (0% ± 0; n = 3), 50 μm 2APB (5.37% ± 5.37; n = 7), or 50 μm ML-9 (21.97% ± 6.20; n = 12). Values are the percentage of mean ± S.E. *, p < 0.05, **, p < 0.01 and ***, p < 0.001.
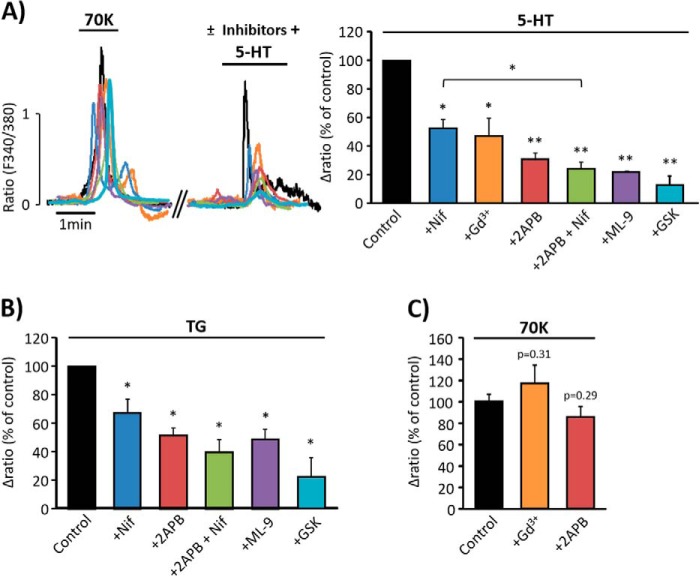
In experiments performed in isolated VSMC, administration of 5-HT (10 μm), applied in the continuous presence of extracellular Ca2+, evoked a transient followed by a sustained elevation of [Ca2+]i (Fig. 2A). Both fast and sustained 5-HT-induced [Ca2+]i increases were sensitive to nifedipine (100 nm) and to the SOCC inhibitors, GSK-7975A (5 μm), Gd3+ (5 μm), 2APB (25 μm), and ML-9 (10 μm). Pre-treatment of cells with 2APB (25 μm) together with nifedipine (100 nm) caused significantly stronger suppression of 5-HT-evoked [Ca2+]i responses, as compared with the effect of nifedipine alone. Similarly, the addition of TG (2 μm) in the presence of extracellular Ca2+ induced an increase in [Ca2+]i, which was sensitive to nifedipine (100 nm), GSK-7975A (5 μm), 2APB (25 μm), and ML-9 (10 μm), as shown in Fig. 2B. The effect of 2APB (25 μm) applied together with nifedipine (100 nm) caused additional reduction of TG-evoked [Ca2+]i increase, like their effects in 5-HT response. In similar experiments, we tested a higher concentration of nifedipine (500 nm), and the effects were not significantly different from those obtained using 100 nm (data not shown). Fig. 2C shows data from control experiments in which Gd3+ (5 μm) and 2APB (50 μm) did not affect high KCl-induced [Ca2+]i responses. Altogether, these data suggest that 5-HT- and TG-induced [Ca2+]i increase and artery vasoconstriction involve Ca2+ entry through both LTCC and SOCC.
FIGURE 2.
[Ca2+]i changes elicited by serotonin and thapsigargin in vascular smooth muscle cell. A, left panel, representative traces of [Ca2+]i responses in VSMC presented as fura-2 ratio (F340/F380). High KCl (70 mm; 70K) was applied, and then 5-HT (10 μm) was added in the presence or absence of inhibitors. In the right panel, the bar graph summarizes 5-HT-evoked [Ca2+]i increases in untreated cells (control, n = 486) and cells pre-treated with 100 nm Nif (52.30% ± 6.20; n = 65), 5 μm Gd3+ (47.15% ± 12.40; n = 48), 25 μm 2APB (30.69% ± 4.40; n = 111), 25 μm 2APB + 100 nm Nif (23.89% ± 5.00; n = 96), 25 μm ML-9 (21.67% ± 0.50; n = 102), and 5 μm GSK (12.67% ± 6.53; n = 160). B, relative data summary of TG- (2 μm) induced [Ca2+]i changes in VSMC (n = 379) and in cells pre-treated with 100 nm Nif (67.51% ± 9.66; n = 141), 25 μm 2APB (51.49% ± 5.45; n = 148), 25 μm 2APB + 100 nm Nif (39.86% ± 8.89; n = 120), 10 μm ML-9 (48.70% ± 7.36; n = 110), and 5 μm GSK (22.10% ± 13.71; n = 152). C, data summary of [Ca2+]i increases evoked by 70K in VSMC (100% ± 7.86; n = 85) or in the presence of 5 μm Gd3+(105.18% ± 15.31; n = 27) and 50 μm 2APB (76.74% ± 9.15; n = 88). Values are the percentage of mean ± S.E. normalized to the first response to 70K from at least 3 different experiments. *, p < 0.05, **, p < 0.01 versus control.
SOCE Does Not Compensate LTCC Function in Endothelium-denuded Aorta of CaV1.2 Knock-out Mice
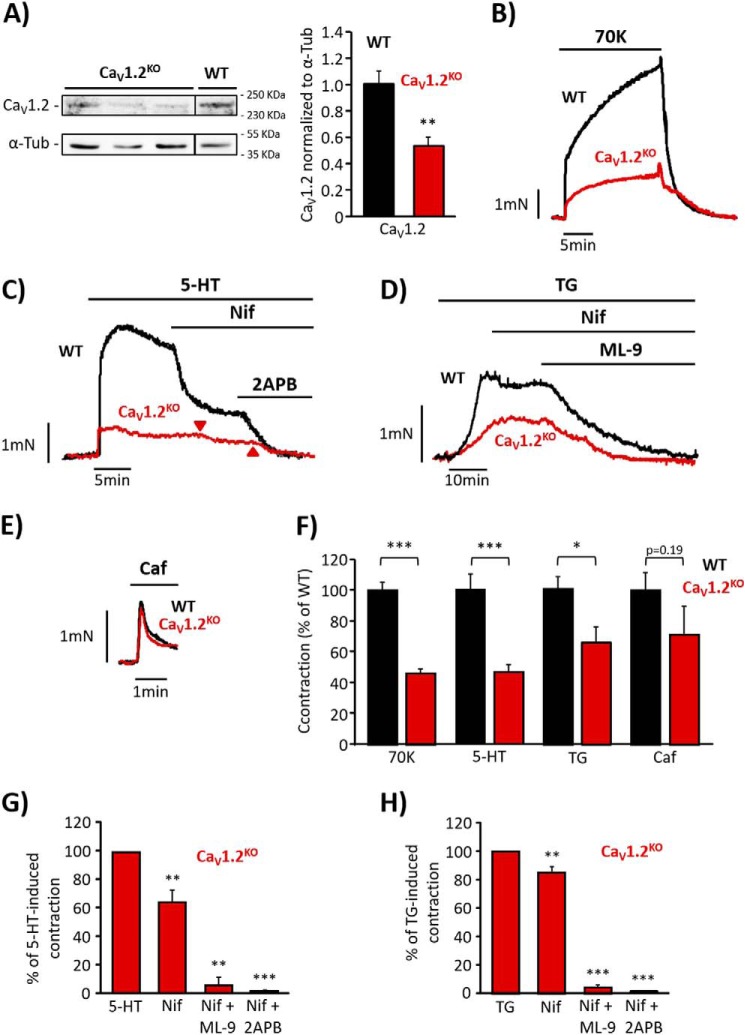
Next, we examined whether SOCC can substitute LTCC function in vascular tone regulation. We used aorta from a conditional CaV1.2 knock-out (CaV1.2KO) mouse model to assess 5-HT and TG effects. Fig. 3A indicates that CaV1.2 protein expression was efficiently decreased in CaV1.2KO mice as compared with wild type (WT). Consistently, aorta contraction induced by depolarizing stimulus, high KCl (70 mm), was significantly attenuated in CaV1.2KO mice as compared with WT (Fig. 3, B and F). In the same way, 5-HT (10 μm, Fig. 3, C and F) and TG (10 μm, Fig. 3, D and F) induced significantly smaller contractions in CaV1.2KO aorta as compared with WT. 5-HT- and TG-evoked vasoconstrictions in CaV1.2KO aorta were still somewhat sensitive to nifedipine (1 μm), probably due to the presence of the remaining functional CaV1.2 channels (Fig. 3, C–H). Interestingly, the evoked contractions were largely inhibited by 2APB (50 μm) or ML-9 (25 μm), as shown in Fig. 3, C and D and summarized in Fig. 3, G and H. Moreover, in freshly isolated CaV1.2KO VSMC, the addition of high KCl, 5-HT (10 μm), or TG (2 μm) evoked significantly reduced [Ca2+]i responses, as compared with WT (Fig. 4, A–C). Because the effect of vasoconstrictor agonists depends on the initial InsP3-induced Ca2+ release from intracellular stores, we checked the integrity of the SR in CaV1.2KO mice using caffeine, to release Ca2+ from ryanodine-sensitive stores (17). We observed that vessel contractions (Fig. 3, E and F) and [Ca2+]i increases (Fig. 4, A and C) induced by caffeine (10 mm) stimulation were not affected in CaV1.2KO mice, confirming that 5-HT- and TG-reduced responses are not due to differences in SR Ca2+ load between WT and CaV1.2KO mice.
FIGURE 3.
Effect of serotonin in endothelium-denuded aorta isolated from CaV1.2 knock-out mice. A, Western blots and data summary of CaV1.2 protein expression in wild type (WT, 1.00 ± 0.10; n = 4) and CaV1.2 knock-out mice (CaV1.2KO, 0.59 ± 0.06; n = 4). α-Tub, α-tubulin. B, representative traces of aortic ring contractions induced by high KCl (70 mm; 70K) in aorta from WT and CaV1.2KO mice. C, representative recordings showing 5-HT- (10 μm) evoked contraction and the effects of the addition of nifedipine (Nif, 1 μm) and 2APB (50 μm) in aortic rings from WT and CaV1.2KO mice. The arrows indicate the time when nifedipine and 2APB were applied in CaV1.2KO aortic ring. D, representative traces of TG- (10 μm) evoked contraction and the effects of the cumulative addition of nifedipine (1 μm) and ML-9 (25 μm) in aortic rings from WT and CaV1.2KO mice. E, representative contraction of aortic rings from WT and CaV1.2KO mice induced by caffeine (Caf, 10 mm) F, data summary of aortic ring contractions induced by 70K, 5-HT, TG, and Caf from WT (black bars; 70K, 100% ± 5.58; 5-HT, 100% ± 11.23; TG, 100% ± 10.95; Caf, 100% ± 12.10; n = 11–42) and CaV1.2KO mice (red bars; 70K, 51.24% ± 3.17; 5-HT, 46.02% ± 6.42; TG, 66.23% ± 10.22; Caf, 71% ± 18.68; n = 10–31). G, data summary of 5-HT-induced contractions from CaV1.2KO aorta (n = 11) and the effects of 1 μm Nif (64.16% ± 8.70; n = 10), 1 μm Nif + 50 μm 2APB (1.34% ± 0.63; n = 6), or 1 μm Nif + 25 μm ML-9 (5.61% ± 5.61; n = 3). H, data summary showing the effects of 1 μm Nif (85.14% ± 4.15; n = 12), 1 μm Nif + 50 μm 2APB (0.83% ± 0.83; n = 5), and 1 μm Nif + 50 μm ML-9 (4.42% ± 1.93; n = 7) on TG-induced aorta contractions from CaV1.2KO mice (n = 13). Values are the percentage of mean ± S.E. *, p < 0.05, **, p < 0.01, and ***, p < 0.001.
FIGURE 4.
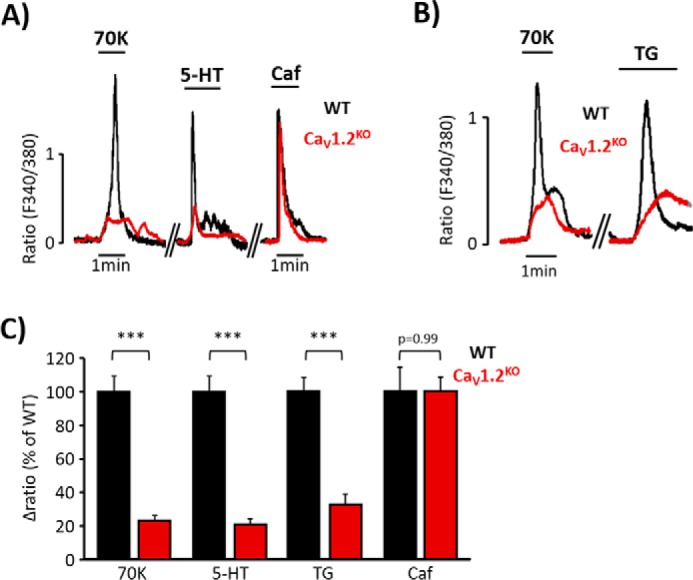
[Ca2+]i increases elicited by serotonin or thapsigargin are diminished in CaV1.2KO mice. A, representative [Ca2+]i changes in aortic VSMC from wild type (WT, black traces) and CaV1.2 knock-out mice (CaV1.2KO, red traces) mice evoked by high KCl (70 mm; 70K), 5-HT (10 μm), and Caf (10 mm). B, representative [Ca2+]i changes of aortic VSMC from WT (black traces) and CaV1.2KO (red traces) mice evoked by 70K and TG (10 μm). C, data summary of [Ca2+]i changes induced by 70K, 5-HT, TG, and Caf in VSMC from WT (black bars; 70K, 100% ± 8.77; 5-HT, 100% ± 13.18; TG, 100% ± 8.57; Caf, 100% ± 14.23; n = 379–1157) and CaV1.2KO mice (red bars; 70K, 22.92% ± 2.82; 5-HT, 20.76% ± 3.94; TG, 26.83% ± 6.18; Caf, 99.88% ± 8.60; n = 190–640). Values are the percentage of mean ± S.E. ***, p < 0.001 versus control.
Effects of Membrane Potential Manipulation on 5-HT and TG Responses
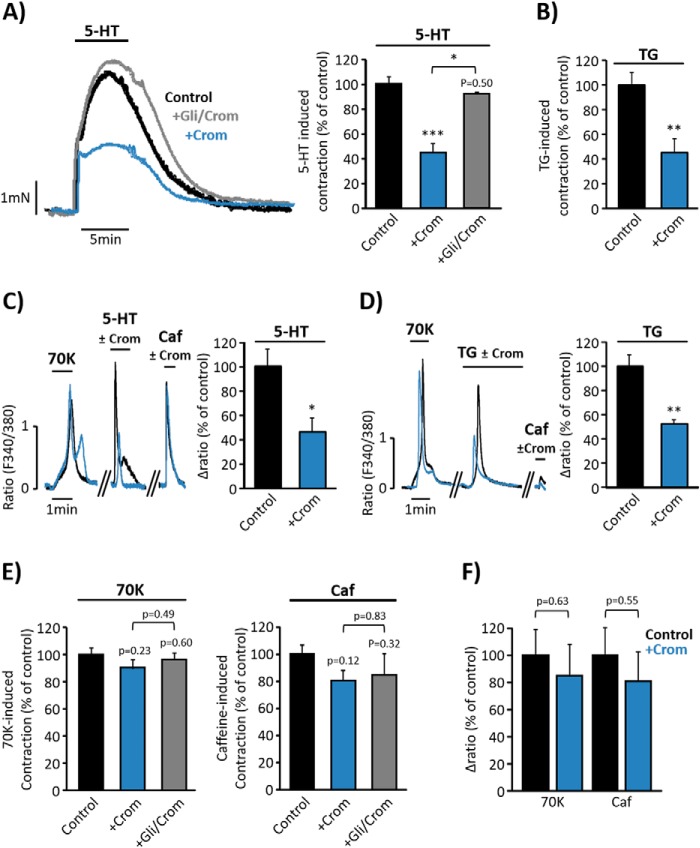
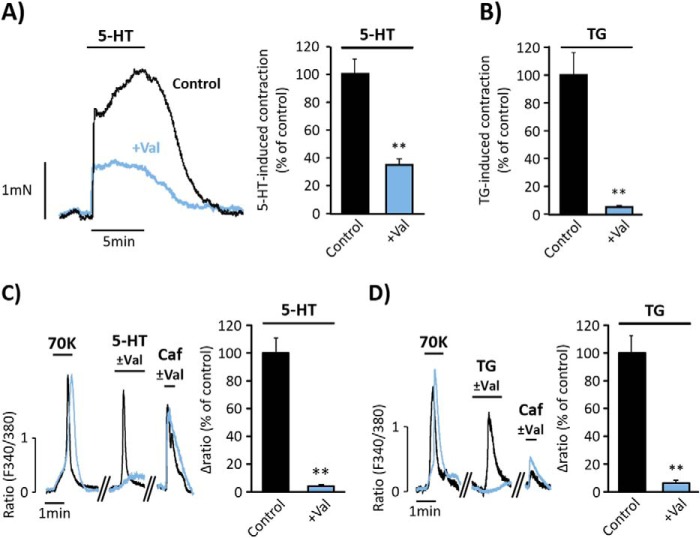
In light of the previous data demonstrating that 5-HT and TG co-activate SOCC and LTCC, we examined whether changes in membrane potential are relevant for the responses to agonists. Therefore, we tested the effect of cromakalim, an agonist of ATP-sensitive K+ channel (KATP) widely used to promote significant hyperpolarization (18). Fig. 5, A and B, show that aorta pre-treatment with cromakalim (20 μm) significantly reduced 5-HT- (10 μm) and TG- (10 μm) induced vasoconstriction, whereas pre-treatment of vessels with glibenclamide (3 μm), an inhibitor of KATP channel (14) that blocks the hyperpolarizing action of cromakalim, efficiently antagonized its effects on 5-HT-induced contraction (Fig. 5A). Moreover, the increase in [Ca2+]i induced by both 5-HT (Fig. 5C) and TG (Fig. 5D) in isolated VSMC was also inhibited by cromakalim (5 μm). Nevertheless, the responses to high KCl or caffeine were not significantly affected by the application of cromakalim neither in aortic rings (Fig. 5E) nor in isolated VSMC (Fig. 5F). To confirm these findings, we explored the effect of valinomycin, a potassium-selective ionophore that promotes hyperpolarization, bringing the membrane potential to values close to the Nernst potential for potassium (19). As shown in Fig. 6, A and B, pre-treatment of aortic rings with valinomycin (500 nm) significantly reduced the effects of 5-HT and TG on vasoconstriction. In addition, incubation of VSMC with valinomycin (100 nm) significantly inhibited 5-HT- (Fig. 6C) and TG- (Fig. 6D) evoked [Ca2+]i increase, whereas the high KCl and caffeine responses were not affected.
FIGURE 5.
Cromakalim attenuates serotonin and thapsigargin responses. A, representative traces and data summary of 5-HT- (10 μm) evoked contraction in aortic rings pre-incubated for 15 min with vehicle (control, black trace and bar; 100% ± 5.73; n = 6), with 20 μm cromakalim (+Crom; blue trace and bar; 44.59% ± 7.16; n = 3) or with 3 μm glibenclamide together with 20 μm cromakalim (+Gli/Crom, gray trace and bar; 92.47% ± 0.72; n = 3). B, data summary of TG- (10 μm) induced contraction in aortic rings pre-incubated for 15 min with vehicle (control, 100% ± 9.70; n = 4) or 20 μm Crom (45.15% ± 10.86; n = 4). C, representative traces of [Ca2+]i changes elicited by high KCl (70 mm, 70K), 10 μm 5-HT, and 10 mm Caf in VSMC pre-incubated for 3 min with vehicle (control, black trace and bar), or with 5 μm Crom (blue trace and bar). Data summaries of 5-HT responses in the presence of vehicle (control, 100% ± 14.44; n = 79) and in the presence of Crom (46.39% ± 10.94; n = 87) are shown. D, representative traces of [Ca2+]i changes elicited by 70K, 2 μm TG, and 10 mm Caf in VSMC pre-incubated for 3 min with vehicle (control, black trace and bar), or with 5 μm Crom (blue trace and bar). Data summaries of [Ca2+]i changes elicited by 2 μm TG applied in control (100% ± 9.30, n = 151) or in the presence of cromakalim (52.36% ± 2.95, n = 94) are shown. E, bar graphs summarize 70K- and caffeine-induced vasoconstriction in control (70K = 100% ± 4.33 and Caf = 100% ± 6.80; n = 6), in rings pretreated for 15 min with 20 μm Crom (70K = 90.09% ± 6.39 and Caf = 80.44% ± 7.68; n = 3), and in rings treated for 15 min with 3 μm glibenclamide + 20 μm cromakalim (+Gli/Crom; 70K = 96.13% ± 5.00; Caf = 84.42% ± 16.32; n = 3). F, data summary of [Ca2+]i changes produced by 70K and Caf (10 mm) in VSMC pre-treated for 3 min with vehicle (control, 70K = 100% ± 18.67 and Caf = 100% ± 20.13; n = 95), or with 5 μm Crom (70K = 84.97% ± 22.55 and Caf = 80.91% ± 21.81; n = 74). Values are the percentage of mean ± S.E. normalized to 70K responses. *, p < 0.05, **, p < 0.01, and ***, p < 0.001.
FIGURE 6.
Valinomycin attenuates serotonin- and thapsigargin-induced vasoconstriction and [Ca2+]i increase. A and B, representative traces and data summary of 5-HT- (10 μm) and TG- (10 μm) evoked contractions in control aortic rings (in black; 5-HT = 100% ± 10.62, n = 9; and TG = 100% ± 16.07; n = 5), and in rings pre-incubated for 15 min with 500 nm valinomycin (+Val, in blue; 5-HT = 35.10% ± 4.67, n = 4 and TG = 5.57% ± 0.53, n = 3). C and D, representative traces and data summary of [Ca2+]i changes elicited by high KCl (70K, 70 mm) 10 μm 5-HT, and 2 μm TG and in control VSMC (5-HT = 100% ± 11.24, n = 93 and TG = 100% ± 12.64, n = 90) and in cells pre-incubated for 3 min with 100 nm valinomycin (5-HT = 3.68% ± 0.63, n = 89 and TG = 6.38% ± 1.95, n = 114). 10 mm Caf was applied at the end of each experiment as indicated. Values are the percentage of mean ± S.E. normalized to 70K responses. **, p < 0.01.
To corroborate the physiological relevance of the co-activation of LTCC and SOCC during agonist stimulation, we explored whether LTCC agonist Bay-K-8644 (BayK) (20) could enhance aorta responses elicited by 5-HT and TG. As shown in Fig. 7, A and B, aortic rings pre-treated with BayK (100 nm) exhibited significantly higher contractions when stimulated with 5-HT and TG as compared with untreated aortic rings. The addition of 2APB (50 μm) efficiently relaxed 5HT- and TG-induced vasoconstriction in BayK-treated arterial rings. Similar increased responses were also observed when high KCl was applied in BayK-treated aorta (Fig. 7C).
FIGURE 7.
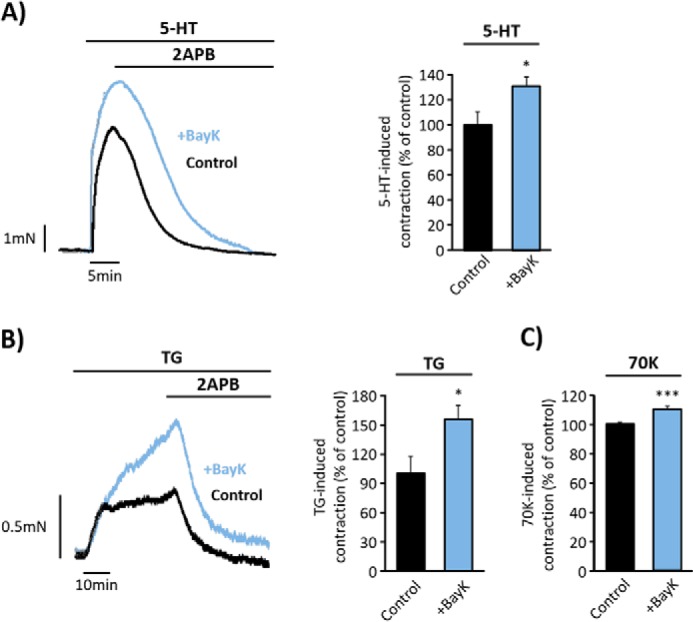
LTCC agonist, BayK, increases endothelium-denuded aorta responses. A and B, representative traces and data summary of 5-HT- (10 μm) and TG- (10 μm) evoked contractions in control aortic rings (in black; 5-HT = 100% ± 10.53, n = 3; and TG = 100% ± 17.57, n = 6) and in rings pre-incubated for 15 min with 100 nm BayK (in blue; 5-HT = 131.30% ± 7.16, n = 4 and TG = 155% ± 13.65, n = 5). 2APB (50 μm) was added as indicated. C, bar graph shows a data summary of high KCl (70K, 70 mm) responses in control rings (100% ± 1.55, n = 11) and in rings pre-incubated with BayK for 15 min (110% ± 1.83, n = 12). Values are the percentage of mean ± S.E. normalized to 70K responses. *, p < 0.05, ***, p < 0.001.
Altogether, these data suggest that vasoconstrictions initiated by 5-HT or SOCE activation with TG are attenuated in hyperpolarized arteries, whereas these responses are potentiated when the LTCC activation threshold is shifted toward hyperpolarized potentials.
Endogenous Distribution of Orai1, TRPC1, and CaV1.2 in VSMC
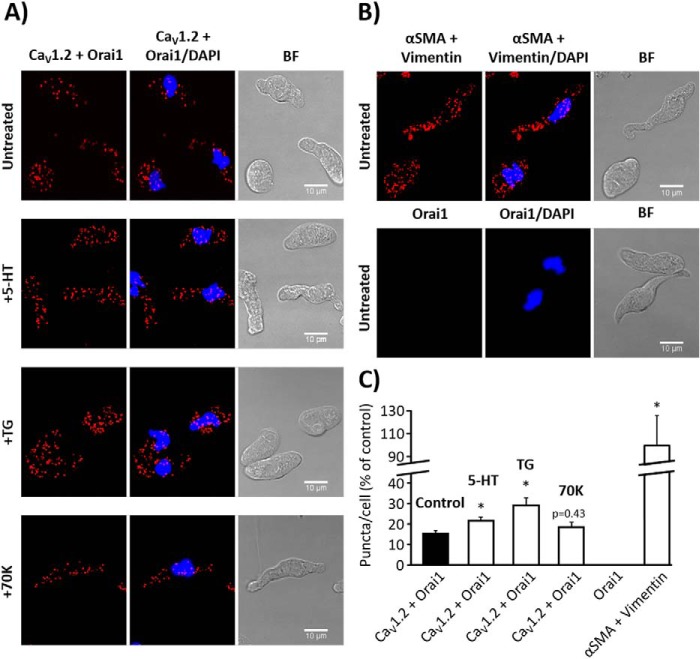
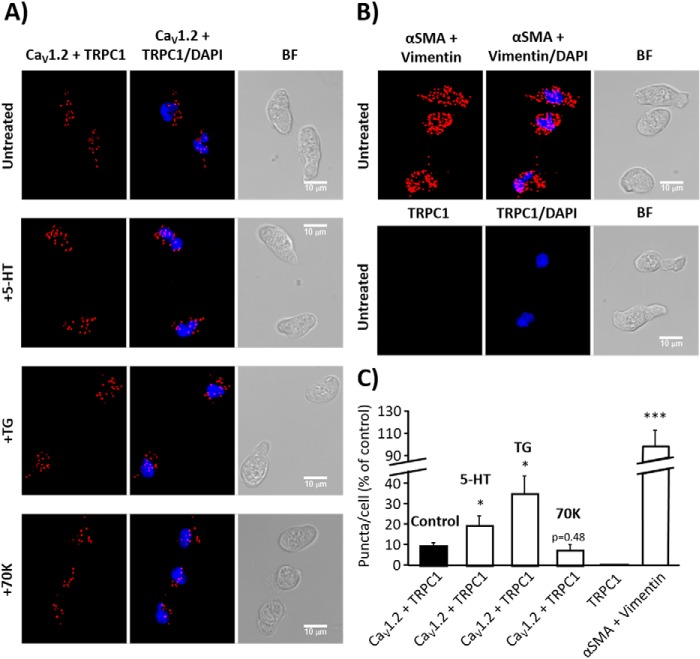
Orai1 and TRPC1 are suggested to interact to form non-selective SOCC in VSMC (8). Several lines of evidence suggest that the CaV1.2 isoform might form a different signal complex with other channels to handle [Ca2+]i in VSMC (10–12). Here, we examined the endogenous subcellular localization of CaV1.2, Orai1, and TRPC1 and their possible interaction by the in situ proximity ligation assay (PLA). Fig. 8, A and C, show a large number of PLA red puncta in VSMC when incubated with primary antibodies against CaV1.2 and Orai1. Meanwhile, no PLA signal was detected in VSMC conjugated only with anti-Orai1 antibody, but without anti-CaV1.2 antibody (Fig. 8, B and C). Similarly, Fig. 9A shows that CaV1.2 interacts with TRPC1, as indicated by a large number of red PLA puncta in VSMC. Interestingly, VSMC stimulation with 5-HT (10 μm) and TG (2 μm), but not with high KCl, significantly increased puncta signals, indicating a significant rise in the interaction of CaV1.2 with Orai1 (Fig. 8, A and C) and TRPC1 (Fig. 9, A and C) after agonist stimulation. These data suggest that Orai1 and TRPC1 interact with CaV1.2 in basal conditions and upon agonist stimulation, which will certainly favor their functional communication upon agonist stimulation to promote intracellular Ca2+ signaling in VSMC.
FIGURE 8.
Orai1 and CaV1.2 co-localization in aortic myocytes. A, representative images of aortic VSMC using primary antibodies against CaV1.2 and Orai1 conjugated with the appropriate PLA probes, from untreated control cells or from cells stimulated with 5-HT (10 μm), TG (2 μm), or high KCl (70K, 70 mm). Red puncta indicate that proteins are in close proximity (<40 nm). The left panels show VSMC images when antibodies were conjugated with PLA probes, the middle panels show merges images from cells also stained with DAPI (blue), and the right panels show bright field (BF) pictures. B, images from VSMC using primary antibodies against α-SMA and vimentin used as positive control (upper panel) and from VSMC conjugated with only anti-Orai1 primary antibody as negative control (lower panel). C, the bar graph summarizes the mean number of PLA signals in untreated control VSMC (15.42% ± 1.50; n = 6), and in VSMC stimulated with 5-HT (21.60% ± 1.65; n = 10), TG (28.90% ± 3.81; n = 8), or 70K (18.33% ± 2.45; n = 8). No detectable PLA puncta were observed in control experiments using cells conjugated only with anti-Orai1 antibody (Orai1, n = 8). The interaction between anti-α-SMA and anti-vimentin antibodies was used as positive control (100% ± 25.88; n = 5). Similar experiments were repeated 3 times. Values are the percentage of mean ± S.E., normalized to positive control. Significance values indicate difference as compared with control, *, p < 0.05.
FIGURE 9.
TRPC1 and CaV1.2 co-localization in aortic myocytes. A, representative images of aortic VSMC using primary antibodies against CaV1.2 and TRPC1 conjugated with the appropriate PLA probes, from untreated control cells or from cells stimulated with 5-HT (10 μm), TG (2 μm), or high KCl (70K, 70 mm). Red puncta indicate that proteins are in close proximity (<40 nm). The left panels show VSMC images when antibodies were conjugated with PLA probes, the middle panels show merge images from cells also stained with DAPI (blue), and the right panels show bright field (BF) pictures. B, images from VSMC using primary antibodies against α-SMA and vimentin used as positive control (upper panel) and from VSMC conjugated with only anti-TRPC1 primary antibody as negative control (lower panel). C, the bar graph summarizes the mean number of PLA signals in control VSMC (9.85% ± 1.53; n = 9), and in 5-HT- (19.98% ± 4.72; n = 8), TG- (35.53% ± 8.78; n = 9), or 70K- (7.72% ± 2.76; n = 4) treated VSMC. No detectable PLA puncta were observed in control experiments using cells conjugated only with anti-TRPC1 antibody (TRPC1, n = 10). The interaction between anti-α-SMA and anti-vimentin antibodies was used as positive control (100% ± 14.63; n = 7). Similar experiments were repeated 3 times. Values are the percentage of mean ± S.E., normalized to positive control. Significance values indicate difference as compared with control, *, p < 0.05, ***, p < 0.001.
Discussion
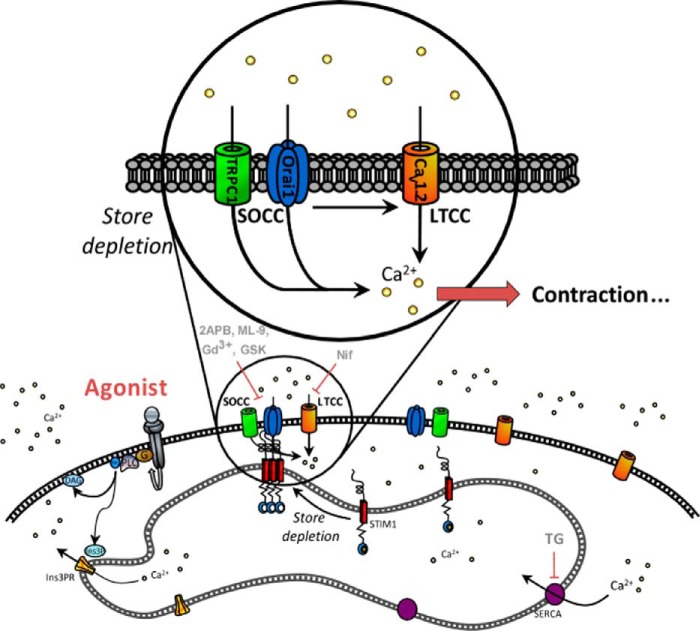
Although it is widely accepted that LTCC and SOCC contribute to the physiopathology of VSMC, their direct functional relationship had remained virtually unexplored. The present study provides new data confirming the role of SOCC in vascular tone regulation, unveiling for the first time a functional crosstalk between CaV1.2, Orai1, and TRPC1 channels that might serve for fine-tuning of vascular smooth muscle Ca2+ signaling, as summarized in the scheme shown in Fig. 10. Routinely, to activate SOCE, pharmacological or physiological agonists were added in the absence of Ca2+, and then extracellular Ca2+ was restored in the well known “Ca2+-free/Ca2+-readmission” or “Ca2+ add-back” protocols (see for example Ref. 5). Nevertheless, there is little information about physiological agonists that can activate SOCE in the continuous presence of extracellular Ca2+, without store depletion, as discussed elsewhere (13). In this study, we demonstrated that 5-HT applied in the presence of extracellular Ca2+ evoked a fast increase of [Ca2+]i, followed by a sustained phase, in isolated VSMC. 5-HT also activated a sustained vasoconstriction in aortic rings. These responses were sensitive to inhibitors of SOCC, supporting the involvement of SOCE in vessel contraction. In fact, we showed that GSK-7975A, which is considered a specific inhibitor of Orai1 (15), as well as other blockers, efficiently inhibited 5-HT-induced responses. Gd3+, 2APB, and ML-9 are still widely used as SOCE inhibitors in different cell types (3), despite their lack of specificity. In this study, the involvement of SOCC in vasoconstriction is also supported by the specific activation with TG, which induced aorta vasoconstriction, indicating that SOCE contributes to vascular tone regulation, in agreement with previous studies (21, 22). Interestingly, we also demonstrated that SOCC sustained Ca2+ entry and vasoconstriction in CaV1.2KO mice, although not enough to completely compensate for the absence of functional LTCC. Our results using the CaV1.2KO mice confirmed the requirement of functional LTCC for vessel contraction even when vasoconstriction was specifically activated through SOCE using TG. These data agree with previous studies using CaV1.2KO mice, which demonstrated that CaV1.2 is essential to control blood pressure and vasoconstrictor responses (17, 23).
FIGURE 10.
Schematic model summarizing Orai1, TRPC1, and CaV1.2 co-activation upon 5-HT stimulation. We propose that 5-HT binding to its receptors promotes InsP3-induced Ca2+ release, depletion of Ca2+ stores, activation of Ca2+ entry through Orai1, and TRPC1-dependent SOCC. The consequent SOCE will trigger secondary activation of LTCC, allowing a significant increase in intracellular free Ca2+ concentration and further aorta contraction.
Furthermore, increasing lines of evidence suggested that SOCE activation could serve not only as an important path for Ca2+ entry, but also as a depolarizing trigger for a secondary activation of LTCC in VSMC (24). Knowing that sarcolemmal K+ channels are key regulators of resting potential in VSMC and vascular tone (25), we demonstrated that 5-HT and TG responses were sensitive to membrane potential changes, as they were attenuated by cromakalim or valinomycin, suggesting a smaller contribution of LTCC under these conditions. Valinomycin is expected to maintain the driving force for Ca2+ entry upon SOCE activation, as it impairs membrane depolarization. This might result in a slight increase in Ca2+ entry via SOCE, which, in our hands did not compensate for the effect of the secondary activation of LTCC. To our knowledge, few studies have suggested that hyperpolarization, due to KCa channel activation, sustained Ca2+ entry through SOCE (for example, in chondrocytes) (26). On the other hand, BayK, which shifts LTCC activation to hyperpolarized potentials, enhanced agonist responses. Thus, our results indicated that agonist responses can be attenuated or potentiated significantly depending on the open probability of LTCC. Similarly, a recent study demonstrated that depletion of SR stimulated SOCE, producing depolarization and LTCC activation in rat myometrium (27). Recently, we have determined that the transient expression of CaV1.2 channel subunits in HEK cells resulted in a significant increase in Ca2+ entry induced by TG, attributed to secondary activation of CaV1.2 channels induced by cation influx via SOCC (28). We have also demonstrated that upon store depletion, STIM1 inhibits Ca2+ entry through LTCC (28), in agreement with studies by other groups (29). Our data suggest that store depletion might promote two independent mechanisms involving the interaction of different components of SOCE with CaV1.2 to fine-tune its activity: Ca2+ influx via SOCE promotes secondary activation of LTCC, and STIM1 modulates CaV1.2 function. Certainly, further investigations are needed to shed more light on this intriguing reciprocal regulation of LTCC by store depletion. In fact, the dual regulation of LTCC by [Ca2+]i increase has been extensively studied in excitable cells, as reviewed recently (30). [Ca2+]i enhancement is known to promote the well characterized Ca2+-dependent inactivation process likely to prevent Ca2+ overload (31), whereas [Ca2+]i increase can also stimulate Ca2+-dependent facilitation of CaV1.2 to potentiate Ca2+ influx, for example, during the excitation-contraction coupling in VSMC (32).
Another important issue that remains under debate is the identity of SOCC in excitable VSMC. Several groups have shown interactions between different proteins to form the SOCE signaling complex as discussed elsewhere (33, 34). Here, using in situ PLA assay, we showed for the first time that endogenous Orai1, TRPC1, and CaV1.2 are distributed in close vicinity. Indeed, hybridization of the PLA probes that occurs when proteins are <40 nm apart (35) confirmed a strong co-localization between these channels. Remarkably, we observed a significant increase of puncta signals in cells incubated with agonists that involve SOCE activation (5-HT through the InsP3 signaling pathway and TG via SERCA inhibition), but not with depolarizing stimulus with high KCl. These data suggest that agonist-induced Ca2+ influx is likely due to a functional interaction/communication between TRPC1- and Orai1-dependent SOCC and CaV1.2 channels in VSMC. Recently, independent studies showed that Orai1 associates with other channels to form the arachidonate-regulated Ca2+ (ARC) channels (36), associates with TRPC1 to form non-selective SOCC (8, 37), or even associates with small conductance Ca2+-activated potassium channel 3 (SK3) (11). Therefore, we provided several lines of evidence demonstrating that the SOCC components, Orai1 and TRPC1, form a macromolecular complex with CaV1.2 LTCC to regulate [Ca2+]i signaling and vascular tone.
Experimental Procedures
Ethical Approval
All experiments were conducted in accordance with the Spanish legislation on protection of animals (Royal Decree 53/2013), conformed to the Directive 2010/63/EU of the European Parliament, and were approved by the local Ethics Committee of Animal Care of the University Hospital Virgen del Rocío (HUVR) of Seville. Mice (strain C57BL/6) were sacrificed by intraperitoneal administration of a lethal dose of sodium thiopental (200 mg/kg).
CaV1.2KO Mouse Model
We used WT and CaV1.2KO mice generated at the Institut für Pharmakologie und Toxikologie, München, Germany (17, 23). CaV1.2KO mice express a tamoxifen-inducible Cre recombinase under control of the SM22 promoter (SM-Cre ERT2(ki)). To induce smooth muscle-specific Cre recombination, adult mice were treated with freshly prepared tamoxifen solution dissolved in corn oil at 10 mg/ml (Sigma) by intraperitoneal injection once a day for 5 days at a dosage of 1 mg/day. CaV1.2KO mice were analyzed between 16 and 18 days after the first injection of tamoxifen, as these animals die between 18 and 21 days (23). The background mouse strain was C57BL/6.
Measurement of Contractility in Arterial Rings
Thoracic aorta was quickly removed and placed in ice-cold Krebs solution (in mm: 118.5 NaCl, 4.7 KCl, 2.5 CaCl2, 24.8 NaHCO3, 1.2 MgSO4, 1.2 KH2PO4, 10 glucose). Then, aorta was cleaned from connective tissue, cut in rings (∼2 mm), and mounted on a small-vessel myograph (J.P. Trading, Aarhus, Denmark) to measure isometric tension connected to a digital recorder (Myodataq-2.01, Myodata-2.02 Multi-Myograph System) as described previously (5). Aorta rings were placed on a chamber filled with Krebs solution at 37 °C bubbled with 95% O2 and 5% CO2. Before the experiments, segments were subjected to a basal tension of 2.5 micronewtons and stabilized for at least 1 h. The endothelium was mechanically removed by rubbing the luminal surface of the ring with a small plastic tube, and the integrity of the endothelium was tested at the beginning of each experiment by the addition of acetylcholine (up to 10 μm) as described previously (38). The data summary presented in bar graphs shows normalized responses of the increment and the difference between the maximum contraction and resting tone of the vasoconstriction.
Preparation of Aortic Smooth Muscle Cells
The segment of thoracic aorta was quickly removed and placed in cold physiological solution (PS) (in mm: 137 NaCl, 5.4 KCl, 0.2 CaCl2, 4.17 NaHCO3, 2 MgCl2, 0.44 KH2PO4, 0.42 NaH2PO4, 10 HEPES, 11.11 glucose, 0.05 EGTA). Aorta was dissected, cleaned, cut into pieces, and incubated with 1–2 mg/ml elastase (4 units/mg) and 4 mg/ml collagenase type I (125 units/mg) (Sigma) in PS for 1 h at 4 °C and then for 10–15 min at 37 °C. Cells were mechanically dispersed using fire-polished glass pipettes and plated on coverslips. VSMC were easily distinguished by their size and typical elongated shape, and samples from dispersed cells were stained with mouse anti-α-SMA antibody (Sigma) or phalloidin (Sigma), a marker for F-actin, to verify preparation of VSMC and to rule out any major presence of fibroblasts or endothelial cells.
Cytosolic Ca2+ Measurement
VSMC plated on coverslips were incubated in PS with 2–5 μm Fura-2AM for 30 min at room temperature, and then cells were washed. For the experiments, a coverslip was placed on the stage of Nikon Eclipse TS-100 inverted microscope equipped with a 20× Fluor objective (0.75 NA), as described previously (5). Fluorescence images from a large number of loaded single cells were recorded and analyzed with a digital fluorescence imaging system (InCyt Basic Im2, Image Solutions (UK) Ltd., Preston, UK) equipped with a light-sensitive CCD camera (Cooke PixelFly, Applied Scientific Instrumentation, Eugene, OR). Changes in [Ca2+]i are represented as the ratio of Fura-2 fluorescence induced at an emission wavelength of 510 nm due to excitation at 340 and 380 nm (ratio = F340/F380). Ca2+ influx was calculated as the difference between the peak ratio before and after the addition of different drugs (Δratio). Data summaries are normalized to control values obtained in each cell preparation as indicated in the figure legends. Auto-fluorescence was determined at the end of each experiment by the addition of ionomycin and MnCl2. Experiments were performed using a continuous perfusion system in physiological salt solution (in mm, pH = 7.4: 140 NaCl, 2.5 CaCl2, 2.7 KCl, 1 MgCl2, 10 HEPES, 10 Glucose). High KCl solution was also used (in mm, pH = 7.4: 70 NaCl, 2.5 CaCl2, 70 KCl, 1 MgCl2, 10 HEPES, 10 glucose).
Protein Extraction and Western Blotting
Dissected arteries from mice were flash-frozen in an ice-cold mixture of 10% TCA and 10 mm DTT in acetone. Arteries were later washed in ice-cold acetone containing 10 mm DTT and lyophilized overnight. Prior to protein extraction, the lyophilized vessels were weighted in an ultra-precision scale to normalize the Western blotting load. 1 μl of sample buffer (60 mm Tris HCl, pH 6.8, 10% glycerol, 2% SDS, 0.01% bromphenol blue, 100 mm DTT) was added for each 2 μg of artery for protein extraction. Samples were heated at 95 °C for 10 min and rotated overnight at 4 °C prior to electrophoresis. Similar amounts of protein samples extracted from WT and CaV1.2KO mice were subjected to SDS-PAGE (10%) and electro-transferred onto nitrocellulose membranes. After blocking with 5% nonfat dry milk dissolved in Tris-buffered saline containing 0.1% Tween 20 (TTBS) for 2 h at room temperature, Western blots were probed overnight at 4 °C or for 1.5 h at room temperature with specific primary antibodies in blocking solution. After washing, membranes were incubated for 1 h at room temperature with a horseradish peroxidase-conjugated anti-rabbit or anti-mouse IgG (Jackson ImmunoResearch Laboratories) in TTBS. Detection was performed with the enhanced chemiluminescence reagent ECL Plus (Amersham Biosciences) and the ImageQuant LAS 4000 Mini Gold system. Primary antibodies used were: rabbit anti-CaV1.2 (1:200, Alomone Labs) and mouse anti-α-tubulin (1:5000, Sigma) as housekeeping loading control. For quantification, tiff images were analyzed with ImageJ software.
In Situ Proximity Ligation Assay
Spatial co-localization of CaV1.2 and Orai1 were analyzed with PLA technology in freshly isolated aortic myocytes using the Duolink in situ PLA detection kit Red (Sigma), following the manufacturer's instructions. VSMC were seeded in a six-channel μ-Slide from IBIDI and fixed with 100% cold methanol for 5 min. VSMC were blocked for 30 min with 3% heat-inactivated goat serum and 1% BSA in PBS and incubated with primary antibodies (rabbit anti-CaV1.2, 1:50 (Alomone Labs); mouse anti-Orai1, 1:100 (Novus Biologicals); or mouse anti-TRPC1 1:50 in blocking solution (Santa Cruz Biotechnology)) for 2 h at room temperature. Cells were labeled with Duolink PLA anti-rabbit PLUS and anti-mouse MINUS probes for 1 h at 37 °C. The secondary antibodies of PLA PLUS and MINUS probes were attached to synthetic oligonucleotides that hybridize when they are in close proximity (i.e. <40 nm separation). The hybridized oligonucleotides were then ligated for 30 min at 37 °C prior to rolling circle amplification for 100 min at 37 °C. Fluorescently labeled oligonucleotides hybridized to the rolling circle amplification product. The red fluorescent fluorophore-tagged oligonucleotides were visualized using a confocal microscope (Leica TCS SP2). Maximum intensity projections of all z-sections (0.5 μm) were obtained by ImageJ software, and puncta of maximum intensity projections were analyzed by Duolink ImageTool software (Sigma). The interaction between anti-α-SMA and anti-vimentin antibodies was used as positive control (Fig. 8B). As a negative control, we conducted experiments using only one primary antibody (mouse anti-Orai1 or anti-TRPC1 antibodies), which did not show any detectable PLA signal (Fig. 8C).
Confocal Acquisition
Direct confocal acquisition of fluorescence was performed using a Leica TCS SP2 microscope (Leica) equipped with a blue diode at 405 nm, argon-krypton at 458–514 nm, helium-neon at 543 nm, and helium-neon at 633 nm. Images were acquired using a HCX Pl Apo CS 63×/1.3 immersion objective in z-stack intervals of 0.5 μm. Confocal acquisition of fluorescence labels was performed as follows: DAPI (excited at 405 nm and recorded on 400–450 nm) and Alexa Fluor 594 (excited at 594 nm and recorded at 593–667 nm). All figures were processed and mounted by ImageJ software (ConfocalUniovi 1.5 ImageJ), and image deconvolution was conducted using an ImageJ plugin for spectral image deblurring (Parallel Spectral Deconvolution) based on a generalized Tikhonov regularization method (39).
Drugs
Drugs were purchased from Sigma, Invitrogen, and Aobious. The concentration of some inhibitors tested in this study varied when they were used in vessels or cells, but all were within the range of their optimum effects. Higher concentrations were used in rings to ensure inhibitor permeability in thick aorta.
Statistical Analysis
Data analysis was carried out using SigmaPlot software, version 11.0. A sample size calculation was performed prior to the start of this study. We expected a decrease of ∼50–100% in vasoreactivity using CaV1.2KO mice. We decided to include at least 3–5 subjects for each experiment, taking into consideration an α of 5% and power of 90% or an α of 1% and power of 80% and keeping in mind the failed experiments. Statistical analyses were performed by Student's t test for two-group comparison or one-way analysis of variance followed by Tukey multiple comparison post hoc tests comparing different groups. Group data are presented as the percentage of mean ± S.E. and p values < 0.05, <0.01, and <0.001 were considered significant as indicated in the figures with *, **, and ***, respectively.
Author Contributions
J. A. M., E. C. S., P. G. R., and T. S. conceived and designed experiments. J. A. M., E. C. S., P. G. R., F. M. Q., J. A. R., A. C., and T. S. collected, analyzed, and interpreted data. F. M. Q., J. A. R., A. C., A. O., and T. S. drafted the article or revised it critically for important intellectual content. All authors approved the final version for publication.
This work was supported by grants from the Spanish Ministry of Economy and Competitiveness (BFU2013-45564-C2-1-P; BFU2013-45564-C2-2-P); the Institute of Carlos III and Cardiovascular Network “RIC” (RD12/0042/0041; PI12/00941); and the Andalusia Government (PI-0108-2012; P12-CTS-1965). The authors declare that they have no conflicts of interest with the contents of this article.
- SR
- sarcoplasmic reticulum
- LTCC
- L-type Ca2+ channel(s)
- SOCC
- store-operated Ca2+ channel(s)
- SOCE
- store-operated Ca2+ entry
- VSMC
- vascular smooth muscle cell(s)
- InsP3
- inositol trisphosphate
- 2APB
- 2-aminoethoxydiphenyl borate
- 5-HT
- serotonin
- BayK
- Bay-K-8644
- GSK
- GSK-7975A
- ML-9
- 1-(5-chloronaphthalen-1-yl) sulfonyl-1,4-diazepane
- PLA
- proximity ligation assay
- SERCA
- sarco-endoplasmic reticulum calcium ATPase
- TG
- thapsigargin
- PS
- physiological solution
- SMA
- smooth muscle actin
- Nif
- nifedipine
- Caf
- caffeine
- Crom
- cromakalim
- WT
- wild type
- Gd3+
- gadolinium.
References
- 1. Catterall W. A. (2011) Voltage-gated calcium channels. Cold Spring Harb. Perspect. Biol. 3, a003947. [DOI] [PMC free article] [PubMed] [Google Scholar]
- 2. Bolton T. B. (1979) Mechanisms of action of transmitters and other substances on smooth muscle. Physiol. Rev. 59, 606–718 [DOI] [PubMed] [Google Scholar]
- 3. Parekh A. B., and Putney J. W. Jr. (2005) Store-operated calcium channels. Physiol. Rev. 85, 757–810 [DOI] [PubMed] [Google Scholar]
- 4. Smani T., Zakharov S. I., Csutora P., Leno E., Trepakova E. S., and Bolotina V. M. (2004) A novel mechanism for the store-operated calcium influx pathway. Nat. Cell Biol. 6, 113–120 [DOI] [PubMed] [Google Scholar]
- 5. Smani T., Domínguez-Rodríguez A., Hmadcha A., Calderón-Sánchez E., Horrillo-Ledesma A., and Ordóñez A. (2007) Role of Ca2+-independent phospholipase A2 and store-operated pathway in urocortin-induced vasodilatation of rat coronary artery. Circ. Res. 101, 1194–1203 [DOI] [PubMed] [Google Scholar]
- 6. Smani T., Patel T., and Bolotina V. M. (2008) Complex regulation of store-operated Ca2+ entry pathway by PKC-ϵ in vascular SMCs. Am. J. Physiol. Cell Physiol. 294, C1499–C1508 [DOI] [PubMed] [Google Scholar]
- 7. Hogan P. G., and Rao A. (2015) Store-operated calcium entry: mechanisms and modulation. Biochem. Biophys. Res. Commun. 460, 40–49 [DOI] [PMC free article] [PubMed] [Google Scholar]
- 8. Rodríguez-Moyano M., Díaz I., Dionisio N., Zhang X., Avila-Medina J., Calderón-Sánchez E., Trebak M., Rosado J. A., Ordóñez A., and Smani T. (2013) Urotensin-II promotes vascular smooth muscle cell proliferation through store-operated calcium entry and EGFR transactivation. Cardiovasc. Res. 100, 297–306 [DOI] [PMC free article] [PubMed] [Google Scholar]
- 9. Cheng K. T., Ong H. L., Liu X., and Ambudkar I. S. (2011) Contribution of TRPC1 and Orai1 to Ca2+ entry activated by store depletion. Adv. Exp. Med. Biol. 704, 435–449 [DOI] [PMC free article] [PubMed] [Google Scholar]
- 10. Kwan H. Y., Shen B., Ma X., Kwok Y. C., Huang Y., Man Y. B., Yu S., and Yao X. (2009) TRPC1 associates with BKCa channel to form a signal complex in vascular smooth muscle cells. Circ. Res. 104, 670–678; Correction (2009) Circ. Res.105, e6 [DOI] [PubMed] [Google Scholar]
- 11. Song K., Zhong X. G., Xia X. M., Huang J. H., Fan Y. F., Yuan R. X., Xue N. R., Du J., Han W. X., Xu A. M., and Shen B. (2015) Orai1 forms a signal complex with SK3 channel in gallbladder smooth muscle. Biochem. Biophys. Res. Commun. 466, 456–462 [DOI] [PubMed] [Google Scholar]
- 12. Spinelli A. M., and Trebak M. (2016) Orai channel-mediated Ca2+ signals in vascular and airway smooth muscle. Am. J. Physiol. Cell Physiol. 310, C402–413 [DOI] [PMC free article] [PubMed] [Google Scholar]
- 13. Beech D. J. (2012) Orai1 calcium channels in the vasculature. Pflugers Arch. 463, 635–647 [DOI] [PMC free article] [PubMed] [Google Scholar]
- 14. Smani T., Hernández A., Ureña J., Castellano A. G., Franco-Obregón A., Ordoñez A., and López-Barneo J. (2002) Reduction of Ca2+ channel activity by hypoxia in human and porcine coronary myocytes. Cardiovasc Res. 53, 97–104 [DOI] [PubMed] [Google Scholar]
- 15. Derler I., Schindl R., Fritsch R., Heftberger P., Riedl M. C., Begg M., House D., and Romanin C. (2013) The action of selective CRAC channel blockers is affected by the Orai pore geometry. Cell Calcium 53, 139–151 [DOI] [PMC free article] [PubMed] [Google Scholar]
- 16. Bird G. S., DeHaven W. I., Smyth J. T., and Putney J. W. Jr. (2008) Methods for studying store-operated calcium entry. Methods 46, 204–212 [DOI] [PMC free article] [PubMed] [Google Scholar]
- 17. Fernández-Tenorio M., González-Rodríguez P., Porras C., Castellano A., Moosmang S., Hofmann F., Ureña J., and López-Barneo J. (2010) Short communication: genetic ablation of L-type Ca2+ channels abolishes depolarization-induced Ca2+ release in arterial smooth muscle. Circ. Res. 106, 1285–1289 [DOI] [PubMed] [Google Scholar]
- 18. He X. D., and Goyal R. K. (2012) CaMKII inhibition hyperpolarizes membrane and blocks nitrergic IJP by closing a Cl− conductance in intestinal smooth muscle. Am. J. Physiol. Gastrointest. Liver Physiol. 303, G240–G246 [DOI] [PMC free article] [PubMed] [Google Scholar]
- 19. Tanner M. K., and Wellhausen S. R. (1998) Flow cytometric detection of fluorescent redistributional dyes for measurement of cell transmembrane potential. Methods Mol. Biol. 91, 85–95 [DOI] [PubMed] [Google Scholar]
- 20. Rampe D., and Dage R. C. (1992) Functional interactions between two Ca2+ channel activators, (S)-Bay K 8644 and FPL 64176, in smooth muscle. Mol. Pharmacol. 41, 599–602 [PubMed] [Google Scholar]
- 21. Domínguez-Rodríguez A., Díaz I., Rodríguez-Moyano M., Calderón-Sánchez E., Rosado J. A., Ordóñez A., and Smani T. (2012) Urotensin-II signaling mechanism in rat coronary artery: role of STIM1 and Orai1-dependent store operated calcium influx in vasoconstriction. Arterioscler. Thromb. Vasc. Biol. 32, 1325–1332 [DOI] [PubMed] [Google Scholar]
- 22. Park K. M., Trucillo M., Serban N., Cohen R. A., and Bolotina V. M. (2008) Role of iPLA2 and store-operated channels in agonist-induced Ca2+ influx and constriction in cerebral, mesenteric, and carotid arteries. Am. J. Physiol. Heart Circ. Physiol. 294, H1183–1187 [DOI] [PubMed] [Google Scholar]
- 23. Moosmang S., Schulla V., Welling A., Feil R., Feil S., Wegener J. W., Hofmann F., and Klugbauer N. (2003) Dominant role of smooth muscle L-type calcium channel CaV1.2 for blood pressure regulation. EMBO J. 22, 6027–6034 [DOI] [PMC free article] [PubMed] [Google Scholar]
- 24. Bolotina V. M. (2012) Orai1, STIM1, and iPLA2β determine arterial vasoconstriction. Arterioscler. Thromb. Vasc. Biol. 32, 1066–1067 [DOI] [PubMed] [Google Scholar]
- 25. Nelson M. T., and Quayle J. M. (1995) Physiological roles and properties of potassium channels in arterial smooth muscle. Am. J. Physiol. 268, C799–C822 [DOI] [PubMed] [Google Scholar]
- 26. Funabashi K., Ohya S., Yamamura H., Hatano N., Muraki K., Giles W., and Imaizumi Y. (2010) Accelerated Ca2+ entry by membrane hyperpolarization due to Ca2+-activated K+ channel activation in response to histamine in chondrocytes. Am. J. Physiol. Cell Physiol. 298, C786–797 [DOI] [PubMed] [Google Scholar]
- 27. Noble D., Borysova L., Wray S., and Burdyga T. (2014) Store-operated Ca2+ entry and depolarization explain the anomalous behaviour of myometrial SR: effects of SERCA inhibition on electrical activity, Ca2+ and force. Cell Calcium 56, 188–194 [DOI] [PMC free article] [PubMed] [Google Scholar]
- 28. Dionisio N., Smani T., Woodard G. E., Castellano A., Salido G. M., and Rosado J. A. (2015) Homer proteins mediate the interaction between STIM1 and CaV1.2 channels. Biochim. Biophys. Acta 1853, 1145–1153 [DOI] [PubMed] [Google Scholar]
- 29. Wang Y., Deng X., Mancarella S., Hendron E., Eguchi S., Soboloff J., Tang X. D., and Gill D. L. (2010) The calcium store sensor, STIM1, reciprocally controls Orai and CaV1.2 channels. Science 330, 105–109 [DOI] [PMC free article] [PubMed] [Google Scholar]
- 30. Hofmann F., Flockerzi V., Kahl S., and Wegener J. W. (2014) L-type CaV1.2 calcium channels: from in vitro findings to in vivo function. Physiol. Rev. 94, 303–326 [DOI] [PubMed] [Google Scholar]
- 31. Barrett C. F., and Tsien R. W. (2008) The Timothy syndrome mutation differentially affects voltage- and calcium-dependent inactivation of CaV1.2 L-type calcium channels. Proc. Natl. Acad. Sci. U.S.A. 105, 2157–2162 [DOI] [PMC free article] [PubMed] [Google Scholar]
- 32. Saponara S., Sgaragli G., and Fusi F. (2008) Quercetin antagonism of Bay K 8644 effects on rat tail artery L-type Ca2+ channels. Eur. J. Pharmacol. 598, 75–80 [DOI] [PubMed] [Google Scholar]
- 33. Vaca L. (2010) SOCIC: the store-operated calcium influx complex. Cell Calcium 47, 199–209 [DOI] [PubMed] [Google Scholar]
- 34. Berna-Erro A., Redondo P. C., and Rosado J. A. (2012) Store-operated Ca2+ entry. Adv. Exp. Med. Biol. 740, 349–382 [DOI] [PubMed] [Google Scholar]
- 35. Söderberg O., Leuchowius K. J., Gullberg M., Jarvius M., Weibrecht I., Larsson L. G., and Landegren U. (2008) Characterizing proteins and their interactions in cells and tissues using the in situ proximity ligation assay. Methods 45, 227–232 [DOI] [PubMed] [Google Scholar]
- 36. Mignen O., Thompson J. L., and Shuttleworth T. J. (2009) The molecular architecture of the arachidonate-regulated Ca2+-selective ARC channel is a pentameric assembly of Orai1 and Orai3 subunits. J. Physiol. 587, 4181–4197 [DOI] [PMC free article] [PubMed] [Google Scholar]
- 37. Desai P. N., Zhang X., Wu S., Janoshazi A., Bolimuntha S., Putney J. W., and Trebak M. (2015) Multiple types of calcium channels arising from alternative translation initiation of the Orai1 message. Science signaling 8, ra74. [DOI] [PMC free article] [PubMed] [Google Scholar]
- 38. Smani T., Calderon E., Rodriguez-Moyano M., Dominguez-Rodriguez A., Diaz I., and Ordóñez A. (2011) Urocortin-2 induces vasorelaxation of coronary arteries isolated from patients with heart failure. Clin. Exp. Pharmacol. Physiol. 38, 71–76 [DOI] [PubMed] [Google Scholar]
- 39. Hansen P. C., Nagy J. G., and O'Leary D. P. (2006) Deblurring Images: Matrices, Spectra, and Filtering, Society for Industrial and Applied Mathematics (SIAM), Philadelphia, PA [Google Scholar]


