

Abstract
Cerebral perivascular spaces (PVS) are small physiological structures around blood vessels in the brain. MRI visible PVS are associated with ageing and cerebral small vessel disease (SVD). 7 Tesla (7T) MRI improves PVS detection. We investigated the association of age, vascular risk factors, and imaging markers of SVD with PVS counts on 7 T MRI, in 50 persons aged ≥ 40. The average PVS count ± SD in the right hemisphere was 17 ± 6 in the basal ganglia and 71 ± 28 in the semioval centre. We observed no relation between age or vascular risk factors and PVS counts. The presence of microbleeds was related to more PVS in the basal ganglia (standardized beta 0.32; p = 0.04) and semioval centre (standardized beta 0.39; p = 0.01), and white matter hyperintensity volume to more PVS in the basal ganglia (standardized beta 0.41; p = 0.02). We conclude that PVS counts on 7T MRI are high and are related SVD markers, but not to age and vascular risk factors. This latter finding may indicate that due to the high sensitivity of 7T MRI, the correlation of PVS counts with age or vascular risk factors may be attenuated by the detection of “normal”, non-pathological PVS.
Keywords: Cerebrovascular disease, aging, brain imaging, MRI, microcirculation, physiology
Introduction
Perivascular spaces (PVS) are extensions of the extracerebral fluid space around arteries, arterioles, veins, and venules, as they course from the brain surface into and through the brain parenchyma. Physiologically, PVS are drainage conduits of interstitial fluid1,2 and contain leucocytes that are important in regulating immunological responses3. PVS are a common MRI finding4, and are mainly observed in the basal ganglia (BG) and the semioval centre (CSO), where they follow the course of penetrating arteries.5 Their signal intensity is similar to cerebrospinal fluid, which means that they have a high-signal intensity on T2- and a low-signal intensity on T1-weighted images and do not show diffusion restriction on diffusion weighted images (DWI).6,7
PVS are small, as their diameter rarely exceeds 2–3 mm. This limits their visibility on routine clinical 1.5 or 3 Tesla (1.5 or 3T) MRI sequences. Increased numbers of PVS are considered as a MRI feature of ageing and cerebral small vessel disease (SVD).8 In this context, PVS have frequently been referred to as “dilated” or “enlarged”, solely because of the fact that they became visible on MRI, or because a minimum size criterion was used (usually 1 mm).9 However, the relation between PVS size and the severity of SVD is not well understood. According to the STandards for ReportIng Vascular changes on nEuroimaging (STRIVE) criteria, terms like “dilated” or “enlarged” should be avoided,7 because in addition to their actual size, the visibility of PVS also depends on MRI field strength and MRI sequence characteristics. Most in vivo MRI studies that assessed PVS used semi-quantitative rating scales, with two or more categories of PVS numbers, and generally did not measure PVS size or volume. Scan acquisition and rating methods vary across studies, which may explain the differences in observations across previous studies on PVS. Age, for example, was not related to PVS ratings in all studies,10,11 and, in some studies, age was only related to BG but not to CSO PVS,12–14 while in other studies the opposite was found.15,16
Microscopically, PVS are highly prevalent throughout the healthy brain, which means that their visibility on MRI will probably increase when image resolution increases. Visualization of PVS may be improved at 7T compared with routine clinical MRI, leading to the detection of more and smaller PVS, which may benefit the study of PVS and their relation with ageing and SVD. Autopsy studies have indicated that PVS enlargement is one of the earliest microscopic features of vascular disease in subjects with dementia.17 This indicates that not only relatively large PVS that are visible on conventional MRI but also the small PVS that can be visualized with 7T MRI could be a marker of underlying SVD.
In this study, our aim was to use state-of-the-art, high-resolution T2-weighted 7T MRI to evaluate PVS numbers in relation to age, common vascular risk factors, and imaging markers of SVD, in community-dwelling individuals.
Methods
Participants
Participants were selected from two cohorts with an identical 7T protocol and otherwise largely similar work-up: The second Utrecht Diabetic Encephalopathy Study (UDES2), a study on MRI-correlates of type 2 diabetes mellitus (DM) that included patients with and controls without diabetes aged 65–80,18 and the PREDICT-MR study, a cohort MR study of individuals attending their general practitioner, not selected for the presence of specific medical conditions.19,20 Both UDES2 and PREDICT-MR recruited independently living subjects from general practices in Utrecht and surrounding areas. PREDICT-MR and UDES2 were approved by the medical ethics committee of the University Medical Center Utrecht (UMCU), and all subjects gave written informed consent. The guidelines of the Declaration of Helsinki of 1975 were followed. All participants underwent a standardized evaluation, including medical history, physical (e.g., blood pressure), neurological, and neuropsychological examination. On the same day, all participants underwent 7T MRI with 1.5T MRI in the PREDICT-MR or with 3T MRI in the UDES2 study.
From the UDES2 cohort, all subjects without DM were considered eligible for inclusion in the present study. A random sample of participants with DM was added, to ensure that the prevalence of DM in our study cohort was in accordance with the prevalence of DM of 14–21% in the Dutch population aged ≥ 40 years.21 For the PREDICT-MR study, 629 patients were invited to participate, of whom 125 (20%) consented to take part. Between participants and none participants, there was no difference in age (mean ± SD: 53 ± 12 versus 52 ± 16, respectively, p = 0.15), gender (% males: 42% versus 36%, p = 0.18), education level (median (range): 5 (3–7) versus 5 (3–7), smoking (% smokers: 18% versus 19%, p = 0.92), and physical functioning (mean score ± SD: 49 ± 9 versus 49 ± 9, p = 0.62) or mental functioning (mean score ± SD: 50 ± 10 versus 52 ± 9, p = 0.15) assessed with the 12 Item Short Form Health Survey (SF 12).22
Of the 125 PREDICT-MR participants, 50 underwent a 7T MRI. There were no significant differences in characteristics such as age, gender, educational level, smoking, between participants with and without a 7T MRI. All subjects from the PREDICT-MR cohort were evaluated for inclusion in the current study. Participants from both cohorts were considered eligible for the current study if they met the following criteria: (1) age 40 years or older; (2) no dementia or other known major neurological conditions; (3) no recent non-disabling stroke (<2 years) or any disabling stroke (i.e., all subjects were functionally independent and living at home); (4) the 7T MRI protocol included a T2 turbo spin-echo (TSE) sequence needed for detection of PVS.
The original UDES2 study population included 61 participants without DM. The T2-weighted TSE sequence was added to the 7T MRI protocol later in the study (February 2011), leaving 17 subjects without DM that met our criteria and had a T2-weighted TSE sequence. From the subjects with DM who also had T2-weighted TSE sequence, four were randomly selected and added. From the 50 participants of the PREDICT-MR study with a 7T MRI, 47 had a T2-weighted TSE and met our criteria. Five participants from UDES2 and 13 from PREDICT-MR were excluded because they had ungradeable images due to motion artefacts, leaving a total of 50 subjects that could finally be included in the current study (Figure 1).
Figure 1.

Flowchart showing the in- and exclusion of subjects from the UDES2 and PREDICT-MR study.
MR imaging
All subjects underwent 7T (Philips Healthcare, Cleveland, OH, USA) and 1.5 or 3T MRI scanning (Philips Medical Systems, Best, The Netherlands). The 7T MRI scanner had a volume transmit and 16 or 32-channel receive head coil (Nova Medical, Wilmington, MA, USA). The 7T MRI imaging was used for assessing PVS and to detect cerebral microbleeds (CMBs). The scans obtained at the conventional 1.5T or 3T field strength were used to assess other markers of SVD (such as WMH and atrophy, as described in detail below). In brief, main 7T scan parameters were (i) a 3D T2-weighted TSE sequence with an acquired resolution of 0.7 × 0.7 × 0.7 mm3, TR = 3158 ms, TSE factor 182, nominal TE = 301 ms with a variable refocusing flip angle sweep, leading to an equivalent TE (for T2 contrast) of approximately 58 ms for white matter, matrix size = 356 × 357, scan duration 10 min 15 s, and (ii) a dual echo 3D T2*-weighted sequence, with TR/first TE/second TE 20/2.5/15 ms, an acquired voxel size of 0.4 × 0.4 × 0.6 mm3, reconstructed to 0.35 × 0.35 × 0.3 mm3, scan duration 9 min 18 s.
In the UDES2 study, the 3T MRI protocol included a fluid attenuation inversion recovery (FLAIR) sequence (TR/TI/TE 11000/2800/125 ms, voxel size 0.96 × 0.95 × 3.00 mm3), a 3D T1-weighted sequence (TR/TE 7.9/4.5 ms, voxel size 1.0 × 1.0 × 1.0 mm3) and a dual-echo T2-weighted sequence (TR/TE1/TE2 3198/19/140 ms, voxel size 0.96 × 0.95 × 3.00 mm3).
In the PREDICT-MR, the 1.5T MRI protocol included a 3D FLAIR sequence (TR/TI/TE 4800/1600/317 ms, voxel size 1.1 × 1.1 × 1.1 mm3), a 3D T1-weighted sequence (TR/TE 6.8/3.1 ms, voxel size 1.1 × 1.1 × 1.1 mm3), and a dual-echo T2-weighted sequence (TR/TE1/TE2 2200/11/100 ms, voxel size 0.90 × 1.0 × 4.0 mm3).
Assessment of PVS
PVS were assessed on two locations: at the level of the BG and in the CSO. All scans were anonymized before rating, and all ratings were performed blinded to subject characteristics. A slightly modified version of a recently published method9 was used to select a single transverse slice at both locations, on which PVS were counted manually by two raters. In the BG, the slice that showed the anterior commissure was used. The anterior and posterior border zones of the region of interest were the anterior end of the insula and the posterior end of the thalamus, respectively. In the CSO, the slice 1 cm above the most cranial slice at which the lateral ventricles were visible was used (Figure 2), and on the selected slice all PVS that were visible in the white matter were counted. PVS were assessed as follows: a localizer was placed on each hyperintensity on the selected axial slice that could correspond to a PVS based on its visual features. The location of the localizer was simultaneously displayed in sagittal and coronal direction, to appreciate the 3D shape of possible PVS. PVS were defined as hyperintense, tubular structures, and were distinguished from white matter lesions and lacunar infarcts by their vessel-like shape. No size criterion was used. If the observer identified the structure being displayed as a PVS, a marker was placed at its location on the axial slice, and the observer proceeded to the next possible PVS. Finally, the list of all markers indicating PVS was saved, and the total number of PVS was recorded. All imaging viewing and processing was performed with MeVisLab (MeVis Medical Solutions AG, Bremen, Germany).23
Figure 2.

Selection of the slices on which PVS were counted and example of PVS counting. (a) 35 mm sagittal maximum intensity projection (maxIP) showing the slices on two slices on which PVS were counted in the BG and CSO. (b) The selected slice in the CSO. A magnification of the white box is shown in C. (c) An example PVS rating: the green dots were scored as PVS.
All scans were analyzed by two raters (WHB and RR), and the mean score of the two raters was used. Our rating method showed good inter-rater agreement (PVS counts in the BG: intra-class correlation coefficient (ICC) 0.7, and PVS in the CSO: ICC 0.8), but was time intensive (approximately 45–60 min for one hemisphere per rater). Therefore, PVS were counted in the right hemisphere only, assuming that this unilateral count would be representative for both hemispheres. In one subject, PVS were counted in the left hemisphere because of an unexpected subclinical large vessel infarct in the right hemisphere.
Other MRI measures
Other MRI measures that were assessed were the following: WMH, brain parenchymal fraction, infarcts, and CMBs. WMH were manually delineated on the 1.5T or 3T FLAIR images. WMH volumes were calculated using MeVisLab software (MeVis Medical Solutions AG, Bremen, Germany).23 WMH volume was expressed relative to intracranial volume as WMH% = (WMH volume/intracranial volume) * 100. WMH volumes were natural log transformed because they were not normally distributed. Intracranial volume was derived from manual delineation on T2-weighted images. Total brain volumes were determined on 1.5 or 3T MRI with the Statistical Parametric Mapping software package (SPM12, www.fil.ion.ucl.ac.uk/spm), executed in Matlab (MathWorks, Natick, MA, USA) and visually checked. Total brain volume was expressed relative to the intracranial volume as brain parenchymal fraction = (total brain volume/intracranial volume) * 100. Brain infarcts were rated visually on 1.5 or 3T FLAIR and T1-weighted images and classified as large vessel infarcts (>1.5 cm) or lacunar infarcts.7
CMB rating was performed on 7T T2*-weighted images by a previously described semi-automatic method based on the radial symmetry transform (RST).24 CMBs were divided into deep and lobar CMBs according to the microbleed anatomical rating scale (MARS) criteria.25 The method was slightly modified by incorporating minimum intensity projection images. This improves the sensitivity and reduces the number of suspected CMB locations.26 The RST result was then censored visually to select true CMBs. The inter-rater agreement for CMB counts was high (ICC value is 0.88). Because average and median numbers of detected CMBs per person were small, CMBs were dichotomized as present/absent.
Cardiovascular risk factors
Cardiovascular risk factors were assessed by questionnaires, a standardized interview, physical examination and laboratory testing. Risk factors included in our analyses were systolic blood pressure (mean of three measurements), current smoking, type 2 diabetes mellitus, and fasting serum total cholesterol. Participants were considered to have diabetes if they were receiving diabetes medication or if they had fasting blood glucose 7.0 mmol/L or higher. For studies, cholesterol and glucose were measured in the same laboratory at the Utrecht University Medical Center.
Statistical analysis
Linear regression was used to estimate the relation of age, cardiovascular risk factors, and imaging markers of SVD with PVS numbers. If applicable, the analyses were adjusted for age and sex (model 1). To explore the effect of other possible confounders, we additionally adjusted for systolic blood pressure, diabetes, cholesterol, current smoking, and total brain volume as a percentage of intracranial volume, lacunar infarcts, and WMH volume (% ICV) or CMBs (model 2).
To explore the validity of our cohort, we also assessed the relation of age with imaging markers of SVD using univariate linear regression (WMH volume, lacunar infarcts, CMBs, and brain parenchymal fraction).
Results
Participants
Table 1 shows the characteristics of all the participants. The mean age ± SD was 63 ± 8.5 years. The mean number ± SD of PVS was 71 ± 28 in the right CSO, and 17 ± 6 in the right BG. PVS numbers were distributed normally. There were no unexpected findings in the distribution of cardiovascular risk factors and conventional imaging markers of SVD among the different age groups. None of the subjects had a history of stroke, and 5 (10%) subjects had a history of transient ischemic attack (TIA). The mean MMSE ± SD of the whole group was 28.8 ± 1.3. No significant difference MMSE across the age groups was observed (40–50 years: mean ± SD 28.8 ± 1.9; 50–60 years: 29.3 ± 0.7; 60–70 years: 28.8 ± 1.4; and 70–80 years: 28.3 ± 1.2).
Table 1.
Vascular risk factors and imaging markers of SVD per 10 years of age.
| Age | 40–50 | 50–60 | 60–70 | 70–80 | All |
|---|---|---|---|---|---|
| n = 4 | n = 12 | n = 22 | n = 12 | n = 50 | |
| Vascular risk factors | |||||
| Female % | 75 | 67 | 55 | 58 | 60 |
| Systolic blood pressure (mmHg) | 124 ± 10 | 134 ± 16 | 139 ± 18 | 146 ± 14 | 138 ± 17 |
| Diabetes Mellitus % | 0 | 17 | 14 | 17 | 14 |
| Current smoker % | 0 | 8 | 0 | 25 | 8 |
| Total cholesterol | 5.1 ± 1.1 | 5.8 ± 1.1 | 5.6 ± 1.1 | 5.2 ± 1.0 | 5.6 ± 1.1 |
| History of TIA/stroke % | 25/0 | 0/0 | 5/0 | 25/0 | 10/0 |
| Imaging markers | |||||
| PVS CSO | 92 ± 29 | 65 ± 25 | 70 ± 31 | 73 ± 24 | 71 ± 28 |
| PVS BG | 16 ± 7 | 15 ± 6 | 17 ± 7 | 19 ± 5 | 17 ± 6 |
| Lacunar infarcta % | 0 | 0 | 9 | 42 | 14 |
| WMH volume (ml) | 1.0 ± 1.9 | 0.3 ± 0.3 | 1.9 ± 2.1 | 5.5 ± 9.1 | 2,4 ± 5.0 |
| CMBa % | 0 | 33 | 23 | 50 | 30 |
| TBV % ICV | 77 ± 4 | 80 ± 3 | 77 ± 4 | 73 ± 4 | 77 ± 4 |
CSO, Semioval centre; BG, basal ganglia; WMH, white matter hyperintensity; CMB, cerebral microbleeds; TBV, total brain volume; ICV, intracranial volume. Numbers displayed are mean values ± SD, unless otherwise specified. a% of subjects with ≥1 lacunar infarct(s) or cerebral microbleed(s)
Relation of age and cardiovascular risk factors with PVS
Using linear regression analysis, age and cardiovascular risk factors were not significantly associated with the number of PVS in the BG or in the CSO in model 1 (Table 2), although in the BG, higher age tended to be associated with slightly higher PVS counts.
Table 2.
Linear regression analysis of age and cardiovascular risk factors with PVS (model 1).
| B | Standardized beta (95% CI) | p | |
|---|---|---|---|
| Age per 5 years increase | |||
| CSO | 0.7 | 0.04 (−0.26; 0.34) | 0.79 |
| BG | 0.8 | 0.23 (−0.06; 0.52) | 0.11 |
| Systolic blood pressure per 10 mmHG increase | |||
| CSO | 1.9 | 0.12 (−0.21; 0.45) | 0.48 |
| BG | 0.7 | 0.21 (−0.11; 0.53) | 0.19 |
| Diabetes | |||
| CSO | 5.6 | 0.07 (−0.23; 0.37) | 0.64 |
| BG | 0.5 | 0.03 (−0.26; 0.32) | 0.85 |
| Current smoking | |||
| CSO | 7.1 | 0.07 (−0.23; 0.37) | 0.65 |
| BG | 1.0 | 0.04 (−0.25; 0.34) | 0.77 |
| Total serum cholesterol (mmol/l) | |||
| CSO | 1.1 | 0.05 (−0.26; 0.35) | 0.77 |
| BG | 0.9 | 0.17 (−0.12; 0.45) | 0.26 |
Age was adjusted for sex only, all other results were adjusted for age and sex.
Relation of age and cardiovascular risk factors with conventional SVD imaging markers
Conventional SVD markers and brain parenchymal fraction in our cohort were related to age as expected. WMH volume increased (standardized beta 0.58, p < 0.001) and total brain volume decreased (standardized beta−0.50, p = 0.001) with age. The presence of CMBs and lacunar infarcts were also related to age (standardized beta 0.34, p = 0.01 and 0.35, p = 0.02, respectively).
Relation between imaging markers of SVD and PVS
Forty-six subjects had 1.5 or 3T FLAIR images of sufficient quality to manually delineate WMH volume. Increasing WMH volume was related to higher PVS counts in the BG (standardized beta 0.41, p = 0.02), but this relation did not reach statistical significance for PVS in the CSO (standardized beta 0.34, p = 0.07) (Table 3).
Table 3.
Linear regression analysis imaging markers of SVD with PVS (model 1).
| B | Standardized beta (95% CI) | p | |
|---|---|---|---|
| WMH%a | |||
| CSO | 5.6 | 0.34 (−0.03; 0.72) | 0.07 |
| BG | 1.3 | 0.41 (0.08; 1.00) | 0.02 |
| Lacunar infarctb | |||
| CSO | −6.5 | −0.08 (−0.39; 0.23) | 0.61 |
| BG | −1.3 | −0.08 (−0.38; 0.23) | 0.63 |
| CMBsb | |||
| CSO | 23.1 | 0.39 (0.09; 0.69) | 0.01 |
| BG | 3.8 | 0.32 (0.02; 0.61) | 0.04 |
| Brain parenchyma fraction per SD increase | |||
| CSO | 3.3 | 0.08 (−0.32; 0.49) | 0.68 |
| BG | −0.2 | −0.02 (−0.41; 0.38) | 0.92 |
WMH, white matter hyperintensity; CMBs, cerebral microbleeds.
All results were adjusted for age and sex.
WMH% = (WMH volume/intracranial volume) * 100. WMH% was natural log transformed.
Dichotomized as present/absent. Bold values are statisically significant associations.
Forty-six subjects had T2*- weighted 7T images of sufficient quality to rate CMBs. Fifteen subjects had one or more CMBs (median 1, range 1–6). Eleven subjects had strictly lobar CMBs, three subjects had lobar and deep CMBs, and one subject only had one deep CMB (Table 4). Because the number of persons with deep CMBs was very small, we did not stratify CMBs by location in our analysis. The presence of CMBs was significantly related to increased numbers of PVS in the BG (standardized beta 0.32, p = 0.04) and in the CSO (standardized beta 0.39, p = 0.01) (Table 3).
Table 4.
Mean PVS numbers ± SD stratified by CMB location.
| Strictly lobar, N = 11 | Lobar and deep, N = 3 | Strictly deep, N = 1 | Total, N = 15 | No CMB, N = 31 | |
|---|---|---|---|---|---|
| CSO | 83 ± 32 | 79 ± 31 | 147 | 86 ± 34 | 66 ± 22 |
| BG | 19 ± 6 | 18 ± 8 | 29 | 20 ± 7 | 16 ± 5 |
No association between lacunar infarcts or brain volume and PVS counts was found (Table 3). Next, we additionally corrected for systolic blood pressure, current smoking, diabetes mellitus, serum total cholesterol, lacunar infarcts, intracranial volume, and WMH volume (model 2, Table 5). After this, the association between WMH volume and PVS was no longer statistically significant. The presence of CMBs remained significantly associated with higher numbers of PVS in the CSO (standardized beta 0.56, p = 0.01).
Table 5.
Multiple linear regression analysis (model 2).
| B | Standardized B (95% CI) | p | |
|---|---|---|---|
| CMBs | |||
| CSO PVS | 34.0 | 0.56 (0.12; 0.99) | 0.01 |
| BG PVS | 4.2 | 0.34 (−0.10; 0.77) | 0.12 |
| WMH% | |||
| CSO PVS | 5.6 | 0.39 (−0.9; 0.87) | 0.11 |
| BG PVS | 1.3 | 0.46 (−0.25; 0.94) | 0.06 |
WMH, white matter hyperintensity; CMBs, cerebral microbleeds. Adjusted for age, sex, systolic blood pressure, diabetes, cholesterol, current smoking, total brain volume as a percentage of intracranial volume, lacunar infarcts and WMH volume or CMBs. Bold values are statisically significant associations.
Discussion
In this 7T MRI study, PVS counts were related to other markers of SVD, but not to age or vascular risk factors. This latter finding indicates that compared with conventional MRI, the correlation between PVS counts and age or vascular risk factors at 7T may be attenuated by the detection of “normal”, non-pathological PVS, due to the high sensitivity of the technique.
Our PVS counts were markedly higher than in previous studies using conventional MRI. Previous studies on PVS mostly employed regular field strength MRI (1.5 or 3T). These studies used semi-quantitative rating scales for PVS assessment. For example, in the 3C Dijon study,4 PVS were rated according to a 4-level severity score, and only 5.2 % of subjects had the highest grade 4 of > 20 PVS in both hemispheres combined on the slice that contained the greatest number of PVS. In the Rotterdam Scan Study, the average PVS count in the CSO in subjects aged ≥ 45 was 9.8,9 also in both hemispheres, on a slice with a similar orientation as that used in our study. Consequently, all of our study subjects would fall in the highest PVS grade according to the method from the 3C Dijon study. Moreover, our average PVS count is 14 times higher compared with the Rotterdam Scan Study. The high number of PVS that was found may be explained by the high signal-to-noise ratio (SNR) and image contrast at 7T, which allowed the use of a submillimeter voxel size. PVS generally do not exceed a diameter of 2 mm, but many PVS are around 1 mm or even smaller in diameter.5 Therefore, using a high spatial resolution will reduce partial volume effects, and PVS may become detected that are not visible at lower field strengths using regular clinical scanning protocols. Also, a T2-weighted TSE sequence was used, which is sensitive for the detection of fluid-containing PVS at 7T.27
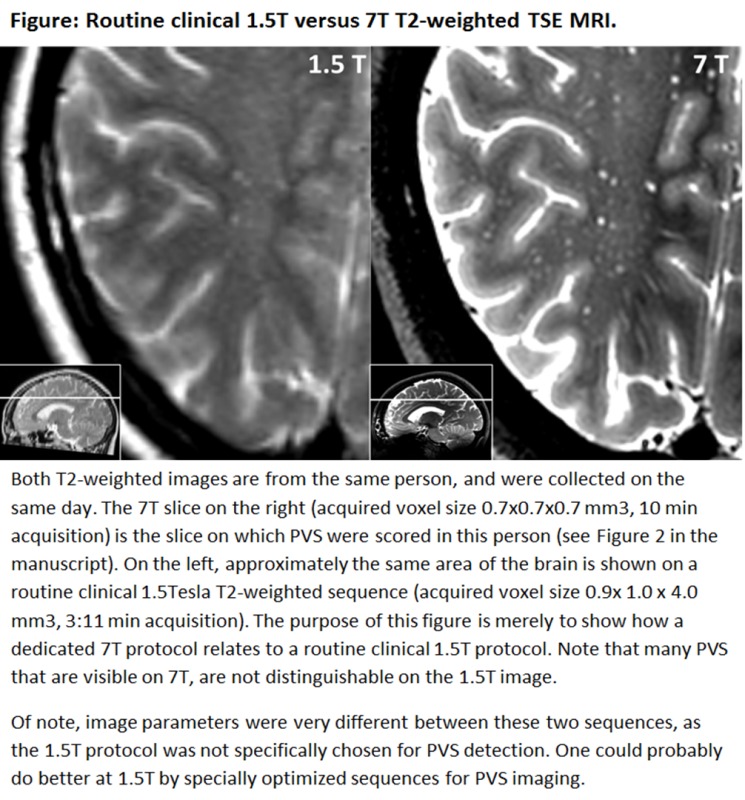
An example figure of how the PVS visibility of a routine clinical 1.5T T2-weighted TSE sequence relates to the 7T T2-weighted TSE sequence that was used in the current study is provided as Supplementary material. Acquiring images with a similar SNR and resolution at lower field strengths will require more signal averaging compared with 7T, and, therefore, lead to a marked increase in scanning time. Although we did not perform a direct comparison with a similar scanning protocol at 1.5 or 3T, it seems unlikely that T2-weighted TSE images with a similar SNR and resolution could be achieved within a reasonable scanning time at these field strengths. Even if other sequences or imaging approaches at lower field strengths were to be developed that could yield detailed depiction of PVS similar to our current 7T images in a reasonable scan time, one would expect that such a development would also allow improving the detectability of PVS at 7T, thereby maintaining the relative benefit of 7T MRI over the lower field strengths.
At present, it is unknown if there is a relation between the size of PVS and the severity of SVD. We deliberately decided to include PVS of all size in our analysis. We did not measure PVS size in the present study, because we have previously established that with the applied protocol at 7T reliable measurement of PVS diameters below approximately twice the image resolution (1.4 mm in our case) is not possible due to marked influence of partial volume effects on the diameter measurement.5 Although promising results have been recently published on the semi-automated measurement PVS diameters and volume at 7T,27 more work is needed to further improve these methods and unravel the clinical consequences of PVS diameter and volume.
PVS counts were not (CSO PVS) or weakly (BG PVS) related to age and blood pressure. This is contrary to results from previous studies11–16,28,29 performed with regular field strength MRI, which have often shown associations of PVS with age or cardiovascular risk factors. Probably, the relatively large PVS on routine clinical MRI have different associations with age and cardiovascular risk factors than the small PVS on 7T. Thus besides observations that PVS are a feature of SVD, PVS are physiological structures, which are abundantly present throughout the healthy brain microscopically.30 In this aspect, PVS differ from most other SVD imaging markers, as they are not a pathological finding per se. Probably, more physiological PVS are detected at 7T, attenuating their association with age and cardiovascular risk factors. Of note, by increasing the age contrast between groups, age effects may still be observed also on 7T MRI, as we have previously found that PVS counts in healthy volunteers were higher in those aged 51–72 compared with those aged 19–27.5
Higher PVS counts were significantly related to the presence of CMBs and increasing WMH volume, which are well-established imaging markers of SVD. This means that with a high PVS detection sensitivity at 7T, “pathological” PVS are also easily detected. These findings confirm the significance of PVS as a marker of SVD. The mechanisms that lead to increased number of PVS in SVD are not well known, and in previous studies, associations with clinical determinants and imaging features of SVD also differed between BG and CSO PVS. This may reflect a different susceptibility with vascular risk factors, disease mechanisms and phenotypes, which might be due to anatomical and physiological differences between PVS in the BG and CSO, both microscopically and on in vivo MRI.5
Several mechanisms have been proposed to be involved in the development of enlarged PVS: they have been associated with blood–brain barrier dysfunction,31 and were found to be related to serological markers of inflammation11,32,33 and inflammatory activity in patients with multiple sclerosis.3,34 Recently, PVS in the CSO have also been identified as a feature of cerebral amyloid angiopathy (CAA) in patients with intracerebral hemorrhage and in a cohort of patients from a memory clinic, and CMBs are a well-established imaging marker of CAA.13,15,35 It has been proposed that perivascular deposition of β-amyloid may lead retrograde dilation of PVS due to blockage of interstitial fluid drainage.13,35 Our results provide further evidence for this hypothesis, as CMBs were strongly related to PVS in the CSO, and this association remained statistically significant after correction for age, cardiovascular risk factors, and other imaging markers of SVD. Of note, lobar CMBs may also be a marker of CAA in individuals from the general population, because CAA is a common pathology in ageing individuals, albeit with relatively less severity compared with patients with for example CAA-related hemorrhagic stroke.36 Possibly, also in our relatively healthy senior persons both CMBs and increased visibility of PVS in the CSO are the consequence of vessel wall dysfunction due to β-amyloid accumulation that leads to hemosiderin leakage and extravasation of fluid into the perivascular space.
The strengths of this study are the use of a high-resolution 7T MRI protocol for the detection of PVS and CMBs, and the careful identification of individual PVS using 3D high-resolution structural information. To optimize the reliability of the PVS counts, all scans were analyzed by two raters. Rating PVS on these high-resolution images was not only reproducible, but also time consuming. We, therefore, decided to count PVS in one hemisphere only, an approach that has also been used previously.10,14 Based on anatomical and physiological grounds, unilateral ratings should be representative for both hemispheres. Nevertheless, the unilateral rating could be considered a limitation of this study.
Our cohort had a substantial age range. The observation that conventional imaging markers of SVD were related to age, as expected, supports the internal and the external validity of our findings in this cohort. The persons included in this study were cognitively normal, community-dwelling persons. Although there were no differences in subject characteristics between participants and non-participants in PREDICT-MR, a selection bias in this study cohort cannot be fully excluded. Conventional imaging markers of SVD were assessed with conventional methods on 1.5 or 3T MRI, and volumetric methods were used to quantify WMH and brain volumes. The average number of PVS in the youngest age group was also high. However, with regard to the vascular risk factor profile or markers of small vessel disease on MRI, this youngest group differed from the older groups as would be expected. Nevertheless, the youngest age group was small (n = 4) and age effects on PVS counts should be studied further in larger populations with a wider age range. The modest sample size and the relative large proportion of persons that were excluded due to movement artefacts are limitations of the study.
In conclusion, we found high PVS counts on 7T MRI compared with studies that used MRI at lower field strength. This increased PVS detection sensitivity of 7T MRI is due to the high SNR and image contrast, which allowed the use of a spatial resolution within the submillimeter range. PVS counts on 7T MRI were associated with CMBs and WMH, but not with age or cardiovascular risk factors. This shows that at 7T, compared with conventional MRI, the increased PVS detection sensitivity may change their associations with clinical and imaging markers of SVD. For future studies on PVS and cerebral SVD, high-resolution 7T MRI may offer a level of detail to assess PVS that was not possible before. For example, it would be possible at 7T to assess the spatial relation between lesions and PVS in detail, to evaluate PVS regionally (e.g., by assessing juxtacortical instead of global PVS), to assess PVS shape, or use contrast agents to evaluate vascular leakage or blood-brain barrier function. However, the challenge for future 7T PVS studies will be to distinguish physiology from pathology. Therefore, the added value of 7T in PVS studies will depend very much on the research question and population in which it is applied.
Supplementary Material
Acknowledgement
The authors greatly acknowledge the use of MeVisLab by MeVis Medical Solutions AG, Bremen, Germany. The authors are grateful to all participants for their time and effort and to the University Medical Center Utrecht Primary Care Network for participating. The authors would like to gratefully acknowledge the following members of the Utrecht Vascular Cognitive Impairment (VCI) Study Group for their contribution to this study (in alphabetical order): E van den Berg, JHJ de Bresser, M Brundel, SM Heringa, and YD Reijmer. We would like to gratefully thank EH van der Veen, M Kooistra and all other people involved in the data acquisition of the PREDICT-MR study. We would like to thank Hugo J Kuijf for assisting with the image processing.
Funding
The author(s) disclosed receipt of the following financial support for the research, authorship, and/or publication of this article: This work was supported by Grant 2010T073 from the Dutch Heart Association and Vidi Grant 91711384 from ZonMw, The Netherlands Organization for Health Research and Development. The research of JJMZ is supported by funding from the European Research Council under the European Union's Seventh Framework Program (FP7/2007-2013)/ERC Grant agreement no. 337333.
Declaration of conflicting interests
The author(s) declared the following potential conflicts of interest with respect to the research, authorship, and/or publication of this article: This work was supported by Grant 2010T073 from the Dutch Heart Association and Vidi grant 91711384 from ZonMw, The Netherlands Organization for Health Research and Development. The research of JJMZ is supported by funding from the European Research Council under the European Union's Seventh Framework Program (FP7/2007-2013) / ERC grant agreement n°337333.
Authors’ contributions
Willem H Bouvy was involved in the concept and design of the study, analysis and interpretation of the data, and drafting and revising of the manuscript. Jaco JM Zwanenburg was involved in obtaining funding, in the acquisition of the data, and revising of the manuscript. Hendrik Reinink was involved in the acquisition and analysis of the data and revising of the manuscript. Laura E Wisse was involved in the acquisition of the data and revising of the manuscript. Peter R Luijten was involved in study supervision and in revising of the manuscript. L Jaap Kappelle was involved in study supervision and in revising of the manuscript. Mirjam Geerlings was involved in study supervision and obtaining funding, in the concept and design of the study, interpretation of the data, and drafting and revising of the manuscript. Geert Jan Biessels was involved in study supervision and obtaining funding, in the concept and design of the study, interpretation of the data, and drafting and revising of the manuscript.
Supplementary material
Supplementary material for this paper is available at: http://jcbfm.sagepub.com/content/by/supplemental-data.
References
- 1.Wang P, Olbricht WL. Fluid mechanics in the perivascular space. J Theor Biol 2011; 274: 52–57. [DOI] [PubMed] [Google Scholar]
- 2.Schley D, Carare-Nnadi R, Please CP, et al. Mechanisms to explain the reverse perivascular transport of solutes out of the brain. J Theor Biol 2006; 238: 962–974. [DOI] [PubMed] [Google Scholar]
- 3.Wuerfel J, Haertle M, Waiczies H, et al. Perivascular spaces—MRI marker of inflammatory activity in the brain? Brain 2008; 131: 2332–2340. [DOI] [PubMed] [Google Scholar]
- 4.Zhu YC, Dufouil C, Mazoyer B, et al. Frequency and location of dilated Virchow–Robin spaces in elderly people: a population-based 3D MR imaging study. Am J Neuroradiol 2011; 32: 709–713. [DOI] [PMC free article] [PubMed] [Google Scholar]
- 5.Bouvy WH, Biessels GJ, Kuijf HJ, et al. Visualization of perivascular spaces and perforating arteries with 7 T magnetic resonance imaging. Invest Radiol 2014; 49: 307–313. [DOI] [PubMed] [Google Scholar]
- 6.Kwee RM, Kwee TC. Virchow-Robin spaces at MR imaging1. Radiographics 2007; 27: 1071–1086. [DOI] [PubMed] [Google Scholar]
- 7.Wardlaw JM, Smith EE, Biessels GJ, et al. Neuroimaging standards for research into small vessel disease and its contribution to ageing and neurodegeneration. Lancet Neurol 2013; 12: 822–838. [DOI] [PMC free article] [PubMed] [Google Scholar]
- 8.Moran C, Phan TG, Srikanth VK. Cerebral small vessel disease: a review of clinical, radiological, and histopathological phenotypes. Int J Stroke 2012; 7: 36–46. [DOI] [PubMed] [Google Scholar]
- 9.Adams HHH, Cavalieri M, Verhaaren BFJ, et al. Rating method for dilated virchow-robin spaces on magnetic resonance imaging. Stroke 2013; 44: 1732–1735. [DOI] [PubMed] [Google Scholar]
- 10.Doubal FN, MacLullich AMJ, Ferguson KJ, et al. Enlarged perivascular spaces on MRI are a feature of cerebral small vessel disease. Stroke 2010; 41: 450–454. [DOI] [PubMed] [Google Scholar]
- 11.Aribisala BS, Wiseman S, Morris Z, et al. Circulating inflammatory markers are associated with magnetic resonance imaging-visible perivascular spaces but not directly with white matter hyperintensities. Stroke 2014; 45: 605–607. [DOI] [PMC free article] [PubMed] [Google Scholar]
- 12.Gutierrez J, Rundek T, Ekind MS V, et al. Perivascular spaces are associated with atherosclerosis: an insight from the Northern Manhattan Study. AJNR Am J Neuroradiol 2013; 34: 1711–1716. [DOI] [PMC free article] [PubMed] [Google Scholar]
- 13.Martinez-Ramirez S, Pontes-Neto OM, Dumas AP, et al. Topography of dilated perivascular spaces in subjects from a memory clinic cohort. Neurology 2013; 80: 1551–1556. [DOI] [PMC free article] [PubMed] [Google Scholar]
- 14.Potter GM, Doubal FN, Jackson CA, et al. Enlarged perivascular spaces and cerebral small vessel disease. Int J Stroke 2015; 10: 376–381. [DOI] [PMC free article] [PubMed] [Google Scholar]
- 15.Charidimou A, Meegahage R, Fox Z, et al. Enlarged perivascular spaces as a marker of underlying arteriopathy in intracerebral haemorrhage: a multicentre MRI cohort study. J Neurol Neurosurg Psychiatry 2013; 84: 624–629. [DOI] [PMC free article] [PubMed] [Google Scholar]
- 16.Hurford R, Charidimou A, Fox Z, et al. MRI-visible perivascular spaces: relationship to cognition and small vessel disease MRI markers in ischaemic stroke and TIA. J Neurol Neurosurg Psychiatry 2014; 85: 522–525. [DOI] [PMC free article] [PubMed] [Google Scholar]
- 17.Deramecourt V, Slade JY, Oakley AE, et al. Staging and natural history of cerebrovascular pathology in dementia. Neurology 2012; 78: 1043–1050. [DOI] [PMC free article] [PubMed] [Google Scholar]
- 18.Reijmer YD, Brundel M, de Bresser J, et al. Microstructural white matter abnormalities and cognitive functioning in type 2 diabetes: a diffusion tensor imaging study. Diabetes Care 2013; 36: 137–144. [DOI] [PMC free article] [PubMed] [Google Scholar]
- 19.Wisse LEM, Gerritsen L, Zwanenburg JJM, et al. Subfields of the hippocampal formation at 7 T MRI: In vivo volumetric assessment. Neuroimage 2012; 61: 1043–1049. [DOI] [PubMed] [Google Scholar]
- 20.Wisse LEM, Biessels GJ, Stegenga BT, et al. Major depressive episodes over the course of 7 years and hippocampal subfield volumes at 7 tesla MRI: the PREDICT-MR study. J Affect Disord 2015; 175: 1–7. [DOI] [PubMed] [Google Scholar]
- 21.Nationaal Kompas. 13 Natl Compass Public Heal 2011 Diabetes Mellit Incid Preval Mortal Accord to age sex Available from Nationaalkompas.nl Accessed 2013.
- 22.Ware JE, Kosinski M, Bayliss MS, et al. Comparison of methods for the scoring and statistical analysis of SF-36 health profile and summary measures: summary of results from the Medical Outcomes Study. Med Care 1995; 33: AS264–AS279. [PubMed] [Google Scholar]
- 23.Ritter F, Boskamp T, Homeyer A, et al. Medical image analysis. IEEE Pulse 2011; 2: 60–70. [DOI] [PubMed] [Google Scholar]
- 24.Kuijf HJ, de Bresser J, Geerlings MI, et al. Efficient detection of cerebral microbleeds on 7.0 T MR images using the radial symmetry transform. Neuroimage 2012; 59: 2266–2273. [DOI] [PubMed] [Google Scholar]
- 25.Gregoire SM, Chaudhary UJ, Brown MM, et al. The Microbleed Anatomical Rating Scale (MARS): reliability of a tool to map brain microbleeds. Neurology 2009; 73: 1759–1766. [DOI] [PubMed] [Google Scholar]
- 26.Kuijf HJ, Brundel M, de Bresser J, et al. Semi-automated detection of cerebral microbleeds on 3.0 T MR images. PLoS One 2013; 8: e66610. [DOI] [PMC free article] [PubMed] [Google Scholar]
- 27.Zong X, Park SH, Shen D, et al. Visualization of perivascular spaces in the human brain at 7T: sequence optimization and morphology characterization. Neuroimage 2016; 125: 895–902. [DOI] [PubMed] [Google Scholar]
- 28.Klarenbeek P, van Oostenbrugge RJ, Rouhl RPW, et al. Ambulatory blood pressure in patients with lacunar stroke: association with total MRI burden of cerebral small vessel disease. Stroke 2013; 44: 2995–2999. [DOI] [PubMed] [Google Scholar]
- 29.Rouhl R, van Oostenbrugge R, Knottnerus I, et al. Virchow–Robin spaces relate to cerebral small vessel disease severity. J Neurol 2008; 255: 692–696. [DOI] [PubMed] [Google Scholar]
- 30.Marín-Padilla M, Knopman DS. Developmental aspects of the intracerebral microvasculature and perivascular spaces: Insights into brain response to late-life diseases. J Neuropathol Exp Neurol 2011; 70: 1060–1069. [DOI] [PMC free article] [PubMed] [Google Scholar]
- 31.Wardlaw JM. Blood-brain barrier and cerebral small vessel disease. J Neurol Sci 2010; 299: 66–71. [DOI] [PubMed] [Google Scholar]
- 32.Rouhl RPW, Damoiseaux JGMC, Lodder J, et al. Vascular inflammation in cerebral small vessel disease. Neurobiol Aging 2012; 33: 1800–1806. [DOI] [PubMed] [Google Scholar]
- 33.Satizabal CL, Zhu YC, Dufouil C, et al. Inflammatory proteins and the severity of dilated Virchow–Robin spaces in the elderly. J Alzheimer’s Dis 2013; 33: 323–328. [DOI] [PubMed] [Google Scholar]
- 34.Kilsdonk ID, Steenwijk MD, Pouwels PJW, et al. Perivascular spaces in MS patients at 7 Tesla MRI: A marker of neurodegeneration? Mult Scler J 2015; 21: 155–162. [DOI] [PubMed] [Google Scholar]
- 35.Charidimou A, Jaunmuktane Z, Baron J, et al. White matter perivascular spaces: an MRI marker in pathology-proven cerebral amyloid angiopathy? Neurology 2014; 82: 57–62. [DOI] [PMC free article] [PubMed] [Google Scholar]
- 36.Greenberg SM, Al-Shahi Salman R, Biessels GJ, et al. Outcome markers for clinical trials in cerebral amyloid angiopathy. Lancet Neurol 2014; 13: 419–428. [DOI] [PMC free article] [PubMed] [Google Scholar]
Associated Data
This section collects any data citations, data availability statements, or supplementary materials included in this article.
Supplementary Materials