

Abstract
Although the mitogen-activated protein kinase (MAPK) phosphatase, DUSP1, mediates dexamethasone-induced repression of MAPKs, 14 of 46 interleukin-1β (IL1B)-induced mRNAs were significantly enhanced by DUSP1 overexpression in pulmonary A549 cells. These include the interferon regulatory factor, IRF1, and the chemokine, CXCL10. Of these, DUSP1-enhanced mRNAs, 10 including CXCL10, were IRF1-dependent. MAPK inhibitors and DUSP1 overexpression prolonged IRF1 expression by elevating transcription and increasing IRF1 mRNA and protein stability. Conversely, DUSP1 silencing increased IL1B-induced MAPK phosphorylation while significantly reducing IRF1 protein expression at 4 h. This confirms a regulatory network whereby DUSP1 switches off MAPKs to maintain IRF1 expression. There was no repression of IRF1 expression by dexamethasone in primary human bronchial epithelial cells, and in A549 cells IL1B-induced IRF1 protein was only modestly and transiently repressed. Although dexamethasone did not repress IL1B-induced IRF1 protein expression at 4–6 h, silencing of IL1B plus dexamethasone-induced DUSP1 significantly reduced IRF1 expression. IL1B-induced expression of CXCL10 was largely insensitive to dexamethasone, whereas other DUSP1-enhanced, IRF1-dependent mRNAs showed various degrees of repression. With IL1B plus dexamethasone, CXCL10 expression was also IRF1-dependent, and expression was reduced by DUSP1 silencing. Thus, IL1B plus dexamethasone-induced DUSP1 maintains expression of IRF1 and the IRF1-dependent gene, CXCL10. This is supported by chromatin immunoprecipitation showing IRF1 recruitment to be essentially unaffected by dexamethasone at the CXCL10 promoter or at the promoters of more highly repressed IRF1-dependent genes. Since IRF1-dependent genes, such as CXCL10, are central to host defense, these data may help explain the reduced effectiveness of glucocorticoids during asthma exacerbations.
Keywords: glucocorticoid, inflammation, innate immunity, interferon regulatory factor (IRF), mitogen-activated protein kinase (MAPK), CXCL10, DUSP1, glucocorticoid resistance, IRF1, MKP-1
Introduction
Inhaled glucocorticoids are referred to clinically as inhaled corticosteroids and bind to the glucocorticoid receptor (GR2; NR3C1). These drugs suppress inflammatory gene expression and are a mainstay in the treatment of asthma (1). However, poor responsiveness to inhaled corticosteroid therapy by asthmatics with neutrophilic inflammation or viral infections and by individuals with chronic obstructive pulmonary disease (COPD) necessitates high, often oral, doses of glucocorticoid (1–3). This, if maintained over prolonged periods, may lead to contraindications, including osteoporosis, muscle wasting, increased blood glucose, weight gain, and suppression of the hypothalamic-pituitary-adrenal axis (4). Thus, an unmet clinical need exists to improve the therapeutic ratio of glucocorticoids in such disease situations.
Airway epithelial cells release proinflammatory cytokines, chemokines, adhesion molecules, and inflammatory enzymes and play critical roles in asthma (5). Acting on the airway epithelium, glucocorticoids suppress the production of numerous epithelial-derived mediators, and this helps to reduce inflammatory cell recruitment (1). However, epithelial cells also produce antimicrobial, complement, and other mediators that play pivotal roles in innate immune and host defense responses (6, 7). Furthermore, many of these factors are spared the repressive effects of glucocorticoids, and this may contribute toward the maintenance of innate immune responses (7). In addition, by enhancing the expression of scavenger and toll-like receptors (TLRs), collectins, complement factors, and other antimicrobial and antiviral proteins, glucocorticoids may induce protective innate and host defense responses (8, 9).
Increased expression of the dual-specificity mitogen-activated protein kinase (MAPK) phosphatase, DUSP1, and the consequent reduction of MAPK activity by glucocorticoids is often regarded as a key anti-inflammatory effector mechanism leading to reduced inflammatory gene expression (10, 11). However, interferon regulatory factor 1 (IRF1) is a transcription factor that plays a key role in the up-regulation of host defense and anti-viral response genes, and loss of MAPK activity and/or increased DUSP1 expression is associated with enhanced expression of IRF1 and IRF1-dependent genes, such as IL12 (12–17). Thus, a loss of MAPK activity could contribute to the maintenance of IRF1 expression in the presence of glucocorticoids. This may play a role in glucocorticoid insensitivity, and indeed enhanced expression of IRF1 is implicated in reduced responsiveness to glucocorticoids (18, 19).
In a prior analysis, expression of many mRNAs, including IRF1, were induced by 1 h of IL1B treatment, whereas other genes, for example the complement factor, CFB, were induced after a delay of 1–2 h (20). While investigating DUSP1 as a glucocorticoid effector, DUSP1 was overexpressed, and this profoundly repressed the expression of many inflammatory genes, including IL8 and CSF2 (GM-CSF) (21–23). However, we now show that many IL1B-induced genes, including CFB, CXCL10 (proinflammatory chemokine), IFIT1 (tetratricopeptide repeat containing-antiviral gene), MX1 (guanosine triphosphate-metabolizing antiviral protein, UBD (ubiquitin D), were, along with IRF1, substantially enhanced by DUSP1 overexpression. Since, complementary effects occur in DUSP1 knock-out mice after lipopolysaccharide (LPS) challenge, a general feature of gene regulation is suggested (24–26). As the majority of these, IL1B-induced, DUSP1-enhanced genes are late-phase genes, we hypothesize that the ability of DUSP1 to enhance IRF1 expression is responsible for the increased expression of late-phase genes, such as CFB or CXCL10. Furthermore, because glucocorticoids induce DUSP1 expression, this mechanism could contribute to glucocorticoid insensitivity. These concepts are explored using pulmonary A549 cells as a model of primary human bronchial epithelial cells, in which DUSP1 is induced by glucocorticoids and inflammatory gene expression is induced by IL1B and repressed by glucocorticoids (22, 23, 27).
Results
Effect of DUSP1 Overexpression on Inflammatory Gene Expression
To test the effect of DUSP1 overexpression, 46 transcripts were selected as IL1B-inducible in a prior microarray analysis performed in A549 cells (20). These were supplemented with CXCL10 and TLR2, which were selected based on a negative role for MAPK pathways in their regulation (13, 28). Pulmonary epithelial, A549, cells were treated with IL1B for 6 h in the presence of Ad-DUSP1 or control virus. Although control virus had little or no effect on IL1B-induced inflammatory mRNA expression, many inflammatory mRNAs, including CCL4, CCL20, CSF2, CXCL1, CXCL3, CXCL5, IL8, PTGS2, and others, showed significant repression. This is consistent with prior observations (23, 29). BIRC3, CCL2, CCL5, IFNGR1, IL6, LAMB3, MAP3K8, NFKB2, NFKBIZ, and TNFAIP3 mRNAs were induced by IL1B, but not significantly affected by DUSP1 overexpression (Fig. 1A; supplemental Table 1A). However, a number of mRNAs, including APOL6, CFB, CMPK2, CXCL10, HELZ2, ICAM1, IFIT1, IFIT3 isoforms 1 and 2, IRF1, MX1, STAT5A, TLR2, and UBD revealed significantly enhanced IL1B-induced expression in the presence of DUSP1 overexpression (Fig. 1A; supplemental Table 1A). EFNA1, GOS2, and TNF mRNAs were also enhanced by 1.34 ± 1.4, 1.47 ± 0.8, and 2.22 ± 1.7-fold, respectively, by DUSP1 overexpression, but this failed to reach significance (Fig. 1A; supplemental Table 1A). All analyses compare Ad5-DUSP1 to IL1B treatment, and in no case was there any significant effect of the null virus (Ad-null). Supernatants harvested at 18 h showed DUSP1 overexpression to significantly enhance IL1B-induced release of CXCL10 protein (Fig. 1B). The control, Ad-GFP virus, was without effect.
FIGURE 1.

Effect of DUSP1 overexpression and IRF1-targeting siRNA on IL1B-induced inflammatory gene expression. A, A549 cells were either not infected or infected with Ad5-DUSP1 or Ad5-Null (control) at a m.o.i. of 10 for 24 h before IL1B treatment (1 ng/ml) or no stimulation (NS). Cells were harvested after 6 h for real-time PCR analysis of the indicated genes and GAPDH. Data (n = 4) were normalized to GAPDH and expressed as a percentage of IL1B-stimulated cells and plotted. Significance relative to IL1B-treated samples was tested by ANOVA with a Dunnett's post-test. B, cells were treated as in A, and the supernatants were harvested after 18 h for CXCL10 release measurement. Data (n = 4) expressed in pg/ml are plotted. Significance, relative to time-matched IL-1B- and Ad5-GFP-treated samples, was tested by ANOVA with a Bonferroni post-test. C, A549 cells were either not treated (○) or stimulated with IL1B (1 ng/ml) (●) as indicated. Cells were harvested after 1, 2, 6, or 18 h for real-time PCR analysis of IRF1 and GAPDH. Data (n = 4) were normalized to GAPDH and plotted (upper panel). Cells were also harvested at the times indicated for Western blotting analysis of IRF1 and GAPDH (lower panel). Representative blots are shown. After densitometric analysis, data (n = 4) were normalized to GAPDH and plotted. Significance, using ANOVA with a Dunnett's post-test is indicated. D, cells were treated as in C and harvested after 1, 2, 6, or 18 h for real-time PCR analysis of the indicated genes and GAPDH. Data (n = 4) were normalized to GAPDH and plotted. E, A549 cells were incubated with LMNA (control) or IRF1-targeting siRNAs. After 24 h, cells were treated with IL1B (1 ng/ml) as indicated. Cells were harvested after 2 h for Western blotting analysis of IRF1 and GAPDH. Blots representative of at least four such experiments are shown. F, A549 cells were treated as in E and harvested after 6 h for real-time PCR analysis of the indicated genes and GAPDH. Data (n = 4) were normalized to GAPDH and expressed as a percentage of IL1B+LMNA siRNA-stimulated cells and plotted. For each IRF1-targeting siRNA, significance relative to IL1B+LMNA siRNA-treated samples was tested by ANOVA with a Dunnett's post-test. *, p < 0.05; **, p < 0.01; ***, p < 0.001.
Kinetics of IL1B-induced Inflammatory mRNAs
After IL1B treatment, IRF1 mRNA was highly induced at 1 h and reached a peak 2 h post-stimulation, before declining toward basal levels (Fig. 1C, upper panel). This kinetic correlated closely with IRF1 protein expression, which also peaked at 2 h and had declined 6 h post-IL1B (Fig. 1C, lower panels). Expression of ICAM1 and STAT5A mRNAs were modestly induced at 1 h, with a peak in expression at 2–6 h before reducing at later times (Fig. 1D, upper panel). This contrasts with effects on APOL6 and the remaining genes, which were lowly induced by IL1B at 1 and 2 h, but showed highest expression at 6 h or, in the case of CFB, at 18 h (Fig. 1D, lower panel). Thus, with the exception of IRF1 and both STAT5A and ICAM1, which showed a marginally delayed induction kinetic relative to IRF1, these IL1B-induced, DUSP1-enhanced mRNAs were “late” genes induced by IL1B. This suggests that expression of these genes requires the earlier expression of another factor and is consistent with prior findings that cycloheximide blocked IL1B-induced mRNA expression of many of these genes (20). Given an “early” kinetic for IRF1, a transcription factor, a role in the induction of these downstream late-phase genes was tested.
Identification of IRF1-dependent mRNAs Induced by IL1B
A549 cells were treated with two IRF1-targeting, or control, siRNAs before treating with IL1B. Cells harvested at 2 h for Western blotting analysis of IRF1 showed that although the LMNA siRNA was without effect, both the IRF1-targeting siRNAs substantially reduced IL1B-induced IRF1 protein expression (Fig. 1E). After harvesting at 6 h, qPCR was performed for the IL1B-induced genes that were significantly enhanced by DUSP1 overexpression plus a number of additional genes that previously showed either no effect or repression after DUSP1 overexpression. With the exception of TLR2, all the late-phase genes (Fig. 1D, lower panel) that previously showed significantly DUSP1-enhanced expression were also IRF1-dependent (Fig. 1F; supplemental Table 1B). Conversely, the early response genes, STAT5A and ICAM1, were not IRF1-dependent. Likewise, those genes that were either unaffected or repressed by DUSP1 overexpression were also not IRF1-dependent. However, silencing of IRF1 produced large and significant 52.08 ± 5.6- and 20.65 ± 8.2-fold enhancements, respectively, in the IL1B-induced expression of CCL5 and CXCL5. This indicates a possible negative role for IRF1 in controlling the expression of these mRNAs (Fig. 1F) (supplemental Table 1B).
DUSP1 Overexpression Maintains IRF1 Expression
A549 cells were treated with IL1B in the absence and presence of DUSP1-expressing adenovirus. Western blotting confirmed DUSP1 overexpression (Fig. 2A). Although IRF1 protein was only lowly detectible at 1 h and highly induced at 2 and 4 h, no clear effect of DUSP1 overexpression was apparent at these times. However, whereas IRF1 expression was reduced 6 h post-IL1B, the presence of Ad-DUSP1 maintained IRF1 expression. Likewise, at 10 h DUSP1 overexpression also resulted in enhanced IRF1 expression compared with IL1B-induced IRF1 (data not shown). However, because expression was trending toward basal expression, such effects were only apparent after overexposure of autoradiographic films and are consequently not shown. At 18 h, DUSP1 overexpression had no discernible effect on IRF1 expression (data not shown). In all cases there was no effect of control virus (Fig. 2A).
FIGURE 2.
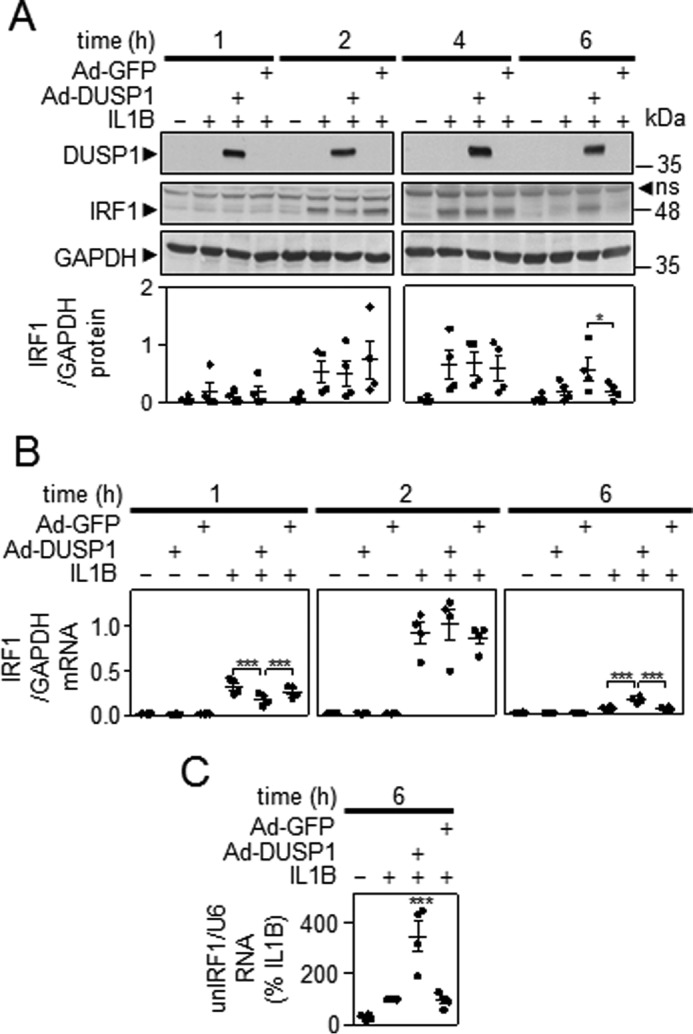
Effect of DUSP1 overexpression on IL1B-induced IRF1 expression. A, A549 cells were either not infected or infected with Ad5-DUSP1 or Ad5-GFP at a m.o.i. of 10 for 24 h before IL1B treatment (1 ng/ml). Cells were harvested after 1, 2, 4, or 6 h for Western blotting analysis of DUSP1, IRF1, and GAPDH. Representative blots are shown. After densitometric analysis, data (n = 4) were normalized to GAPDH and plotted. ns, nonspecific band. B, cells were treated as in A and harvested at 1, 2, or 6 h for real-time PCR analysis of IRF1 and GAPDH. Data (n = 4) were normalized to GAPDH and plotted. For A and B, significance relative to time-matched IL1B and/or Ad5-GFP-treated samples was tested by ANOVA with a Bonferroni multiple comparison test. C, cells were treated as in A and harvested after 6 h for real-time PCR analysis of unspliced nuclear (un) IRF1 (unIRF1) RNA and U6 RNA. Data (n = 4) were normalized to U6 and expressed as a percentage of IL1B-stimulated cells and plotted. Significance, relative to IL1B-treated samples was tested by ANOVA with a Dunnett's post-test.
As described above, IL1B induced IRF1 mRNA at 1 h, and this was further increased at 2 h before declining by 6 h (Fig. 2B). In the presence of Ad-DUSP1, but not control virus, there was a 45.9 ± 8.8% reduction in IRF1 mRNA at 1 h. This effect was lost by 2 h, and at 6 h DUSP1 overexpression significantly enhanced (2.6 ± 0.4-fold) IRF1 expression over that obtained with IL1B alone (Fig. 2B). Analysis of RNA from Fig. 1A showed that the enhancement of IRF1 mRNA at 6 h by DUSP1 was associated with significantly increased levels of unspliced nuclear IRF1 RNA (Fig. 2C). As the presence of unspliced nuclear RNA is a surrogate of transcription rate, this suggests that DUSP1 overexpression enhances IRF1 gene transcription.
MAPK Inhibition Maintains IRF1 Expression
A549 cells were treated with IL1B in the presence or absence of maximally effective concentrations of p38 inhibitor, SB203580 (10 μm), MAPK/extracellular regulated kinase (ERK) kinase (MEK) 1/2 inhibitor, U0126 (10 μm) or JUN N-terminal kinase (JNK) inhibitor, JNK inhibitor 8 (JNK-IN-8) (10 μm), alone and combined to inhibit all three MAPK pathways simultaneously (Fig. 3A). Maximally effective concentrations (10 μm) of MAPK inhibitors was determined previously by analysis of substrate phosphorylation and functional responses in A549 cells (23, 30, 31). As with DUSP1 overexpression, inhibition of each individual MAPK pathway, or all three pathways together, had no effect on IRF1 protein expression induced by IL1B at 2 h. By 4 h post-IL1B treatment, when the IL1B-induced level of IRF1 protein was starting to decline, SB203580, or the three inhibitors combined, resulted in significantly higher levels of IRF1 expression relative to IL1B-treated. At 6 h, IL1B-induced IRF1 expression had further declined, yet this loss was significantly attenuated by SB203580 and the combination inhibitor treatment (Fig. 3A).
FIGURE 3.

Effect of MAPK inhibitors on IRF1 expression. A, A549 cells were either not treated (NT), treated with IL1B (1 ng/ml), or pretreated with either UO126, SB203580, JNK inhibitor 8 (JNK-IN-8), or a combination of UO126 and SB203580 plus JNK-IN-8 each at 10 μm for 30 min before IL1B stimulation. Cells were harvested at the indicated times before Western blotting analysis of IRF1 and GAPDH. Representative blots are shown. After densitometric analysis, data (n = 4) were normalized to GAPDH and plotted. B and C, cells were treated as in A and harvested at 1, 2, 4, or 6 h for real-time PCR analysis of IRF1 and GAPDH (B) or unspliced nuclear IRF1 RNA and U6 (C). Data (n = 4) were normalized to GAPDH or U6 and are plotted. The effect of IL1B + MAPK inhibitors for IRF1 mRNA or unspliced (UN-) nuclear IRF1 RNA is plotted as a percentage of IL1B at the indicated times. For A, B, and C, significance relative to time-matched non-treated or IL1B-treated samples was tested using ANOVA with a Bonferroni multiple comparison test. *, p < 0.05; **, p < 0.01; ***, p < 0.001.
A549 cells were treated with IL1B for various times in the absence or presence of the inhibitors before analysis of mRNA expression. IRF1 mRNA was rapidly induced by IL1B and reached a peak in expression at 2 h before declining at 4 and 6 h (Fig. 3B, left panel). Compared with this, the MAPK pathway inhibitors alone or in combination had no significant effect on IL1B-induced IRF1 mRNA at 1 or 2 h, although the triple combination produced a modest reduction at 1 h. By 4 h, SB203580 and the combination treatment significantly enhanced IRF1 mRNA expression relative to IL1B-treated, and this effect was more pronounced at 6 h (Fig. 3B, right panel).
Effect of MAPK Inhibitors on IRF1 Transcription
Analysis of unspliced nuclear IRF1 RNA showed that transcription rate peaked at or before 1 h before declining at subsequent times (Fig. 3C, left panel). Relative to this profile, there was no effect of the MAPK pathway inhibitors at 1 and 2 h, when transcription was high. However, at 4 h, SB203580, UO126, or all three inhibitors together significantly enhanced unspliced nuclear IRF1 RNA levels compared with IL1B-treated. Similar, but reduced effects were observed at 6 h (Fig. 3C, right panel). Taken together, these data revealed little effect of MAPK inhibitors on the induction phase of IRF1 mRNA expression. However, the rapid loss of IRF1 mRNA occurring after the peak at 2 h was attenuated by MAPK inhibition due to a failure to reduce IRF1 transcription at later time points.
Effect of MAPK Inhibitors and DUSP1 Overexpression on IRF1 mRNA Stability
Analysis of IRF1 mRNA stability using actinomycin D chase methodology showed that after 30 min of IL1B, IRF1 mRNA did not decline over the 45 min of the actinomycin D chase period (Fig. 4A). Rather, immediately post actinomycin D addition, IRF1 mRNA levels continued to increase. We interpret this as showing that although transcription is prevented by actinomycin D, processing of already formed pre-mRNA still occurs and leads to increased accumulation of mature mRNA (32). This effect was not observed at later times (90, 120, or 180 min post IL1B treatment) (Fig. 4A) and is consistent with the considerably reduced transcription rate at these times (Fig. 3C). Furthermore, whereas there was no loss of IRF1 mRNA over the course of the actinomycin D chase after just 30 min of IL1B, a loss to ∼50% of starting levels (t = 0) was observed for all longer (90, 120, and 180 min) IL1B treatment times (Fig. 4A).
FIGURE 4.

Effect of MAPK inhibitors and DUSP1 overexpression on IRF1 mRNA stability. A, A549 cells were treated with IL1B (1 ng/ml) for 30, 90, 120, and 180 min. Actinomycin D (Act D, 10 μg/ml) was then added (t = 0), and the cells were harvested as indicated. RNA was extracted for real-time PCR analysis of IRF1 and GAPDH. Data (n = 3) were normalized to GAPDH and are plotted as a percentage of t = 0 for each treatment. B, A549 cells were treated with IL1B (1 ng/ml) or pretreated for 30 min with SB203580 at 10 μm before IL1B stimulation for 30, 90, 120, 180, and 240 min. After this (t = 0), actinomycin D (10 μg/ml) was added for 45 min, and cells were harvested at the indicated times. RNA was extracted for real-time PCR analysis of IRF1 and GAPDH. Data (n = 4–7) normalized to GAPDH are plotted as a percentage of t = 0 for each treatment. C, A549 cells were treated with IL1B or IL1B + SB203580 at 10 μm for 30 min (left panel) or 180 min (right panel) before the addition of actinomycin D (t = 0) for the indicated times and analyzed as above. D, A549 cells were either not infected or infected with Ad5-DUSP1 or Ad5-GFP at a m.o.i. of 10 for 24 h before IL1B treatment (1 ng/ml) for 180 min before the addition of actinomycin D (t = 0) for the indicated times and analyzed as above. B, C, and D, significance, relative to time matched IL1B-treated samples was tested using a paired t test. *, p < 0.05; **, p < 0.01.
The effect of the p38 inhibition was examined on IRF1 mRNA stability. Using actinomycin D chase experiments in which just the end point was assayed (i.e. 45 min post-actinomycin D addition), pretreatment with SB203580 produced a repressive effect after the 30-min IL1B treatment (Fig. 4B). However, after 90 min of IL1B treatment there was no effect of SB203580, and at all later times (120, 180 and 240 min) SB203580 modestly enhanced IRF1 mRNA stability (Fig. 4B). To further confirm the effects of SB203580, IRF1 mRNA stability was analyzed after 30 and 180 min of IL1B treatment. Pretreatment with SB203580 followed by IL1B for 30 min resulted in no loss of IRF1 mRNA over the course of the actinomycin D chase, and this was also the case in the absence of SB203580 (Fig. 4C, left panel). However, SB203580 did prevent the continued increase in IRF1 mRNA post-actinomycin D treatment. This suggests a possible role for p38 MAPK in the post-transcriptional processing of pre-RNA to mature IRF1 mRNA. In contrast, the stability of IRF1 mRNA after 180 min of IL1B treatment was modestly, but significantly enhanced by SB203580 over the 45 min of the actinomycin D chase (Fig. 4C, right panel). This suggests that p38 MAPK plays an inhibitory role in regulating IRF1 mRNA stability at longer IL1B treatment times.
The effect of DUSP1 overexpression was also examined on IRF1 mRNA stability. Similar to SB203580, IRF1 mRNA stability after 180 min of IL1B treatment was also partially, but significantly, enhanced by DUSP1 overexpression over the course of the actinomycin D chase (Fig. 4D). Control green fluorescent protein (GFP) virus had no effect on IRF1 mRNA stability. Since DUSP1 overexpression inhibits p38 MAPK (23), these data are consistent with the possibility that following longer IL1B treatment times IRF1 mRNA stability is negatively regulated by p38 MAPK.
Effect of MAPK Inhibitors and DUSP1 Overexpression on IRF1 Protein Stability
IRF1 protein is a short-lived protein with a t½ of ∼30 min (33, 34). After 2 h of IL1B, the addition of the proteasome inhibitor, MG132, increased the level of IL1B-induced IRF1 protein (Fig. 5A). To test the effects on IRF1 protein stability, a chase methodology was adopted. The addition of cycloheximide, to prevent further translation after 2 h of IL1B treatment, revealed IRF1 protein to be rapidly degraded (Fig. 5B). Significant loss of IL1B-induced IRF1 occurred by 30 min and a near complete loss was apparent 60 min post-cycloheximide treatment (t½ = ∼30 min) (Fig. 5B). In the presence of cycloheximide, MG132 modestly increased IRF1 protein stability (Fig. 5B). A similar, again modest, stabilizing effect of IRF1 protein was also observed in the presence of the combined MAPK inhibitors (Fig. 5C) and after DUSP1 overexpression (Fig. 5D, right panel). Control GFP virus was without any effect on IRF1 protein stability (Fig. 5D, left panel).
FIGURE 5.

Effect of MG132, MAPK inhibitors, and DUSP1 overexpression on IRF1 protein stability. A, A549 cells were pretreated with IL1B (1 ng/ml) for 2 h. After this (t = 0), MG132 (10 μg/ml) was added, and the cells were harvested after 1 h before Western blotting analysis of IRF1 and GAPDH. Representative blots are shown. After densitometric analysis, data (n = 4) were normalized to GAPDH and expressed as a percentage of IL1B-stimulated cells and plotted. Significance, relative to IL1B-treated sample, was tested using a paired t test. B, A549 cells were pretreated with IL1B (1 ng/ml) for 2 h. After this (t = 0), cycloheximide (CHX, 10 μg/ml) and/or MG132 (10 μg/ml) was added, and the cells were harvested at the indicated times before Western blotting analysis of IRF1 and GAPDH. Representative blots are shown. After densitometric analysis, data (n = 4) were normalized to GAPDH and were expressed as a percentage of IL1B and plotted. C, A549 cells were either not treated, treated with IL1B (1 ng/ml), or pretreated with a combination of UO126 and SB203580 plus JNK inhibitor 8 (JNK-IN-8) each at 10 μm for 30 min before IL1B stimulation for 2 h. After this (t = 0), cycloheximide (10 μg/ml) was added, and the cells were harvested at the indicated times before Western blotting analysis of IRF1 and GAPDH. Representative blots are shown. After densitometric analysis, data (n = 4) were normalized to GAPDH and expressed as a percentage of IL1B or IL1B+MAPK inhibitors and plotted. D, A549 cells were either not infected or infected with Ad5-DUSP1 or Ad5-GFP at a m.o.i. of 10 for 24 h before IL1B stimulation for 2 h. After this (t = 0), cycloheximide (10 μg/ml) was added, and the cells were harvested at the indicated times before Western blotting analysis of IRF1 and GAPDH. Representative blots are shown. After densitometric analysis, data (n = 4) were normalized to GAPDH and expressed as a percentage of IL1B or IL1B+Ad5-GFP or IL1B+Ad5-DUSP1 and plotted. For B–D, significance, relative to IL1B+cycloheximide-treated samples, was tested using a paired t test. *, p < 0.05.
Characterization of IRF1 Expression in the Presence of IL1B and Dexamethasone in A549 Cells
As glucocorticoids reduce MAPK activity in A549 cells (21–23), the effect of the synthetic glucocorticoid, dexamethasone, was examined on IRF1 expression. IL1B-induced IRF1 protein was first apparent at 2 h and thereafter declined in expression (Fig. 6, A and B). Co-treatment with dexamethasone produced a 32.5 ± 5.6% loss of IRF1 expression at 2 h, but by 4 h this repressive effect was reversed, and at 6 h there was no effect of dexamethasone on IRF1 protein expression (Fig. 6, A and B).
FIGURE 6.

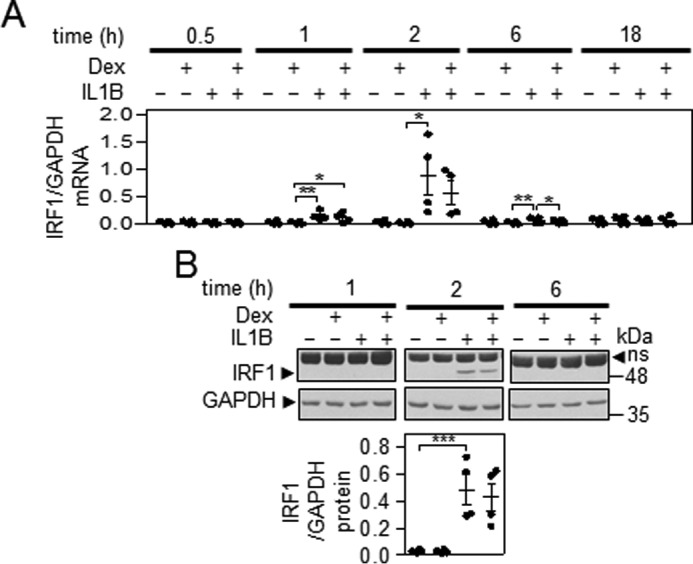
Characterization of IRF1 expression in the presence of IL1B and dexamethasone. A and B, A549 cells were either not treated or stimulated with IL1B (1 ng/ml), dexamethasone (Dex, 1 μm) or a combination of the two as indicated. Cells were harvested at the indicated times before Western blotting analysis of IRF1 and GAPDH. Representative blots are shown. After densitometric analysis, data (n = 4–6) were normalized to GAPDH and expressed as a percentage of 2-h IL1B-stimulated cells and plotted. For A, significance, using ANOVA with a Bonferroni's multiple comparison test is indicated. For B, significance relative to IL1B-treated samples was tested by ANOVA with a Dunnett's post-test. C, A549 cells were treated as in A and harvested at the indicated times for real-time PCR analysis of IRF1 and GAPDH mRNA (upper left panel) or unspliced nuclear (un) IRF1 RNA and U6 RNA (lower left panel). Data (n = 4–8) were normalized to GAPDH and expressed as fold of 1-h not treated (NT; upper left panel) or were normalized to U6 (lower left panel) and plotted. The effect of IL1B + dexamethasone for IRF1 mRNA (upper right panel) (n = 11) and unspliced nuclear (un) IRF1 RNA (lower right panel) (n = 4) is plotted as a percentage of IL1B for indicated times. Significance, relative to time-matched not treated or IL1B-treated samples, was tested using a paired t test. D, A549 cells were treated with IL1B (1 ng/ml) or IL1B plus dexamethasone (1 μm) for 90 min. After this (t = 0), actinomycin D (10 μg/ml) was added, and the cells were harvested at the indicated times for real-time PCR analysis of IRF1 and GAPDH. Data (n = 4) were normalized to GAPDH and plotted as a percentage of t = 0 for each treatment. E, A549 cells were treated with IL1B (1 ng/ml) or IL1B plus dexamethasone (1 μm) for 4 h. After this (t = 0), cycloheximide (CHX, 10 μg/ml) was added, and cells were harvested at the indicated times before Western blotting analysis of IRF1 and GAPDH. Representative blots are shown. After densitometric analysis, data (n = 4) were normalized to GAPDH and expressed as a percentage of IL1B or IL1B+dexamethasone and plotted. Significance, relative to IL1B-treated samples was tested using a paired t test. *, p < 0.05; **, p < 0.01; ***, p < 0.001.
In A549 cells treated with IL1B and/or dexamethasone, IRF1 mRNA was significantly increased by IL1B at 1 h, and this continued to rise, reaching a peak at 2 h before declining at 4 and 6 h (Fig. 6C, upper left). At each time, dexamethasone produced 30–40% repression of IRF1 mRNA (Fig. 6C, upper right).
Effect of Dexamethasone on IRF1 Transcription Rate
In A549 cells, analysis of IRF1 transcription rate using unspliced nuclear RNA showed that at 1 h there was a significant, ∼50%, loss of IL1B-induced IRF1 transcription by dexamethasone (Fig. 6C, lower right). Since IL1B-induced IRF1 mRNA expression is blocked by the dominant inhibitor of NF-κB, IκBαΔN (20), and repression of IRF1 mRNA occurs in the presence of cycloheximide (20), we infer that classical GR transrepression may be responsible for this reduction of IRF1 transcription. Indeed, in bronchial epithelial BEAS-2B cells dexamethasone also modestly reduced TNF-induced IRF1 expression (data not shown), and binding of p65 (RELA) to a site upstream of IRF1 transcription start is reduced by dexamethasone (35).3 We, therefore, tested the effect of the selective IKK2 inhibitor, PS1145, and showed this to reduce IL1B-induced IRF1 mRNA by 71.4 ± 5.3% at 2 h in A549 cells (supplemental Table 2). This confirms a role for NF-κB and supports the concept of GR transrepression. Nevertheless, the ability of dexamethasone to reduce IL1B-induced unspliced IRF1 nuclear RNA was completely lost at 2, 4, and 6 h post-IL1B treatment (Fig. 6C, lower right). Thus, the net effect of dexamethasone on IRF1 mRNA expression is relatively modest.
Effect of Dexamethasone on IRF1 mRNA and Protein Stability
After 90 min of IL1B treatment, IRF1 mRNA revealed a t½ of 50–60 min after actinomycin D addition (Fig. 6D). This was unaffected by dexamethasone co-treatment.
The effect of dexamethasone co-treatment was evaluated on IRF1 protein degradation (Fig. 6E). After cycloheximide addition, IL1B-induced IRF1 was rapidly lost. This effect was modestly, but significantly, attenuated in the presence of dexamethasone.
Characterization of IRF1 Expression in the Presence of IL1B and Dexamethasone in HBE Cells
Similar to A549 cells, in primary HBE cells, modest, but generally not significant, repressive effects of dexamethasone were observed on IL1B-induced IRF1 mRNA (Fig. 7A).
FIGURE 7.
Characterization of IRF1 expression in the presence of IL1B and dexamethasone in HBE cells. A, HBE cells were either not treated or stimulated with IL1B (1 ng/ml), dexamethasone (Dex, 1 μm), or a combination of the two as indicated and harvested at the indicated times for real-time PCR analysis of IRF1 and GAPDH mRNA. Data (n = 4) were normalized to GAPDH and plotted. Significance, using ANOVA with a Bonferroni's multiple comparison test, is indicated. B, HBE cells were treated as in A and harvested at the indicated times for Western blotting analysis of IRF1 and GAPDH. Representative blots are shown. After densitometric analysis, data (n = 4) were normalized to GAPDH and plotted. Significance, using ANOVA with a Dunnett's post-test, is indicated. ns, nonspecific band; *, p < 0.05; **, p < 0.01; ***, p < 0.001
IRF1 protein was not induced at 1 h post-IL1B, whereas at 2 h IRF1 protein was robustly induced and had virtually disappeared by 6 h (Fig. 7B). There was no significant effect of dexamethasone on IRF1 protein expression.
Effect of Dexamethasone on the Expression of IRF1-dependent Genes and Characterization of IRF1 Occupancy in the Presence of IL1B and Dexamethasone
The effect of dexamethasone on the expression of the IRF1-dependent IL1B-induced mRNAs identified in Fig. 1F was analyzed at 6 h. IL1B-induced mRNA expression of the 10 mRNAs was variably affected by dexamethasone co-treatment (Fig. 8A). CMPK2, IFIT1, MX1, IFIT3 isoform 2, and HELZ2 were highly (>88%) repressed, and UBD, APOL6, CFB, and IFIT3 isoform 1 were partially (50–60%) repressed by dexamethasone (Fig. 8A). IL1B-induced CXCL10 mRNA expression was not significantly affected by dexamethasone co-treatment. Analysis of supernatants showed that CXCL10 release was undetectable up to 4 h post-IL1B treatment. Thereafter, CXCL10 release was progressively induced by IL1B and appeared to approach a plateau at ∼18 h (Fig. 8B). IL1B-induced release of CXCL10 was essentially unaffected by dexamethasone co-treatment for up to 8 h. After this, a modest, but non-significant, dexamethasone-dependent repression of CXCL10 release was apparent (Fig. 8B).
FIGURE 8.
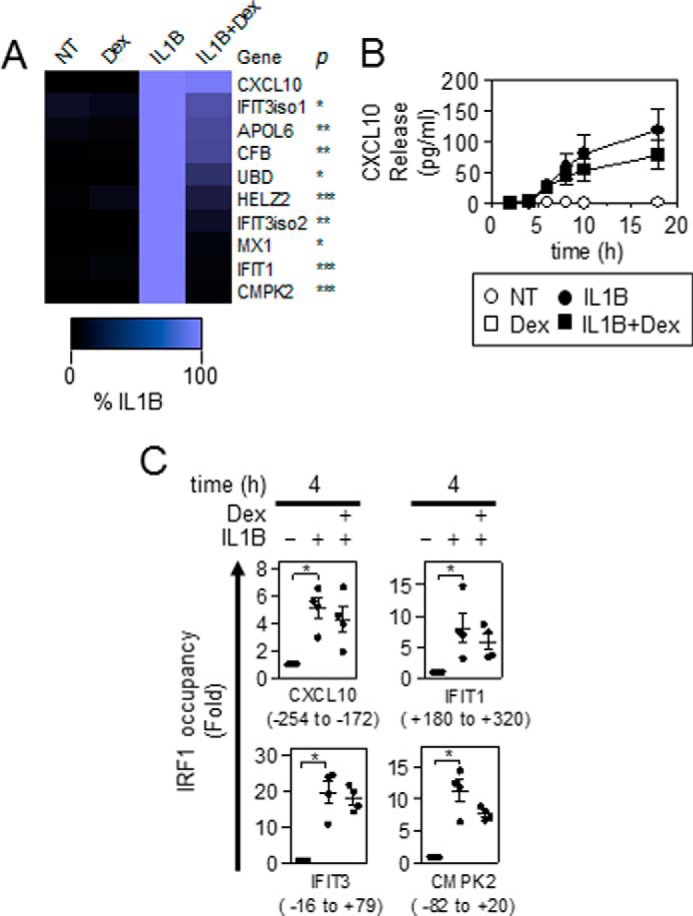
Effect of dexamethasone on the expression of IRF1-dependent genes and characterization of IRF1 occupancy in the presence of IL1B and dexamethasone. A, A549 cells were either not treated (NT) or stimulated with IL1B (1 ng/ml), dexamethasone (Dex, 1 μm), or a combination of the two as indicated. Cells were harvested at 6 h for real-time PCR analysis of indicated genes and GAPDH. Data (n = 4) were normalized to GAPDH and expressed as a percentage of IL1B and plotted. Significance, relative to IL1B-treated samples was tested using a paired t test. B, cells were treated as in A, and the supernatants were harvested at the indicated times for CXCL10 release measurement. Data (n = 4) expressed in pg/ml are plotted. C, A549 cells were either not treated or stimulated with IL1B (1 ng/ml) or IL1B plus dexamethasone (1 μm). Cells were harvested at 4 h for real-time PCR analysis of indicated and control (hMYOD1, hOLIG3, hMYOG) genes. Regions that were interrogated for IRF1 occupancy were identified in relation to the transcription start site of the associated genes and are shown below. IRF1 occupancy was calculated as a difference between CT values for each target locus as compared with the geometric mean of CT values of three control regions that are not occupied by IRF1. Data (n = 4) were normalized to control genes and are expressed as -fold non-treated cells and plotted. Significance, relative to non-treated samples was tested using Friedman test with Dunn's multiple comparison test. *, p < 0.05.
The presence of IRF1 at the promoters of four genes showing differing levels of repression by dexamethasone was evaluated by chromatin immunoprecipitation (ChIP). For this analysis, IRF1 binding regions identified in the UCSC Genome Browser and bioinformatics software, MatInspector, were used to find putative IRF1 binding regions within the CXCL10, IFIT1, IFIT3, and CMPK2 loci.
IRF1 occupancy at the CXCL10 (−254 to −172), IFIT1 (+180 to +320), IFIT3 (−16 to +79), and CMPK2 (−82 to +20) promoters was determined relative to irrelevant genomic control regions after 4 h of IL1B or IL1B plus dexamethasone treatment. Occupancy at each test site was normalized to the averaged control regions (hMYOD1, hOLIG3, hMYOG) and then expressed as -fold untreated (Fig. 8C). Binding of IRF1 to the CXCL10, IFIT1, IFIT3, and CPMK2 promoters was significantly enhanced by IL1B. In the presence of dexamethasone, there were modest, but non-significant, reductions in IRF1 binding (Fig. 8C). This confirms the presence of IL1B-induced IRF1 at these genes both in the absence and presence of dexamethasone.
Role of IRF1 in CXCL10 Expression in the Presence of IL1B and IL1B Plus Dexamethasone
A549 cells were treated with IL1B or IL1B plus dexamethasone in the presence of two independent IRF1-targeting siRNAs. IRF1 expression was induced by IL1B at 2 h, and this was slightly attenuated by the presence of dexamethasone (Fig. 9A). In each case the IRF1-targeting siRNAs profoundly reduced IRF1 expression (Fig. 9A). As shown in Fig. 8A, expression of CXCL10 mRNA was essentially unaffected by dexamethasone treatment at 6 h (Fig. 9A). However, irrespective of the effect of dexamethasone, the IRF1-targeting siRNAs produced a significant reduction in CXCL10 mRNA expression (Fig. 9A). At 18 h, CXCL10 release was significantly induced by IL1B, and this was similar for IL1B plus dexamethasone (Fig. 9A). In each case, the IRF1 targeting siRNAs significantly reduced CXCL10 release, whereas LMNA siRNA had no effect on IL1B or IL1B plus dexamethasone-induced CXCL10 release (Fig. 9B). Thus, IRF1 is necessary for the expression of CXCL10 mRNA and protein, both in the presence of IL1B and with IL1B plus dexamethasone.
FIGURE 9.
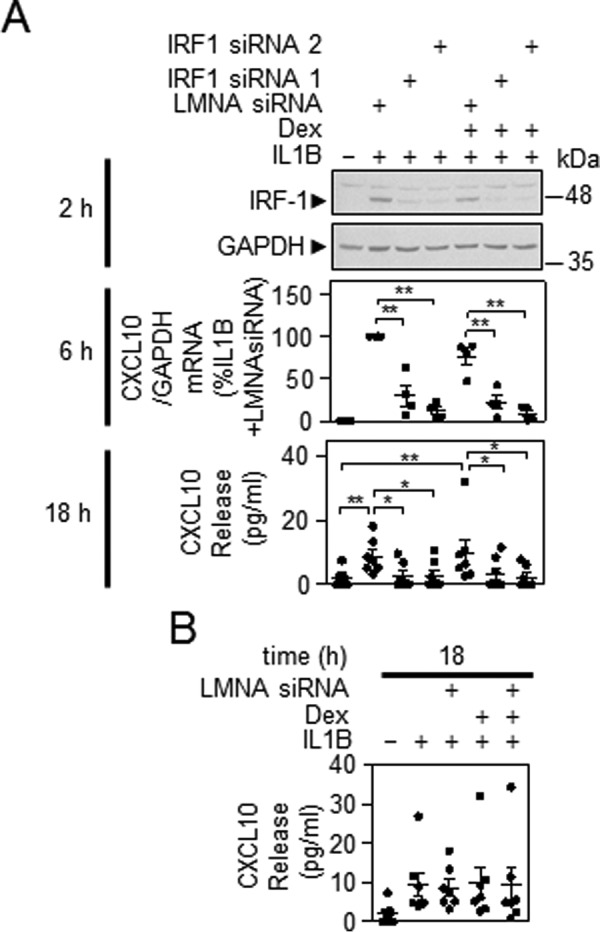
Effect of IRF1-targeting siRNA on CXCL10 expression. A, A549 cells were incubated with LMNA (control) or IRF1-specific siRNAs. After 24 h, cells were treated with IL1B (1 ng/ml) or IL1B plus dexamethasone (1 μm) (Dex) as indicated. Cells were harvested at 2 h, and total proteins were prepared for Western blotting analysis of IRF1 and GAPDH. Blots representative of at least four such experiments are shown (upper panel). Cells were treated as in A and harvested at 6 h for real-time PCR analysis of CXCL10 and GAPDH. Data (n = 4) were normalized to GAPDH and expressed as a percentage of LMNA siRNA plus IL1B-stimulated cells and plotted (middle panel). Cells were treated as in A and the supernatants were harvested after 18 h for CXCL10 release measurement. Data (n = 7) expressed in pg/ml are plotted (bottom panel). Significance was tested using ANOVA with a Bonferroni's multiple comparison test. Significance between LMNA control siRNA plus IL1B and each of the IRF1 targeting siRNAs plus IL1B and the LMNA control plus IL1B plus dexamethasone is shown. Other comparisons are specifically indicated. B, effect of LMNA siRNA on IL1B-induced CXCL10 release is shown. *, p < 0.05; **, p < 0.01.
Effect of DUSP1 Silencing on MAPKs, IRF1, and IRF1-dependent Gene Expression
As glucocorticoids reduce MAPK activity by inducing the expression of DUSP1 (10), the effect of DUSP1 silencing was examined on IRF1 expression. After 1 h of IL1B, DUSP1 protein was induced, and this was enhanced by dexamethasone (Fig. 10A) (22, 23, 27). In previous studies dexamethasone, IL1B, and IL1B plus dexamethasone showed no effect on the expression of total ERK (22) and total p38 (36), and Western blotting for total JNK also confirms this for JNK (data not shown). Therefore, GAPDH was selected as a common loading control to examine these three pathways. As previously reported (23), DUSP1-targeting siRNAs substantially reduced DUSP1 expression and produced increases in p38, ERK, and JNK phosphorylation, both in the presence of IL1B alone or IL1B plus dexamethasone (Fig. 10A). LMNA siRNA had no effect on IL1B or IL1B plus dexamethasone-induced DUSP1 or on MAPK activity. These data confirm a role for DUSP1 in the IL1B-induced feedback control of MAPKs and in the repression of MAPK activity by glucocorticoids.
FIGURE 10.

Effect of DUSP1-targeting siRNA on IL1B-induced MAPKs, IRF1, and CXCL10 expression. A and B, A549 cells were incubated with LMNA (control) or DUSP1-specific siRNAs. After 24 h, cells were treated with IL1B (1 ng/ml) or IL1B plus dexamethasone (Dex; 1 μm) as indicated. Cells were then harvested at 1 and 4 h, and total proteins were prepared for Western blotting analysis of DUSP1, phospho-ERK (P-ERK), phospho-p38 (P-p38), phospho-JNK (P-JNK), IRF1, and GAPDH. Blots representative of at least 6–9 such experiments are shown. For B, after densitometric analysis, data (n = 4) were normalized to GAPDH and expressed as a percentage of LMNA siRNA plus IL1B-stimulated cells and plotted. C, cells were treated as in A and harvested at 6 h for real-time PCR analysis of CXCL10 and GAPDH. Data (n = 8) normalized to GAPDH were expressed as a percentage of LMNA siRNA plus IL1B-stimulated cells and plotted. Significance using ANOVA with a Bonferroni's multiple comparison test is indicated. Significance between LMNA control siRNA plus IL1B and each of the DUSP1 targeting siRNAs plus IL1B, and the LMNA control plus IL1B plus Dex is shown. *, p < 0.05; **, p < 0.01; ***, p < 0.001.
Western blotting for IRF1 was performed at 4 h, the time at which loss of IL1B-induced IRF1 was just starting to occur. In the presence of the two DUSP1 siRNAs, IL1B-induced IRF1 expression was significantly reduced relative to LMNA control (Fig. 10B). Similarly, IRF1 expression in the presence of IL1B plus dexamethasone was comparable to that with IL1B alone and is consistent with Fig. 6B. The siRNA-mediated loss of DUSP1 again produced significant reductions in IRF1 expression compared with control (Fig. 10B). These data support a role for DUSP1, induced by IL1B or IL1B plus dexamethasone, in maintaining IRF1 expression.
The effect of DUSP1 silencing on CXCL10 mRNA expression was examined. In the presence of IL1B treatment, CXCL10 mRNA showed a trend toward reduced IL1B-induce expression in the presence of the DUSP1 targeting siRNAs (Fig. 10C). However, with IL1B plus dexamethasone, DUSP1 knockdown produced significant reductions in CXCL10 mRNA expression compared with IL1B + dexamethasone with the LMNA control (Fig. 10C). Thus, loss of DUSP1 also leads to reductions in CXCL10 expression.
Effect of MAPK Inhibitors on IL1B-induced CXCL10 Expression
Inhibition of all three MAPK pathways resulted in elevated IL1B-induced mRNA expression of CXCL10 (Fig. 11A). Similarly, IL1B-dependent release of CXCL10 into the supernatant was also significantly enhanced by MAPK inhibition (Fig. 11B). These data are consistent with the effect of DUSP1 overexpression and confirm that inhibition of MAPK pathways leads to elevate expression of CXCL10.
FIGURE 11.
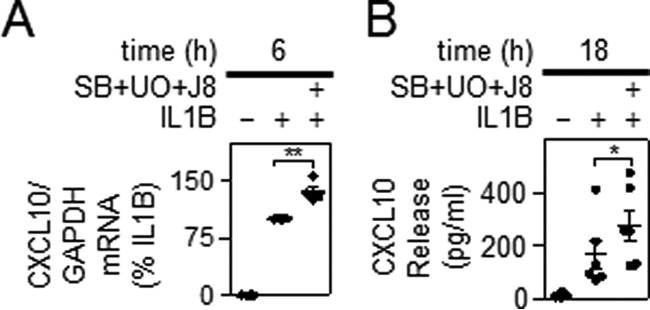
Effect of MAPK inhibitors on IL1B-induced CXCL10 expression. A, A549 cells were either not stimulated, treated with IL1B (1 ng/ml), or pretreated with a combination of UO126 and SB203580 plus JNK inhibitor 8 each at 10 μm (SB+UO+J8) for 30 min before IL1B stimulation. Cells were harvested after 6 h for real-time PCR analysis of CXCL10 and GAPDH. Data (n = 4) were normalized to GAPDH and expressed as a percentage of IL1B-stimulated cells and plotted. B, cells were treated as in A, and the supernatants were harvested after 18 h for CXCL10 release measurement. Data (n = 6), expressed in pg/ml, are plotted. For A and B, significance relative to IL1B-treated samples was tested using a paired t test. *, p < 0.05; **, p < 0.01.
Discussion
DUSP1-mediated inhibition of MAPKs and inflammatory gene expression is an essential feature of glucocorticoid action (10, 23). However, glucocorticoids also spare, even enhance, epithelial innate/host defense responses (7, 37, 38). Using A549 cells, we show that although 19 of 46 IL1B-induced mRNAs tested were significantly repressed by DUSP1 overexpression, 14, including IRF1, were significantly enhanced. Since IL1B-induced DUSP1 provides feedback control of MAPKs and glucocorticoids further enhance DUSP1 expression, this observation has a clear implication for understanding inflammatory gene regulation by glucocorticoids.
As there is extensive negative cross-regulation between MAPKs (39–41) and glucocorticoids inhibit all three main MAPK pathway (23), MAPK inhibitors were combined to simultaneously target the p38, ERK, and JNK pathways. Like DUSP1 overexpression, the combined MAPK inhibitors prolonged the expression of IL1B-induced IRF1 at later time points. Rather than boosting the induction of IL1B-induced IRF1 expression, MAPK inhibition appeared to attenuate mechanisms that reduce IRF1 expression. Thus, peak levels of IL1B-induced IRF1 transcription were unaffected by MAPK inhibition, but the subsequent rapid decline in IRF1 transcription was attenuated by MAPK inhibition. This is consistent with findings that ERK can enhance nuclear localization of HDAC4 to promote transcriptional repression (42). Similarly, even though p38 inhibition had no initial effect on IRF1 mRNA stability, with longer IL1B treatment times there was a modest transcript stabilization, and a similar effect was shown for DUSP1 overexpression. Thus, reducing MAPK activity promotes IRF1 mRNA expression. In addition and along with other short-lived transcription factors (43, 44), IRF1 is an unstable protein (t½ ∼ 30 min) and subject to proteasome-dependent degradation (33). Furthermore, although MAPKs are typically necessary for transcriptional activation, they may play roles in degradation and switching off transcription factors (45). In the current study, inhibition of MAPKs, using small molecule kinase inhibitors or after DUSP1 overexpression, modestly enhanced IRF1 protein stability. These data collectively point to the existence of multiple MAPK-dependent mechanisms that actively reduce IRF1 expression (Fig. 12A). Thus, silencing of IL1B-induced DUSP1 enhanced MAPK phosphorylation and reduced IRF1 protein expression (Fig. 12B). This confirms a regulatory network whereby DUSP1 switches off MAPKs to maintain IL1B-induced IRF1 expression. Such data are consistent with negative regulation of IRF1 by MAPKs in primary HBE and BEAS-2B cells and in DUSP1−/− mouse macrophages (12, 46, 47).
FIGURE 12.

Regulation of IRF1 and IRF1-dependent late-phase gene expression by IL1B after DUSP1 silencing and glucocorticoid treatment. Schematics representing possible regulatory networks are shown. A, IL1B treatment results in the activation of MAPKs. This, along with the activation of other signaling pathway and inflammatory transcription factors, e.g. NF-κB and AP-1 (not shown), enhances expression of the negative feed-back regulator, DUSP1. After MAPK activation, the increased expression of DUSP1 is one mechanism by which MAPK activity is restored to basal. Expression of late-phase inflammatory genes by IL1B depends on IRF1 activation. IL1B-mediated activation of MAPKs negatively regulates the expression of IL1B-induced IRF1 and selected IRF1-dependent late-phase genes (e.g. CXCL10). B, with reduced DUSP1 expression there is reduced negative feedback control of MAPKs leading to enhanced MAPK activity (at 1 h) (bold) at the times where DUSP1 expression would have been elevated. This reduces IRF1 (gray) expression. C, in the presence of glucocorticoid co-treatment, DUSP1 expression is enhanced (bold) and promotes inactivation of MAPKs (gray). Loss of MAPK activity maintains the expression of IRF1 and selected IRF1-dependent late-phase genes (e.g. CXCL10) in the presence of glucocorticoids. However, because the expression of some of the IRF1-dependent late-phase genes (e.g. APOL6, CMPK2, CFB, HELZ2, IFIT1, IFIT3 iso1&2, MX1, and UBD) is variable but significantly repressed by glucocorticoids, additional glucocorticoid effectors must exist to exert repression of these other IRF1-dependent late-phase genes. Positive signaling/expression (blue) is represented by arrows. Negative effects are indicated (red) by lines ending in a T-bar.
In terms of the 11 late-phase mRNAs analyzed here, all, with the exception of TLR2, were found to be IRF1-dependent. This is consistent with IRF1 being recruited to the promoters of CMPK2, CXCL10, IFIT1, and IFIT3 after IL1B treatment. Furthermore, IRF1 is implicated in the up-regulation of CFB and CXCL10, and ChIP-Seq data show IRF1 binding at the APOL6, IFIT1, and IFIT3 genes (13, 48, 49). Thus, a positive role for IRF1 is confirmed, and the inhibition of MAPK activity followed by maintenance of IRF1 expression explains the observed ability of DUSP1 to enhance expression of these mRNAs (Fig. 12, A and B). Equally, IL1B-induced expression of TLR2 was independent of IRF1, and the enhancement by DUSP1 must occur via alternative mechanisms. In marked contrast, CCL5 and CXCL5 expression was highly up-regulated after the loss of IRF1 and is consistent with a negative role for IRF1 in regulating CCL5 (50). However, because CCL5 is important in asthma pathogenesis (51), the maintenance of IRF1 by DUSP1 may be considered beneficial.
Although the combined MAPK inhibitors and DUSP1 overexpression both maintained IL1B-induced IRF1 expression, effects on downstream IRF1-dependent mRNAs were more variable (data not shown). Thus, DUSP1 overexpression increased the expression of 10 IRF1-dependent IL1B-induced mRNAs. However, with the combined MAPK inhibitors, five of these mRNAs (CFB, CXCL10, HELZ2, IFIT1, and IFIT3 isoform 2) showed enhanced expression, although others were simply unaffected or were modestly reduced (Fig. 11A and data not shown). Explanations for this are multiple, but are likely to involve 1) the fact that additional pathways and/or factors will be necessary for expression of these late-phase genes, and 2) the combined use of small molecule inhibitors of the p38, ERK, and JNK MAPK pathways is not entirely synonymous with DUSP1 overexpression. Additionally, all these late-phase genes are NF-κB-dependent (supplemental Table 2), and MAPKs can show opposing effects on NF-κB-dependent gene expression (52, 53). Equally, although the selectivity of these small molecule kinase inhibitors is good, a number of off-target effects are well established (54–56). Conversely, DUSP1 may target a number of non-MAPK kinases, and again, such effects are unlikely to be mimicked by the kinase inhibitors (57). In addition, regulatory events, such as polymerase II cycling, mRNA processing, splicing, polyadenylation, translation, and other control processes, may also affect late-phase gene expression in a time-dependent manner. Such considerations combined with complex effects of positive and negative regulatory processes are likely to explain the fact that after DUSP1 knockdown, only CXCL10 (Fig. 10C) and IFIT3 isoform 2 (data not shown) mRNAs showed trends toward reduced expression at 6 h and other late-phase genes were without obvious effect (data not shown).
Turning to the actions of dexamethasone, we confirm that IL1B-induced expression of DUSP1 is enhanced by dexamethasone to reduce MAPK phosphorylation (23, 27) (Fig. 12C). Furthermore, silencing of IL1B plus dexamethasone-induced DUSP1 significantly reduced IRF1 expression and the expression of CXCL10. As CXCL10 is IRF1-dependent and the presence of IL1B-induced IRF1 at gene promoters was not materially altered (at 4 h) by dexamethasone, these data confirm that glucocorticoids potentiate DUSP1 expression to reduce MAPK signaling and thereby maintain IRF1 and CXCL10 expression (Fig. 12C). Despite dexamethasone-dependent repression varying considerably for the different late-phase genes (38, 58, 59), this statement also appears to hold true, even for the more highly repressed mRNAs (data not shown). Thus, the repression by dexamethasone on these genes must primarily involve mechanisms other than IRF1 (Fig. 12C). However, the current data reveals a complex interplay of dexamethasone effects on IRF1 expression. Therefore, the appearance of IRF1 2 h post-IL1B was reduced by 32.5 ± 5.6% in the presence of dexamethasone, but this repression was completely lost by 4 h. Because IL1B-induced IRF1 mRNA showed ∼25–30% repression by dexamethasone at all times, the existence of translational or post-translational mechanisms acting to restore IRF1 levels are suggested. In this context, we show a modest stabilization of IRF1 protein in the presence of MAPK inhibitors and with DUSP1 overexpression as well as after dexamethasone treatment.
At the level of IRF1 transcription induced by IL1B, dexamethasone caused an ∼50% loss at 1 h. Since IL1B-induced IRF1 expression is NF-κB-dependent (supplemental Table 2) and the repression of IRF1 mRNA by dexamethasone occurs in the presence of the translational blocker, cycloheximide (51), we suggest that direct GR repression, i.e. transrepression, may account for this early effect on IRF1 transcription rate. This is supported by the data from BEAS-2B cells showing dexamethasone to reduce TNF-induced IRF1 expression (data not shown) in a manner that correlates with reduced binding of p65 (RELA) to the IRF1 promoter region (29).3 However, irrespective of any GR transrepression, within 2 h post-treatment there was no effect of dexamethasone on IRF1 transcription. This was potentially due to the loss of MAPK-dependent feed-forward control and represents a further mechanism to limit the repression of IRF1 expression by glucocorticoids (Fig. 12C).
Taken as a whole, our results indicate that besides the established anti-inflammatory actions, glucocorticoids may spare, even enhance, innate host defense responses via the DUSP1-mediated maintenance of IRF1- and IRF1-dependent gene expression. In this respect, roles for IRF1 and CXCL10 in innate immunity, anti-viral defenses, and in the development of Th1 immunity are suggested and may be promoted by DUSP1 (16, 26, 60). Conversely, enhanced IRF1 expression is linked and/or associated with reduced glucocorticoid sensitivity (18, 19). This may reflect that IRF1-dependent responses are maintained in the presence of glucocorticoids and, therefore, appear resistant. However, roles for CXCL10 in airway inflammation and hyper-responsiveness (61) or in virus-induced exacerbations of asthma (62) suggest that such effects may not be therapeutically desirable. Thus, our results add to, indeed modify, the concept of glucocorticoid-insensitivity as inflammatory pathways involving IRF1 could by maintained by the glucocorticoid and may contribute toward a poor therapeutic ratio. Indeed, contrary to initial expectations (10, 11), it may be that novel glucocorticoids with a reduced ability to induce DUSP1 and/or inhibit MAPK pathways could show an improved efficacy in the context of IRF1-dependent inflammatory responses. In this context, it is notable that compound A (cpdA) shows a reduced ability compared with fluticasone propionate to induce DUSP1 expression and yet repress CXCL10 expression more effectively (63).
In conclusion, these data support a regulatory scheme whereby inhibition of MAPK by glucocorticoids maintains IRF1 expression to allow continued expression of IRF1-dependent genes, such as CXCL10 (Fig. 12C). Although the data described here are primarily from A549 cells, this is likely to be physiologically and therapeutically relevant, as in primary HBE cells there was also little repressive effect of dexamethasone on IL1B-induced IRF1 expression. Furthermore, DUSP1 is significantly induced in the human airways after inhaled corticosteroid administration (64). Likewise data from DUSP1 knock-out mouse models directly support these findings, and taken together this emphasizes the in vivo relevance of the current findings (12, 46). Additionally, IRF1 is activated by interferons (IFNs) via the STAT1 transcription factor, and IFN- and STAT1-mediated inflammatory responses are also insensitive to glucocorticoids (12, 65). However, because the deficiency of DUSP1 attenuates IFNγ- and IRF1-dependent IL12 expression, a wider relevance to these data is anticipated (12, 66). Although testing with additional inflammatory genes using different stimuli in further relevant cell types (for example macrophage or monocytes) is warranted, we speculate that a loss of glucocorticoid-induced DUSP1 could enhance glucocorticoid sensitivity in the context of host defense responses where IRF1 is a driver. This may offer favorable effects, for example in asthmatics who smoke or have viral infections, but such a proposal should be treated with extreme caution.
Experimental Procedures
Gene Nomenclature
Unless otherwise indicated, official Human Genome Organization (HUGO) gene nomenclature committee gene symbols are used for genes and gene products.
Cell Culture and Drugs
A549 cells were grown in complete Dulbecco's modified Eagle's medium (DMEM) (Gibco) containing 10% fetal calf serum and 2.0 mm l-glutamine. Primary HBE cells, isolated from non-transplanted normal human lungs obtained using the tissue retrieval service at the International Institute for the Advancement of Medicine (Edison, NJ) were cultured in bronchial epithelial cell growth medium (BEGM; Lonza, Allendale, NJ) as described (67). Cells were cultured at 37 °C in 5% CO2/95% air and were incubated with serum or growth factor-free medium overnight before all experiments. IL1B (R&D Systems) was dissolved in phosphate-buffered saline (PBS) plus 0.1% bovine serum albumin (BSA) (both Sigma). Dexamethasone (Sigma), SB203580, (JUN N-terminal kinase) JNK inhibitor 8, and UO126 (all from Calbiochem) were dissolved in DMSO. Final DMSO concentrations were ≤0.1%.
Western Blotting and Enzyme-linked Immunosorbent Assay (ELISA)
Western blotting was carried out as described (21). Nitrocellulose membranes were blocked in 5% milk in 1× Tris-buffered saline, 1% Tween 20 (TBST) for 1 h at room temperature, washed with TBST, and probed with rabbit antibodies to DUSP1 (M-18, sc-1102) and IRF1 (C-20, sc-497) (both from Santa Cruz Biotechnology), phospho-p44/42, ERK1/2 (#9101), phopsho-p38 MAPK (#9211), and phospho-JNK (#9251) (all Cell Signaling Technology), and glyceraldehyde-3-phosphate dehydrogenase (GAPDH) (4699–9555(ST)) (AbDSerotec) followed by washing with TBST and incubation with horseradish peroxidase-linked secondary immunoglobulin (Dako/Jackson ImmunoResearch Laboratories). Immune complexes were detected by enhanced chemiluminescence (GE Healthcare). Prior analyses in A549 cells with dexamethasone, IL1B, and IL1B plus dexamethasone did not affect the expression of total ERK (22), total p38 (36), or total JNK (data not shown). Thus, GAPDH was selected as a loading control for the combined analysis of all three pathways. ELISA for CXCL10 was performed using DuoSet ELISA kits (R&D Systems).
RNA Isolation, cDNA Synthesis, and SYBR Green qPCR
Total RNA was extracted using the RNeasy mini kit (Qiagen), and 0.5 μg was used to produce cDNA as described (68). Resultant cDNA was diluted 1:4 with RNase-free water, and qPCR was carried out on 2.5 μl of cDNA using SYBR GreenER mastermix (Invitrogen) with a StepOne Plus™ PCR system (Applied Biosynthesis). Relative cDNA concentrations were derived from standard curves generated by serial dilution of an IL1B-treated sample. Amplification conditions were: 50 °C, 2 min, 95 °C, 10 min, then 40 cycles of 95 °C, 15 s, 60 °C, 1 min. Primer specificity was assessed by dissociation (melt) curve analysis: 95 °C, 15 s, 60 °C, 20 s followed by ramping to 95 °C over 20 min. Primer sequences are shown in supplemental Table 3A.
Adenoviral Infection
A549 cells were infected with adenovirus as described (21). Cells at ∼70% confluence were incubated with the indicated multiplicity of infection (m.o.i.) of DUSP1-expressing adenoviral vector (Ad5-DUSP1) (Seven Hills Bioreagents) or a GFP-expressing vector (Ad5-GFP) (Qbiogene) in serum-containing medium. After 24 h the cells were incubated overnight in serum-free medium before experiments.
Analysis of Unspliced Nuclear RNA as a Measure of Transcription Rate
Unspliced nuclear RNA and/or nascent transcripts accumulate transiently in the nucleus after transcriptional activation and provide a surrogate of transcription rate (21, 22). Unspliced nuclear RNA was analyzed using SYBR Green primers that spanned the exon 1/intron 1 junction for IRF1. Expression was normalized to the abundant small nuclear RNA, U6. Because these primers detect both nuclear RNA and genomic DNA, the signal due to the contaminating genomic DNA was assessed. Each RNA sample was subject to reverse transcription both in the presence and the absence of reverse transcriptase. The presence of an amplification product in the reverse transcription-negative samples was attributed to genomic DNA contamination, and samples with >10% genomic contamination for U6 were excluded from the analysis. RNA extraction, cDNA synthesis, and SYBR Green qPCR were carried out as described above. Primer sequences are shown in supplemental Table 3A.
siRNA-mediated Gene Silencing
A549 cells at ∼60–70% confluence were grown in 12-well plates and transiently transfected with 1 ml of serum-free medium containing DUSP1 or IRF1 or lamin A/C siRNA (LMNA) (control siRNA) at a final concentration of 25 nm (DUSP1) or 50 nm (IRF1 siRNA). Concentrations of control LMNA siRNA were the same as for the targeting siRNAs. Each siRNA was mixed with LipofectamineTM RNAiMAX (1 μl of 1 μg/μl) (Invitrogen) in 100 μl of serum-free DMEM and incubated at room temperature for 30 min before dilution to 1 ml and the addition to cells. After 24 h, the medium was changed to fresh serum-free medium before experiments. Because the expression of IRF1 and other genes induced by IL1B or IL1B plus dexamethasone was unaltered by LMNA siRNA (data not shown), treatment with IL1B or IL1B plus dexamethasone in the absence of LMNA siRNA was excluded from further analyses. Sequences for siRNA targeting are shown in supplemental Table 3B.
ChIP
After the experiments, formaldehyde was added to the culture medium at a final concentration of 0.75% v/v, and ChIP was performed as described (69). Resultant ChIP DNA was analyzed by qPCR as above. Relative IRF1 occupancy was taken as the difference between the CT values for each test region relative to the geometric mean of the CT values for three negative control regions (hMYOD1, hOLIG3, hMYOG). Amplification of diluted input DNA generated similar CT values for control and test regions primers. Primer sequences are shown in supplemental Table 3C.
Data Presentation and Statistical Analyses
GraphPad Prism 5 software was used for statistical analyses. Data are plotted as scatter plots or line graphs showing means ± S.E. unless otherwise stated. One-way ANOVA with a Bonferroni post-test was used for comparing five or fewer comparisons. Because the Bonferroni post-test gives high and increasingly inappropriate false negative rates (i.e. type II or β error) for greater than five comparisons, ANOVA with Newman-Keuls multiple comparison test was used for greater than five comparisons, as is recommended for greater power in hypothesis testing (Prism 5, Graphpad Software). ANOVA with a Dunnett's post-test was used for comparisons against a single control column. Two-tailed, paired Student t test was used for comparing two treatment groups. ChIP data were analyzed by Friedman test with Dunn's post-test. The null hypothesis was rejected where p < 0.05 (*), p < 0.01 (**), and p < 0.001 (***).
Author Contributions
S. S. and R. N. designed the experiments, interpreted the data, and wrote the manuscript. S. S., E. M. K., M. M. M., and M. O. A. performed the experiments. All authors critically reviewed the manuscript.
Supplementary Material
Acknowledgments
Real-time PCR was performed by virtue of an equipment and infrastructure grant from the Canadian Fund of Innovation (CFI) and the Alberta Science and Research Authority.
This work was supported by operating grants from the Canadian Institutes of Health Research (CIHR) (MOP 68828 and 125918) (to R. N.) and Alberta Innovates Health Solution, Lung Association of Alberta and the North West Territories, and University of Calgary Studentships (to S. S.). Work in the laboratory of R. N. was also supported by grants from AstraZeneca and GlaxoSmithKline. R. N. holds research contracts with AstraZeneca.

This article contains supplemental Tables 1–3.
A. Gerber, personal communication.
- GR
- glucocorticoid receptor
- IRF
- interferon regulatory factor
- DUSP1
- dual-specificity phosphatase 1
- Ad5
- adenovirus serotype 5
- HBE
- human bronchial epithelial
- m.o.i.
- multiplicity of infection
- TLR
- Toll-like receptor
- UBD
- ubiquitin D
- qPCR
- quantitative PCR
- m.o.i.
- multiplicity of infection
- ANOVA
- analysis of variance.
References
- 1. Barnes P. J. (2011) Glucocorticosteroids: current and future directions. Br. J. Pharmacol. 163, 29–43 [DOI] [PMC free article] [PubMed] [Google Scholar]
- 2. Jatakanon A., Uasuf C., Maziak W., Lim S., Chung K. F., and Barnes P. J. (1999) Neutrophilic inflammation in severe persistent asthma. Am. J. Respir. Crit. Care Med. 160, 1532–1539 [DOI] [PubMed] [Google Scholar]
- 3. Newton R., Leigh R., and Giembycz M. A. (2010) Pharmacological strategies for improving the efficacy and therapeutic ratio of glucocorticoids in inflammatory lung diseases. Pharmacol. Ther. 125, 286–327 [DOI] [PubMed] [Google Scholar]
- 4. Schäcke H., Döcke W. D., and Asadullah K. (2002) Mechanisms involved in the side effects of glucocorticoids. Pharmacol. Ther. 96, 23–43 [DOI] [PubMed] [Google Scholar]
- 5. Wang Y., Bai C., Li K., Adler K. B., and Wang X. (2008) Role of airway epithelial cells in development of asthma and allergic rhinitis. Respir. Med. 102, 949–955 [DOI] [PubMed] [Google Scholar]
- 6. Diamond G., Legarda D., and Ryan L. K. (2000) The innate immune response of the respiratory epithelium. Immunol. Rev. 173, 27–38 [DOI] [PubMed] [Google Scholar]
- 7. Schleimer R. P. (2004) Glucocorticoids suppress inflammation but spare innate immune responses in airway epithelium. Proc. Am. Thorac. Soc. 1, 222–230 [DOI] [PubMed] [Google Scholar]
- 8. Ehrchen J., Steinmüller L., Barczyk K., Tenbrock K., Nacken W., Eisenacher M., Nordhues U., Sorg C., Sunderkötter C., and Roth J. (2007) Glucocorticoids induce differentiation of a specifically activated, anti-inflammatory subtype of human monocytes. Blood 109, 1265–1274 [DOI] [PubMed] [Google Scholar]
- 9. Galon J., Franchimont D., Hiroi N., Frey G., Boettner A., Ehrhart-Bornstein M., O'Shea J. J., Chrousos G. P., and Bornstein S. R. (2002) Gene profiling reveals unknown enhancing and suppressive actions of glucocorticoids on immune cells. FASEB J. 16, 61–71 [DOI] [PubMed] [Google Scholar]
- 10. Clark A. R., Martins J. R., and Tchen C. R. (2008) Role of dual specificity phosphatases in biological responses to glucocorticoids. J. Biol. Chem. 283, 25765–25769 [DOI] [PMC free article] [PubMed] [Google Scholar]
- 11. Newton R. (2014) Anti-inflammatory glucocorticoids: changing concepts. Eur. J. Pharmacol. 724, 231–236 [DOI] [PubMed] [Google Scholar]
- 12. Korhonen R., Huotari N., Hömmö T., Leppänen T., and Moilanen E. (2012) The expression of interleukin-12 is increased by MAP kinase phosphatase-1 through a mechanism related to interferon regulatory factor 1. Mol. Immunol. 51, 219–226 [DOI] [PubMed] [Google Scholar]
- 13. Zaheer R. S., and Proud D. (2010) Human rhinovirus-induced epithelial production of CXCL10 is dependent upon IFN regulatory factor-1. Am. J. Respir. Cell Mol. Biol. 43, 413–421 [DOI] [PubMed] [Google Scholar]
- 14. Hayashi S., Jibiki I., Asai Y., Gon Y., Kobayashi T., Ichiwata T., Shimizu K., and Hashimoto S. (2008) Analysis of gene expression in human bronchial epithelial cells upon influenza virus infection and regulation by p38 mitogen-activated protein kinase and c-Jun-N-terminal kinase. Respirology 13, 203–214 [DOI] [PubMed] [Google Scholar]
- 15. Colonna M. (2007) TLR pathways and IFN-regulatory factors: to each its own. Eur. J. Immunol. 37, 306–309 [DOI] [PubMed] [Google Scholar]
- 16. Taniguchi T., Ogasawara K., Takaoka A., and Tanaka N. (2001) IRF family of transcription factors as regulators of host defense. Annu. Rev. Immunol. 19, 623–655 [DOI] [PubMed] [Google Scholar]
- 17. O'Neill L. A., and Bowie A. G. (2007) The family of five: TIR-domain-containing adaptors in Toll-like receptor signalling. Nat. Rev. Immunol. 7, 353–364 [DOI] [PubMed] [Google Scholar]
- 18. Tliba O., Damera G., Banerjee A., Gu S., Baidouri H., Keslacy S., and Amrani Y. (2008) Cytokines induce an early steroid resistance in airway smooth muscle cells: novel role of interferon regulatory factor-1. Am. J. Respir. Cell Mol. Biol. 38, 463–472 [DOI] [PMC free article] [PubMed] [Google Scholar]
- 19. Chapin W. J., Lenkala D., Mai Y., Mao Y., White S. R., and Huang R. S. (2015) Peripheral blood IRF1 expression as a marker for glucocorticoid sensitivity. Pharmacogenet. Genomics 25, 126–133 [DOI] [PMC free article] [PubMed] [Google Scholar]
- 20. King E. M., Chivers J. E., Rider C. F., Minnich A., Giembycz M. A., and Newton R. (2013) Glucocorticoid repression of inflammatory gene expression shows differential responsiveness by transactivation- and transrepression-dependent mechanisms. PLoS ONE 8, e53936. [DOI] [PMC free article] [PubMed] [Google Scholar]
- 21. King E. M., Holden N. S., Gong W., Rider C. F., and Newton R. (2009) Inhibition of NF-κB-dependent transcription by MKP-1: transcriptional repression by glucocorticoids occurring via p38 MAPK. J. Biol. Chem. 284, 26803–26815 [DOI] [PMC free article] [PubMed] [Google Scholar]
- 22. Newton R., King E. M., Gong W., Rider C. F., Staples K. J., Holden N. S., and Bergmann M. W. (2010) Glucocorticoids inhibit IL-1β-induced GM-CSF expression at multiple levels: roles for the ERK pathway and repression by MKP-1. Biochem. J. 427, 113–124 [DOI] [PubMed] [Google Scholar]
- 23. Shah S., King E. M., Chandrasekhar A., and Newton R. (2014) Roles for the mitogen-activated protein kinase (MAPK) phosphatase, DUSP1, in feedback control of inflammatory gene expression and repression by dexamethasone. J. Biol. Chem. 289, 13667–13679 [DOI] [PMC free article] [PubMed] [Google Scholar]
- 24. Chi H., Barry S. P., Roth R. J., Wu J. J., Jones E. A., Bennett A. M., and Flavell R. A. (2006) Dynamic regulation of pro- and anti-inflammatory cytokines by MAPK phosphatase 1 (MKP-1) in innate immune responses. Proc. Natl. Acad. Sci. U.S.A. 103, 2274–2279 [DOI] [PMC free article] [PubMed] [Google Scholar]
- 25. Hammer M., Mages J., Dietrich H., Servatius A., Howells N., Cato A. C., and Lang R. (2006) Dual specificity phosphatase 1 (DUSP1) regulates a subset of LPS-induced genes and protects mice from lethal endotoxin shock. J. Exp. Med. 203, 15–20 [DOI] [PMC free article] [PubMed] [Google Scholar]
- 26. Zhao Q., Wang X., Nelin L. D., Yao Y., Matta R., Manson M. E., Baliga R. S., Meng X., Smith C. V., Bauer J. A., Chang C. H., and Liu Y. (2006) MAP kinase phosphatase 1 controls innate immune responses and suppresses endotoxic shock. J. Exp. Med. 203, 131–140 [DOI] [PMC free article] [PubMed] [Google Scholar]
- 27. Shah S., Mostafa M. M., McWhae A., Traves S. L., and Newton R. (2016) Negative feed-forward control of TNF by tristetraprolin (ZFP36) is limited by the mitogen-activated protein kinase phosphatase, DUSP1: implications for regulation by glucocorticoids. J. Biol. Chem. 291, 110–125 [DOI] [PMC free article] [PubMed] [Google Scholar]
- 28. Sakai A., Han J., Cato A. C., Akira S., and Li J. D. (2004) Glucocorticoids synergize with IL-1β to induce TLR2 expression via MAP kinase phosphatase-1-dependent dual Inhibition of MAPK JNK and p38 in epithelial cells. BMC Mol. Biol. 5, 2. [DOI] [PMC free article] [PubMed] [Google Scholar]
- 29. Sasse S. K., Altonsy M. O., Kadiyala V., Cao G., Panettieri R. A. Jr., and Gerber A. N. (2016) Glucocorticoid and TNF signaling converge at A20 (TNFAIP3) to repress airway smooth muscle cytokine expression. Am. J. Physiol. Lung Cell Mol. Physiol. 311, L421–L432 [DOI] [PMC free article] [PubMed] [Google Scholar]
- 30. Holden N. S., Catley M. C., Cambridge L. M., Barnes P. J., and Newton R. (2004) ICAM-1 expression is highly NF-κB-dependent in A549 cells. No role for ERK and p38 MAPK. Eur. J. Biochem. 271, 785–791 [DOI] [PubMed] [Google Scholar]
- 31. Newton R., Cambridge L., Hart L. A., Stevens D. A., Lindsay M. A., and Barnes P. J. (2000) The MAP kinase inhibitors, PD098059, UO126, and SB203580, inhibit IL-1β-dependent PGE2 release via mechanistically distinct processes. Br. J. Pharmacol. 130, 1353–1361 [DOI] [PMC free article] [PubMed] [Google Scholar]
- 32. Darnell J. E., Jr. (2013) Reflections on the history of pre-mRNA processing and highlights of current knowledge: a unified picture. RNA 19, 443–460 [DOI] [PMC free article] [PubMed] [Google Scholar]
- 33. Nakagawa K., and Yokosawa H. (2000) Degradation of transcription factor IRF-1 by the ubiquitin-proteasome pathway. The C-terminal region governs the protein stability. Eur. J. Biochem. 267, 1680–1686 [DOI] [PubMed] [Google Scholar]
- 34. Watanabe N., Sakakibara J., Hovanessian A. G., Taniguchi T., and Fujita T. (1991) Activation of IFN-β element by IRF-1 requires a posttranslational event in addition to IRF-1 synthesis. Nucleic Acids Res. 19, 4421–4428 [DOI] [PMC free article] [PubMed] [Google Scholar]
- 35. Kadiyala V., Sasse S. K., Altonsy M. O., Berman R., Chu H. W., Phang T. L., and Gerber A. N. (2016) Cistrome-based cooperation between airway epithelial glucocorticoid receptor and NF-κB orchestrates anti-inflammatory effects. J. Biol. Chem. 291, 12673–12687 [DOI] [PMC free article] [PubMed] [Google Scholar]
- 36. King E. M., Kaur M., Gong W., Rider C. F., Holden N. S., and Newton R. (2009) Regulation of tristetraprolin expression by interleukin-1β and dexamethasone in human pulmonary epithelial cells: roles for nuclear factor-κB and p38 mitogen-activated protein kinase. J. Pharmacol. Exp. Ther. 330, 575–585 [DOI] [PubMed] [Google Scholar]
- 37. Stellato C. (2007) Glucocorticoid actions on airway epithelial responses in immunity: functional outcomes and molecular targets. J. Allergy Clin. Immunol. 120, 1247–1263 [DOI] [PubMed] [Google Scholar]
- 38. Zhang N., Truong-Tran Q. A., Tancowny B., Harris K. E., and Schleimer R. P. (2007) Glucocorticoids enhance or spare innate immunity: effects in airway epithelium are mediated by CCAAT/enhancer binding proteins. J. Immunol. 179, 578–589 [DOI] [PMC free article] [PubMed] [Google Scholar]
- 39. Hui L., Bakiri L., Mairhorfer A., Schweifer N., Haslinger C., Kenner L., Komnenovic V., Scheuch H., Beug H., and Wagner E. F. (2007) p38α suppresses normal and cancer cell proliferation by antagonizing the JNK-c-Jun pathway. Nat. Genet. 39, 741–749 [DOI] [PubMed] [Google Scholar]
- 40. Jeffrey K. L., Brummer T., Rolph M. S., Liu S. M., Callejas N. A., Grumont R. J., Gillieron C., Mackay F., Grey S., Camps M., Rommel C., Gerondakis S. D., and Mackay C. R. (2006) Positive regulation of immune cell function and inflammatory responses by phosphatase PAC-1. Nat. Immunol. 7, 274–283 [DOI] [PubMed] [Google Scholar]
- 41. Junttila M. R., Li S. P., and Westermarck J. (2008) Phosphatase-mediated crosstalk between MAPK signaling pathways in the regulation of cell survival. FASEB J. 22, 954–965 [DOI] [PubMed] [Google Scholar]
- 42. Zhou X., Richon V. M., Wang A. H., Yang X. J., Rifkind R. A., and Marks P. A. (2000) Histone deacetylase 4 associates with extracellular signal-regulated kinases 1 and 2, and its cellular localization is regulated by oncogenic Ras. Proc. Natl. Acad. Sci. U.S.A. 97, 14329–14333 [DOI] [PMC free article] [PubMed] [Google Scholar]
- 43. Kim T. K., and Maniatis T. (1996) Regulation of interferon-γ-activated STAT1 by the ubiquitin-proteasome pathway. Science 273, 1717–1719 [DOI] [PubMed] [Google Scholar]
- 44. Maki C. G., Huibregtse J. M., and Howley P. M. (1996) In vivo ubiquitination and proteasome-mediated degradation of p53(1). Cancer Res. 56, 2649–2654 [PubMed] [Google Scholar]
- 45. Laine A., and Ronai Z. (2005) Ubiquitin chains in the ladder of MAPK signaling. Sci. STKE. 2005, re5. [DOI] [PubMed] [Google Scholar]
- 46. Smallie T., Ross E. A., Ammit A. J., Cunliffe H. E., Tang T., Rosner D. R., Ridley M. L., Buckley C. D., Saklatvala J., Dean J. L., and Clark A. R. (2015) dual-specificity phosphatase 1 and tristetraprolin cooperate to regulate macrophage responses to lipopolysaccharide. J. Immunol. 195, 277–288 [DOI] [PMC free article] [PubMed] [Google Scholar]
- 47. Zaheer R. S., Koetzler R., Holden N. S., Wiehler S., and Proud D. (2009) Selective transcriptional down-regulation of human rhinovirus-induced production of CXCL10 from airway epithelial cells via the MEK1 pathway. J. Immunol. 182, 4854–4864 [DOI] [PubMed] [Google Scholar]
- 48. Huang Y., Krein P. M., Muruve D. A., and Winston B. W. (2002) Complement factor B gene regulation: synergistic effects of TNF-α and IFN-γ in macrophages. J. Immunol. 169, 2627–2635 [DOI] [PubMed] [Google Scholar]
- 49. Shi L., Perin J. C., Leipzig J., Zhang Z., and Sullivan K. E. (2011) Genome-wide analysis of interferon regulatory factor I binding in primary human monocytes. Gene 487, 21–28 [DOI] [PMC free article] [PubMed] [Google Scholar]
- 50. Miyamoto N. G., Medberry P. S., Hesselgesser J., Boehlk S., Nelson P. J., Krensky A. M., and Perez H. D. (2000) Interleukin-1β induction of the chemokine RANTES promoter in the human astrocytoma line CH235 requires both constitutive and inducible transcription factors. J. Neuroimmunol. 105, 78–90 [DOI] [PubMed] [Google Scholar]
- 51. Renauld J. C. (2001) New insights into the role of cytokines in asthma. J. Clin. Pathol. 54, 577–589 [DOI] [PMC free article] [PubMed] [Google Scholar]
- 52. Carter A. B., Knudtson K. L., Monick M. M., and Hunninghake G. W. (1999) The p38 mitogen-activated protein kinase is required for NF-κB-dependent gene expression: the role of TATA-binding protein (TBP). J. Biol. Chem. 274, 30858–30863 [DOI] [PubMed] [Google Scholar]
- 53. Carter A. B., and Hunninghake G. W. (2000) A constitutive active MEK → ERK pathway negatively regulates NF-κ B-dependent gene expression by modulating TATA-binding protein phosphorylation. J. Biol. Chem. 275, 27858–27864 [DOI] [PubMed] [Google Scholar]
- 54. Bain J., Plater L., Elliott M., Shpiro N., Hastie C. J., McLauchlan H., Klevernic I., Arthur J. S., Alessi D. R., and Cohen P. (2007) The selectivity of protein kinase inhibitors: a further update. Biochem. J. 408, 297–315 [DOI] [PMC free article] [PubMed] [Google Scholar]
- 55. Davies S. P., Reddy H., Caivano M., and Cohen P. (2000) Specificity and mechanism of action of some commonly used protein kinase inhibitors. Biochem. J. 351, 95–105 [DOI] [PMC free article] [PubMed] [Google Scholar]
- 56. Szczepankiewicz B. G., Kosogof C., Nelson L. T., Liu G., Liu B., Zhao H., Serby M. D., Xin Z., Liu M., Gum R. J., Haasch D. L., Wang S., Clampit J. E., Johnson E. F., Lubben T. H., and Stashko M. A., et al. (2006) Aminopyridine-based c-Jun N-terminal kinase inhibitors with cellular activity and minimal cross-kinase activity. J. Med. Chem. 49, 3563–3580 [DOI] [PubMed] [Google Scholar]
- 57. Zhao B. M., Keasey S. L., Tropea J. E., Lountos G. T., Dyas B. K., Cherry S., Raran-Kurussi S., Waugh D. S., and Ulrich R. G. (2015) Phosphotyrosine substrate sequence motifs for dual specificity phosphatases. PLoS ONE. 10, e0134984. [DOI] [PMC free article] [PubMed] [Google Scholar]
- 58. Pawliczak R., Logun C., Madara P., Barb J., Suffredini A. F., Munson P. J., Danner R. L., and Shelhamer J. H. (2005) Influence of IFN-γ on gene expression in normal human bronchial epithelial cells: modulation of IFN-γ effects by dexamethasone. Physiol. Genomics 23, 28–45 [DOI] [PubMed] [Google Scholar]
- 59. van de Garde M. D., Martinez F. O., Melgert B. N., Hylkema M. N., Jonkers R. E., and Hamann J. (2014) Chronic exposure to glucocorticoids shapes gene expression and modulates innate and adaptive activation pathways in macrophages with distinct changes in leukocyte attraction. J. Immunol. 192, 1196–1208 [DOI] [PubMed] [Google Scholar]
- 60. Griffith J. W., Sokol C. L., and Luster A. D. (2014) Chemokines and chemokine receptors: positioning cells for host defense and immunity. Annu. Rev. Immunol. 32, 659–702 [DOI] [PubMed] [Google Scholar]
- 61. Medoff B. D., Sauty A., Tager A. M., Maclean J. A., Smith R. N., Mathew A., Dufour J. H., and Luster A. D. (2002) IFN-γ-inducible protein 10 (CXCL10) contributes to airway hyperreactivity and airway inflammation in a mouse model of asthma. J. Immunol. 168, 5278–5286 [DOI] [PubMed] [Google Scholar]
- 62. Wark P. A., Bucchieri F., Johnston S. L., Gibson P. G., Hamilton L., Mimica J., Zummo G., Holgate S. T., Attia J., Thakkinstian A., and Davies D. E. (2007) IFN-γ-induced protein 10 is a novel biomarker of rhinovirus-induced asthma exacerbations. J. Allergy Clin. Immunol. 120, 586–593 [DOI] [PMC free article] [PubMed] [Google Scholar]
- 63. Gavrila A., Chachi L., Tliba O., Brightling C., and Amrani Y. (2015) Effect of the plant derivative Compound A on the production of corticosteroid-resistant chemokines in airway smooth muscle cells. Am. J. Respir. Cell Mol. Biol. 53, 728–737 [DOI] [PMC free article] [PubMed] [Google Scholar]
- 64. Leigh R., Mostafa M. M., King E. M., Rider C. F., Shah S., Dumonceaux C., Traves S. L., McWhae A., Kolisnik T., Kooi C., Slater D. M., Kelly M. M., Bieda M., Miller-Larsson A., and Newton R. (2016) An inhaled dose of budesonide induces genes involved in transcription and signaling in the human airways: enhancement of anti- and proinflammatory effector genes. Pharmacol. Res. Perspect. 4, 1–18 [DOI] [PMC free article] [PubMed] [Google Scholar]
- 65. O'Connell D., Bouazza B., Kokalari B., Amrani Y., Khatib A., Ganther J. D., and Tliba O. (2015) IFN-γ-induced JAK/STAT, but not NF-κB, signaling pathway is insensitive to glucocorticoid in airway epithelial cells. Am. J. Physiol. Lung Cell Mol. Physiol. 309, L348–L359 [DOI] [PMC free article] [PubMed] [Google Scholar]
- 66. Huang G., Wang Y., Shi L. Z., Kanneganti T. D., and Chi H. (2011) Signaling by the phosphatase MKP-1 in dendritic cells imprints distinct effector and regulatory T cell fates. Immunity 35, 45–58 [DOI] [PMC free article] [PubMed] [Google Scholar]
- 67. Hudy M. H., Traves S. L., Wiehler S., and Proud D. (2010) Cigarette smoke modulates rhinovirus-induced airway epithelial cell chemokine production. Eur. Respir. J. 35, 1256–1263 [DOI] [PubMed] [Google Scholar]
- 68. Chivers J. E., Gong W., King E. M., Seybold J., Mak J. C., Donnelly L. E., Holden N. S., and Newton R. (2006) Analysis of the dissociated steroid RU24858 does not exclude a role for inducible genes in the anti-inflammatory actions of glucocorticoids. Mol. Pharmacol. 70, 2084–2095 [DOI] [PubMed] [Google Scholar]
- 69. Sasse S. K., Mailloux C. M., Barczak A. J., Wang Q., Altonsy M. O., Jain M. K., Haldar S. M., and Gerber A. N. (2013) The glucocorticoid receptor and KLF15 regulate gene expression dynamics and integrate signals through feed-forward circuitry. Mol. Cell Biol. 33, 2104–2115 [DOI] [PMC free article] [PubMed] [Google Scholar]
Associated Data
This section collects any data citations, data availability statements, or supplementary materials included in this article.