Abstract
The mechanistic target of rapamycin complex 1 (mTORC1) coordinates cell growth with its nutritional, hormonal, energy, and stress status. Amino acids are critical regulators of mTORC1 that permit other inputs to mTORC1 activity. However, the roles of individual amino acids and their interactions in mTORC1 activation are not well understood. Here we demonstrate that activation of mTORC1 by amino acids includes two discrete and separable steps: priming and activation. Sensitizing mTORC1 activation by priming amino acids is a prerequisite for subsequent stimulation of mTORC1 by activating amino acids. Priming is achieved by a group of amino acids that includes l-asparagine, l-glutamine, l-threonine, l-arginine, l-glycine, l-proline, l-serine, l-alanine, and l-glutamic acid. The group of activating amino acids is dominated by l-leucine but also includes l-methionine, l-isoleucine, and l-valine. l-Cysteine predominantly inhibits priming but not the activating step. Priming and activating steps differ in their requirements for amino acid concentration and duration of treatment. Priming and activating amino acids use mechanisms that are distinct both from each other and from growth factor signaling. Neither step requires intact tuberous sclerosis complex of proteins to activate mTORC1. Concerted action of priming and activating amino acids is required to localize mTORC1 to lysosomes and achieve its activation.
Keywords: amino acid, cell signaling, lysosome, mammalian target of rapamycin (mTOR), mTOR complex (mTORC), protein kinase, S6 kinase
Introduction
The mTORC13 complex, composed of the protein kinase mTOR and accessory proteins, coordinates cell growth with the extra- and intracellular environments. In its active form, mTORC1 promotes synthesis of proteins, lipids, and nucleotides for cell growth by phosphorylating multiple downstream targets, including the p70 ribosome protein S6 kinase (S6K1), the eukaryotic translation initiation factor 4E-binding protein (4E-BP1), and the autophagy-associated kinase ULK1 (Atg1) (1–3). Metabolic resources such as amino acids and energy sources, growth factors, cytokines, and hormones coordinately promote cell growth by causing the phosphorylation of the mTOR kinase and thereby activating mTORC1.
mTORC1 is composed of the protein kinase mTOR and several associated proteins: Raptor (regulatory associated protein of mTOR), mLST8 (mammalian lethal with Sec13 protein 8, also known as GBL), PRAS40 (proline-rich AKT substrate 40 kDa), and Deptor (DEP domain-containing mTOR-interacting protein) (4). Deptor binds and inhibits mTOR in the absence of stimuli; upon stimulation Deptor quickly dissociates from mTOR and is subsequently degraded (5–8). In contrast, Raptor activates mTOR within the complex when it is phosphorylated in response to stimuli (9).
The activity of mTORC1 is further modulated by multiple inhibitory and stimulatory proteins. Signals from diverse growth factors and hormones, detected by their receptor tyrosine kinases, regulate mTORC1 through a well characterized PI3K-AKT pathway that ultimately terminates at Rheb (RAS homolog enriched in brain), a small G protein activator of mTOR (10). Rheb binds mTORC1 at the surface of lysosomes and promotes its phosphorylation to increase its kinase activity (11–13). Proximally, Rheb is negatively regulated by TSC2, a GTPase-activating protein for Rheb that is a component of the tuberous sclerosis complex. TSC2 is itself negatively regulated within the TSC by phosphorylation by the protein kinase AKT. Phosphorylation causes TSC to dissociate from the surface of lysosomes where Rheb and mTORC1 are localized for activation (14–16). Growth factors and hormones therefore stimulate mTORC1 by blocking inhibition of Rheb by TSC.
The lysosomal membrane is also the site where mTORC1 regulation by amino acids and growth factors converge because amino acids drive mTORC1 localization to lysosomes (17). Amino acids and growth factors are thus both required to achieve maximal mTORC1 stimulation. To localize mTORC1 to lysosomes, amino acids rely on lysosome-bound heterodimers of the Rag proteins, Rag A or B and Rag C or D. Amino acids promote the GTP-loaded state of the RagA/B subunit and GDP-loaded state of the RagC/D subunits and thus drive Rag heterodimer binding to the Raptor subunit of mTORC1 with consequent mTORC1 recruitment to lysosomes (12, 18).
Although amino acids are thought to promote mTORC1 localization to lysosomes and consequent activation through the Rag pathway, the identity of the amino acid sensors and the cellular sites of amino acid recognition in this process are still being identified. Proposed mechanisms include cytoplasmic sensing by the leucine-binding protein sestrin or leucyl-tRNA synthetases, intralysosomal sensing by the V-ATPases or SLC38A9 transporters, and extracellular sensing by taste receptors T1R1/T1R3 or SLC1A5 amino acid transporters (19–25). The amino acid specificity of mTORC1 regulation is also unclear. Leu and, to a smaller degree, Ile are effective activators of mTORC1 in a variety of mammalian systems. Leu binds cytoplasmic sestrin 2, which has been recently implicated in lysosomal localization and activation of mTORC1 (19, 26). It is also possible that mTORC1 senses Leu accumulated in the lysosomal lumen through the V-ATPase (27). Gln has been implicated in mTORC1 activation indirectly by promoting Leu uptake (20) or by supplying energy through glutaminolysis (28). Gln can also activate mTORC1 directly after prolonged incubations by a mechanism that apparently does not involve Leu (27). A third amino acid important for mTORC1 activation is Arg (22, 23, 29). Recently described regulation of Rag complex by the SLC38A9 transporter of Gln and Arg further supports a role of these amino acids in mTORC1 activation (22, 23).
Rag-independent modes of amino acid to mTORC1 signaling may exist. For example, Gln can activate mTORC1 at lysosomes in Rag-deficient cells via the small GTPase Arf1 (27). Amino acids can also activate mTORC1 independently of the Rags at the Golgi via another small GTPase Rab1A (30). Exact roles of each amino acid and their interplay in mTORC1 activation are not well understood. In this study we examine the mechanism by which amino acids activate mTORC1. We identify two distinct and sequential steps in mTORC1 activation by amino acids and classify amino acids based on their importance for each step of the activation process. For Leu and some other amino acids to activate mTORC1, cells first have to be primed by one of several priming amino acids, a group that includes Gln, Ser, Asn, and Arg. We also found that one amino acid, Cys, predominantly inhibits the priming step of mTORC1 activation by amino acids. Priming is independent of TSC and insulin and provides evidence of a new axis for nutrient to mTORC1 signaling.
Experimental Procedures
Cell Culture and Treatment
HeLa and HEK293T cells were cultured in DMEM supplemented with 10% fetal bovine serum with no antibiotics under 5% CO2. TSC2+/+ (p53−/−) MEFs and TSC2−/− (p53−/−) MEFs were a kind gift from James Brugarolas. The p53 knock-out in these cells was used to increase viability (31). COS7 cells and MEFs were cultured in DMEM supplemented with penicillin and streptomycin at 37 °C, and MEFs were held in a 2% O2/5% CO2 atmosphere. For amino acid starvation experiments, the cells were placed in Krebs-Ringer's solution (pH 7.4) (KRBH), supplemented with 4.5 mm glucose, 0.1% bovine serum albumin, and 1 mm sodium pyruvate for 1 or 2 h. Amino acids were diluted in KRBH, and the resulting solutions were adjusted to pH 7.4. All amino acids are the l-isomer. The cells were stimulated with individual amino acids or their combinations or with an amino acid mixture that includes 15 amino acids (Gly, Arg, cystine, Gln, His, Ile, Leu, Lys, Met, Phe, Ser, Thr, Trp, Tyr, and Val) at the concentrations contained in DMEM. For amino acid screening experiments (see Figs. 1–3), amino acids were added to the starvation medium in the order described in the text. For all other experiments, the cells were washed twice with KRBH between incubation with priming and stimulating amino acids.
FIGURE 1.
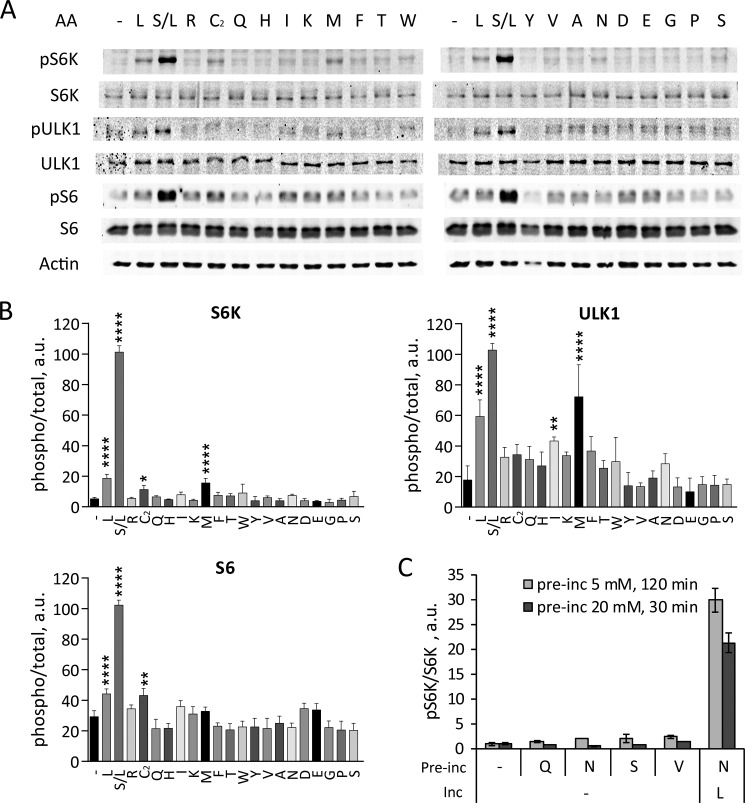
Individual amino acids have little effect on mTORC1 activity. A and B, HeLa cells starved in KRBH for 1 h were incubated in the absence (−) or in the presence of indicated amino acids for 40 min. Alternatively, starved cells were preincubated in the presence of Ser for 20 min followed by Leu for 20 min (S/L). A, the phosphorylation of S6K (Thr389), ULK1 (Ser757), S6 (Ser240/244), and total S6K, ULK1, S6, and actin was analyzed by immunoblotting. B, the means of pS6K/S6K, pULK1/ULK1, and pS6/S6 are expressed as percentages compared with S/L-treated cells. The data shown are averages of two independent experiments (n = 4) ± S.D. Asterisks denote values significantly different from cells treated in the absence of amino acids. *, p < 0.05; **, p < 0.01; ***, p < 0.001; ****, p < 0.0001 (Tukey's test). C, starved cells were preincubated in the absence (−) or in the presence of Gln, Asn, Ser, or Val at 5 mm for 120 min (light bars) or at 20 mm for 30 min (dark bars) followed by incubation in the absence or in the presence of 5 mm Leu for another 20 min. The means of pS6K/S6K values from immunoblots are expressed as fold increase compared with starved cells. The data shown are averages of two independent experiments performed in duplicate (n = 4) ± S.D.
FIGURE 2.
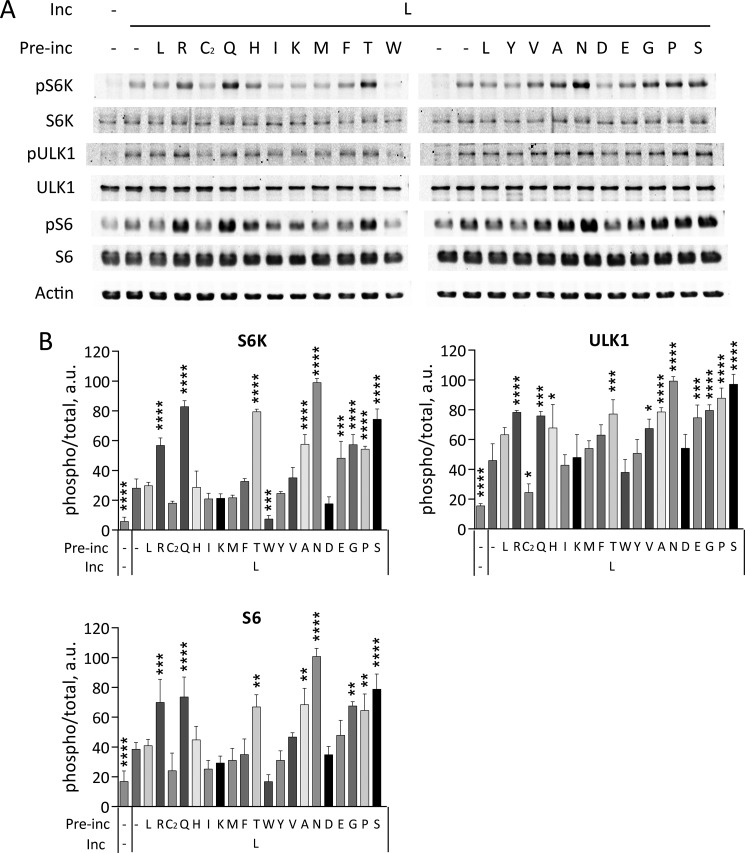
Individual amino acids differentially affect Leu-stimulated mTORC1 activity. HeLa cells starved in KRBH for 1 h were preincubated in the absence (−) or in the presence of indicated amino acids for 20 min followed by the incubation in the absence (−) or in the presence of Leu (L) for another 20 min. A, the phosphorylation of S6K (Thr389), ULK1 (Ser757), S6 (Ser240/244), and total S6K, ULK1, S6, and actin were analyzed by immunoblotting. B, the means of pS6K/S6K, pULK1/ULK1, and pS6/S6 are expressed as percentage compared with cells preincubated with Asn (N) followed by Leu. The data shown are averages of two independent experiments (n = 4) ± S.D. Asterisks denote values significantly different from cells treated with Leu alone. *, p < 0.05; **, p < 0.01; ***, p < 0.001; ****, p < 0.0001 (Tukey's test).
FIGURE 3.
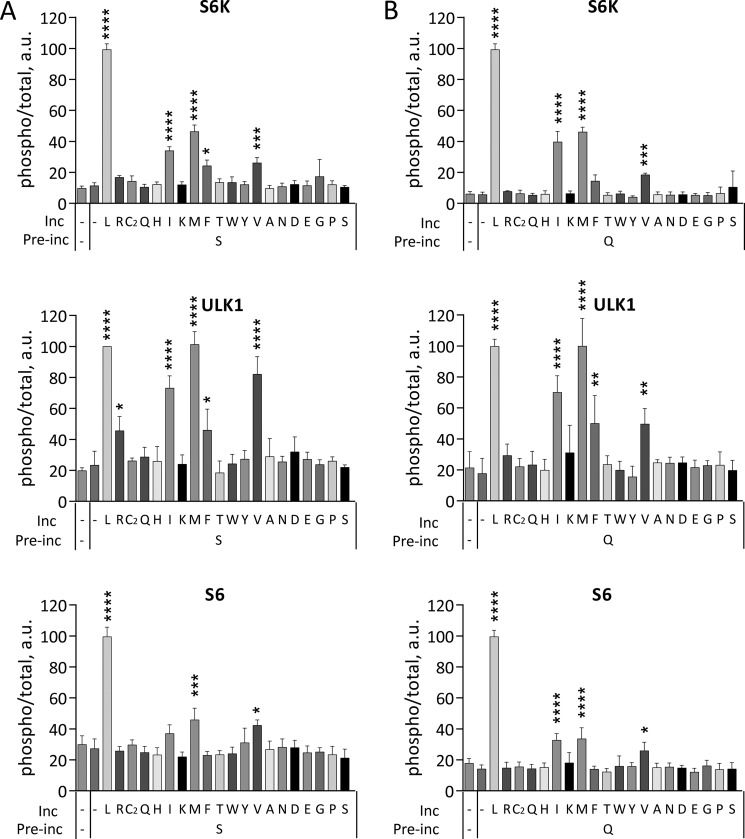
Activation of mTORC1 by individual amino acids in cells preincubated with Ser or Gln. HeLa cells starved in KRBH for 1 h were preincubated in the absence (−) or in the presence of Ser (A) or Gln (B) for 20 min followed by the incubation in the absence (−) or in the presence of indicated amino acids for another 20 min. The phosphorylation of S6K (Thr389), ULK1 (Ser757), S6 (Ser240/244), and total S6K, ULK1, and S6 were analyzed by immunoblotting. The means of pS6K/S6K, pULK1/ULK1, and pS6/S6 are expressed as percentages compared with cells preincubated with Ser followed by Leu. The data shown are averages of two independent experiments (n = 4) ± S.D. Asterisks denote values significantly different from cells treated with Ser alone (A) or Gln alone (B). *, p < 0.05; **, p < 0.01; ***, p < 0.001; ****, p < 0.0001 (Tukey's test).
Immunoblotting
The cells were rinsed with ice-cold PBS and lysed in SDS loading buffer (50 mm Tris-Cl, pH 6.8, 2% SDS, 6% glycerol, 0.005% bromphenol blue, 10 mm DTT). Lysates were homogenized by five passages through a 25-gauge needle and centrifuged for 5 min at 16,000 × g at 4 °C, and supernatants were heated at 100 °C for 5 min. Proteins were separated by SDS-PAGE and transferred to nitrocellulose for immunoblotting. Antibodies used for immunoblotting included rabbit anti-S6K (CS9202S), mouse anti-pS6K (T389) (CS9206) or rabbit anti-pS6K (T389) (CS9234), mouse anti-S6 ribosomal protein (CS2317S), rabbit anti-pS6 ribosomal protein (S240/244)(CS2215), rabbit anti-4EBP1 (CS9644), rabbit anti-p4EBP1 (T37/46) (CS2855), rabbit anti-ULK1 (CS8054), rabbit anti-pULK1 (S757) (CS6888), rabbit anti-mTOR (CS2972), and rabbit anti-phospho-mTOR (S2448) (CS2971S) from Cell Signaling Technology and mouse anti-β-actin (sc-47778) from Santa Cruz Biotechnology. Secondary antibodies were donkey anti-rabbit IRDye 680RD and donkey anti-mouse IRDye 800CW from LiCor. Blots were stripped between incubations using LiCor NewBlot stripping buffer. Imaging of immunoblots was performed using the LiCor Odyssey system. Protein bands were quantitated using “draw a rectangle” function of Image Studio software with median background subtraction (top and bottom). For each sample, the ratio of intensity of the anti-phosphoprotein band to that of the anti-protein band was calculated (“phospho/total”). For each experiment, one condition was then chosen as a reference and the average of the phospho/total ratios of duplicate samples was set to 100%. Phospho/total ratios of all other bands were then expressed as a percentage of that value. The calculated data are the means of all data from the number of experiments shown with errors calculated as standard deviations. Actin loading controls were included in all experiments to exclude grossly aberrant samples but were not used in evaluating relative phosphorylation except in Fig. 10, as shown.
FIGURE 10.
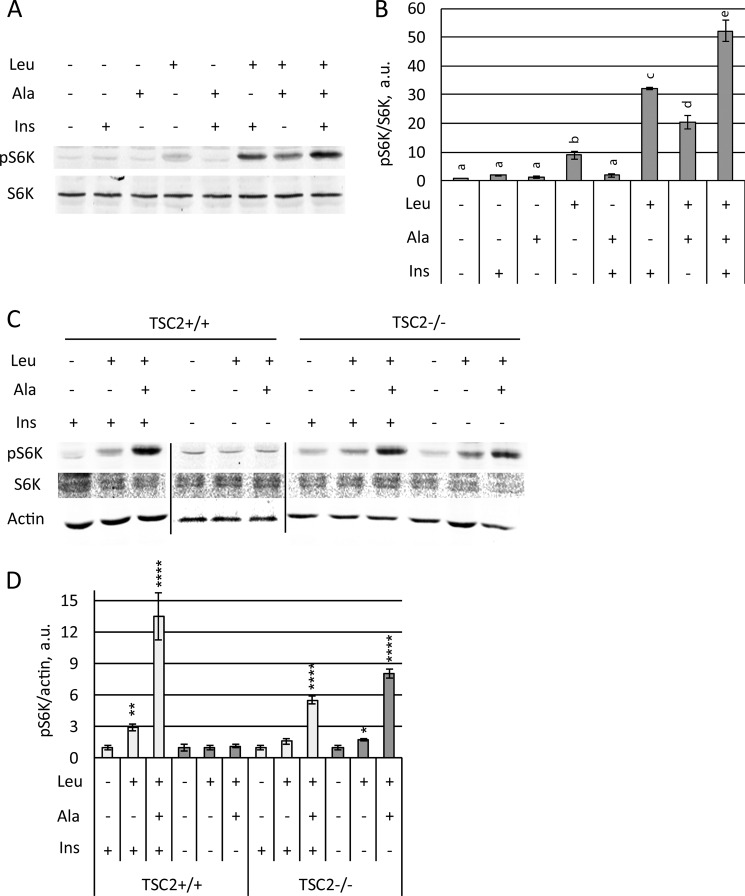
Insulin and Ala independently promote mTORC1 activation by Leu. A and B, Hela cells were serum-starved overnight before 2 h of incubation in KRBH followed by incubation with (+) or without (−) 5 mm Leu, 5 mm Ala, or 5 μg/ml insulin (Ins) for 30 min. A, the phosphorylation of S6K (Thr389) and total S6K were analyzed by immunoblotting. B, mean pS6K/S6K ratios are shown as fold increases compared with untreated controls. The data are averages of two independent experiments performed in duplicate (n = 4) ± S.D. Letters indicate groups of conditions that differ significantly from the others (p < 0.05; Tukey's test). C and D, TSC2+/+ (p53−/−) and TSC2−/− (p53−/−) MEFs were serum-starved overnight. The cells were then incubated in KRBH in the absence (−) or in the presence (+) of 5 μg/ml insulin for 2 h followed by treatment in the absence (−) or in the presence (+) of 5 mm Ala for 30 min followed by final treatment in the absence (−) or in the presence (+) of 5 mm Leu for 20 min. C, phosphorylation of S6K (Thr389) and total S6K and actin were analyzed by immunoblotting. D, pS6K/actin ratios are shown as fold increases compared with their respective no-treatment controls. The data shown are averages of two independent experiments performed in duplicate (n = 4) ± S.D. Asterisks denote values significantly different from the respective no amino acid controls. *, p < 0.05; **, p < 0.01; ***, p < 0.001; ****, p < 0.0001 (Tukey's test).
Immunoprecipitation
For immunoprecipitation of Raptor-associated mTORC1 proteins, HeLa cells were lysed in buffer containing 50 mm NaHepes (pH 7.7), 150 mm NaCl, 1.5 mm MgCl2, 1 mm EGTA, 10% (v/v) glycerol, 100 mm NaF, 0.2 mm NaVO4, 50 mm β-glycerophosphate, 0.3% CHAPS, 1× phosSTOP phosphatase inhibitor mixture (Roche), 0.1 μm phenylmethylsulfonyl fluoride, and 10 μg/ml each N-α-p-tosyl-l-lysine chloromethyl ester, N-α-p-tosyl-l-arginine methyl ester, N-α-p-tosyl-l-lysine chloromethyl ketone, leupeptin, and pepstatin A. Lysates were cleared by centrifugation at 20,000 × g for 20 min at 4 °C. Proteins were immunoprecipitated from 750 μg of soluble lysate protein with 5 μl of anti-Raptor antibody (Millipore 05-1470) for 4 h at 4 °C. Antibodies were collected with 15 μl of protein A-Sepharose (GE Healthcare) following a 2-h incubation at 4 °C. The immunoprecipitates were washed three times with lysis buffer and once with Tris-HCl (pH 7.5). Proteins were eluted with SDS loading buffer and subjected to SDS/PAGE (4–20% Tris/glycine gel; Invitrogen) followed by immunoblotting.
Immunofluorescence Microscopy
HeLa cells were washed twice with PBS; fixed with 4% paraformaldehyde (v/v) in 60 mm NaPipes, 25 mm NaHepes (pH 6.9), 10 mm EGTA, and 2 mm MgCl2 for 15 min; and washed twice for 5 min with PBS. The cells were permeabilized with 0.1% Triton X-100 in PBS at 4 °C for 5 min, washed three times as above, incubated with 10% normal goat serum (v/v) at room temperature for 30 min, and then incubated with rabbit anti-mTOR antibody (Cell Signaling CS2983, 1:100) and mouse anti-LAMP2 antibody (Abcam 25631, 1:400) at 4 °C overnight. The cells were washed six times with PBS, incubated with Alexa Fluor-conjugated secondary antibodies at room temperature for 1 h, washed as above, mounted in DAPI Fluoromount-G (Southern Biotech), and imaged. Three-channel fluorescence z stacks were taken at each time point of each experiment using a Deltavision pDV microscope with a 60×/1.42NA objective (Applied Precision). Acquisition settings were identical for all data sets to allow results from different time points and conditions to be compared quantitatively. The z stacks were deconvolved using the blind deconvolution algorithm of Autoquant X (Media Cybernetics). Individual cells were selected for analysis using the crop3D module of Imaris (Bitplane/Andor). Co-localization was evaluated quantitatively using the coloc module of Imaris to determine Mander's coefficient. Intensity thresholds were set automatically using the method of Costes et al. (32).
Statistical Analyses
The data were statistically analyzed using analysis of variance followed by Tukey's test to validate specific actions. Complete statistical information on experimental data shown in bar graphs or summarized in the text are available upon request.
Results
A mixture of amino acids at concentrations present in typical growth medium stimulates mTORC1 in variety of cells. To understand the significance of individual amino acids in this response, we added single amino acids to starved HeLa cells, a widely used human cell line, and assessed the phosphorylation of the direct mTORC1 substrates S6K1 (S6K) and ULK1 (3). We also measured phosphorylation of serines 240/244 on ribosomal subunit S6, which is phosphorylated in an mTORC1-dependent manner by S6K and thus indicates mTORC1 activity (33). As shown in Fig. 1, most individually applied amino acids had little effect on the phosphorylation of mTORC1 substrates S6K or ULK1 (Fig. 1). Only Leu and, to a lesser extent, Met increased phosphorylation of S6K, ULK1, and S6 (Fig. 1). Cystine promoted phosphorylation of S6K and S6 but not ULK1 (Fig. 1). These effects of individual amino acids were small compared with the effect of a combination of Ser and Leu (Fig. 1) or of a complete amino acid mixture (17) (confirmed in this study).
Because Leu had the greatest effect on mTORC1 activity among the individual amino acids, we further assessed the effects of combining Leu with different amino acids in starved HeLa cells. Several amino acids dramatically promoted phosphorylation of direct and indirect mTORC1 substrates when added to the medium prior to Leu (Fig. 2). In addition to Gln, which is well known for its ability to promote Leu-dependent mTORC1 activation (20, 28), we also found that Asn, Arg, Thr, Gly, Pro, Ser, Ala, and Glu potentiated Leu-induced phosphorylation. Because these amino acids did not promote mTORC1 activation by themselves, the data suggest that they do not activate mTORC1 directly but rather prime cells for subsequent activation of mTORC1 by Leu.
To further differentiate among the amino acids that either activate mTORC1 or prime for activation, we tested effects of each amino acid in cells that had been preincubated with the priming amino acid Ser. After Ser pretreatment, Leu still had the strongest activating effect on mTORC1, followed by Met, Ile, and Val (Fig. 3A). Similar results were obtained when cells were primed with Gln rather than Ser (Fig. 3B).
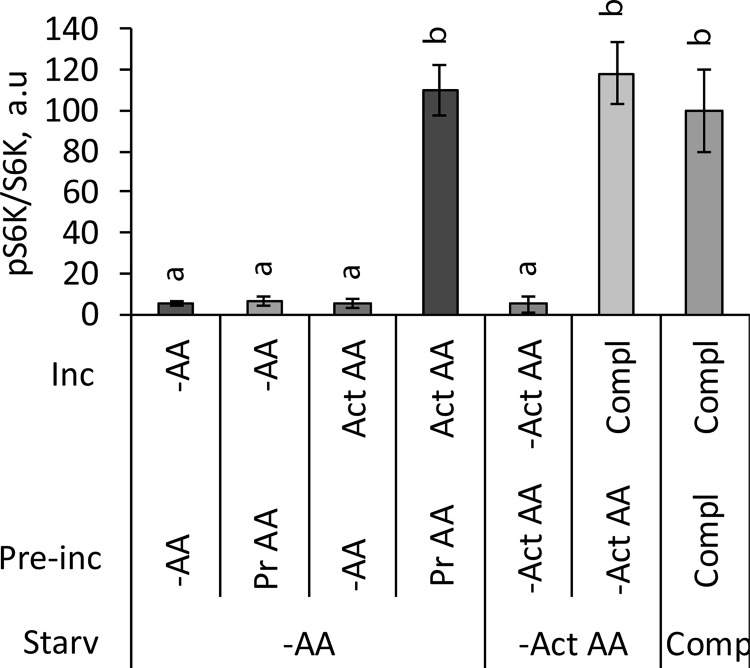
The data above identify a group of eight priming amino acids (Asn, Gln, Arg, Thr, Gly, Pro, Ser, Ala, and Glu) and a smaller group of activating amino acids (Leu, Met, Ile, and Val). We next tested whether the two-step priming-activation process mimics the well described starvation-recovery behavior of mTORC1 in the context of otherwise complete DMEM. The cells were first starved in amino acid-free DMEM, then incubated in DMEM that contained five priming amino acids (Gly, Arg, Gln, Ser, and Thr), and finally placed in DMEM that contained activating amino acids only (Leu, Met, Ile, and Val). As shown in Fig. 4, sequential exposure to priming amino acids followed by activating amino acids replicated the typical protocol of amino acid withdrawal and readdition. Neither the activating nor priming group by itself caused significant S6K phosphorylation, and restoration of all amino acids had no greater effect than the two-step procedure. Thus priming and activating amino acids are both necessary to sustain amino acid-dependent mTORC1 activity in cells and are in sequence sufficient for full mTORC1 activity.
FIGURE 4.
Priming and activating amino acids sustain mTORC1 activity in growth medium. HeLa cells were starved for 1 h in amino acid-free DMEM (−AA) or in DMEM that lacks the activating amino acids Leu, Met, Ile, and Val (−Act AA). The cells were then preincubated in −AA DMEM, −Act AA DMEM, or in the presence of the priming amino acids Gly, Arg, Gln, Ser, and Thr (Pr AA) for 20 min. The cells were washed to remove amino acids and incubated for 20 min in −AA DMEM; in DMEM containing only activating amino acids Leu, Met, Ile, and Val (Act AA); or in complete medium (Compl). Control cells were kept continuously in complete DMEM. The phosphorylation of S6K (Thr389) and total S6K were analyzed by immunoblotting. The means of pS6K/S6K are expressed as percentages compared with the control cells in complete medium. The data shown are averages of two independent experiments (n = 6) ± S.D. Means with different letters are significantly different (p < 0.05; Tukey's test).
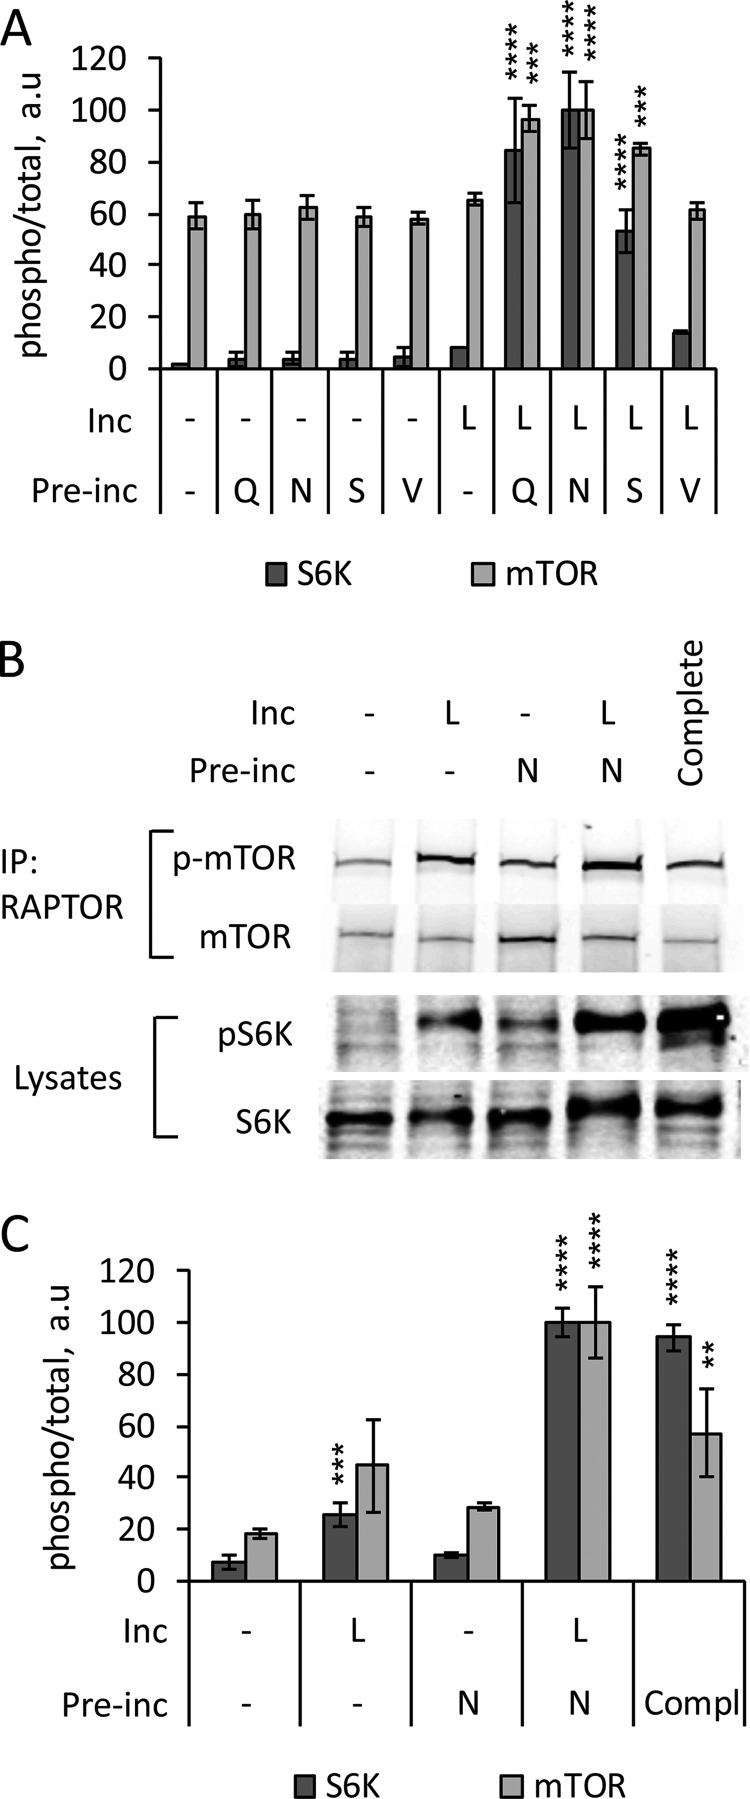
Phosphorylation of the several mTORC1 targets monitored here is generally used to establish phosphorylation and activation of mTOR specifically in the mTORC1 complex. To confirm that two-step mTORC1 activation by amino acids corresponds to mTOR phosphorylation at the key regulatory site Ser2448, we monitored phospho-mTOR accumulation directly after priming cells with Gln, Asn, or Ser and subsequent Leu activation. The two-step activation protocol increased total mTOR phosphorylation at Ser2448 roughly in parallel with phosphorylation of the mTORC1 target S6K, whereas neither Leu alone nor the priming amino acids had an effect (Fig. 5A). The incremental mTOR phosphorylation seen here is relatively small compared with basal phosphorylation, probably reflecting the presence of substantial phospho-mTOR either free or in mTORC2. To selectively quantify the effect of two-step priming and activation on phosphorylation of mTOR in the mTORC1 complex, we used anti-Raptor antibody to immunopurify the Raptor/mTORC1-associated portion of mTOR prior to measuring mTOR phosphorylation (Fig. 5, B and C). Priming with Asn followed by Leu activation promoted phosphorylation of mTORC1-bound mTOR compared with untreated cells or cells treated with either Asn or Leu alone (Fig. 5C). The phosphorylation of mTORC1 substrates following two-step activation by priming and activating amino acids thus corresponds to the phosphorylation of mTOR in the mTORC1 complex. Interestingly, the phosphorylation of Raptor-bound mTOR was lower in non-starved controls compared with cells treated with Asn followed by Leu. This behavior is consistent with the transient nature of mTORC1 activation suggested by the time course of S6K phosphorylation (Figs. 5C and 6B).
FIGURE 5.
Phosphorylation of mTOR during priming and activation of mTORC1 by amino acids. A, starved HeLa cells were preincubated in the absence (−) or presence of the indicated amino acids (Gln, Asn, Ser, or Val) for 20 min, washed to remove amino acids, and incubated for 20 min more in the presence (L) or absence (−) of Leu. The phosphorylation of S6K (Thr389) and mTOR (Ser2448) and total S6K and mTOR were analyzed by immunoblotting. The means of pS6K/S6K and p-mTOR/mTOR are expressed as percentages compared with cells preincubated with Asn followed by Leu. The data shown are averages of two independent experiments (n = 3) ± S.D. B and C, starved HeLa cells were preincubated in the absence (−) or presence (N) of Asn for 40 min, washed, and incubated for 20 min in the absence (−) or presence (L) of Leu. Alternatively, the cells were maintained in complete medium. mTORC1 was immunoprecipitated from whole cell lysates with anti-RAPTOR antibodies. B, the phosphorylation of mTOR (Ser2448) and total mTOR was analyzed by immunoblotting of the immunoprecipitates. The phosphorylation of S6K (Thr389) and total S6K was analyzed by immunoblotting of the cell lysates. C, the means of pS6K/S6K and p-mTOR/mTOR are expressed as percentages compared with cells preincubated with Asn followed by Leu. The data shown are averages of two independent experiments (n = 4) ± S.D. Asterisks denote values significantly different from cells treated in the absence of amino acids. *, p < 0.05; **, p < 0.01; ***, p < 0.001; ****, p < 0.0001 (Tukey's test).
FIGURE 6.
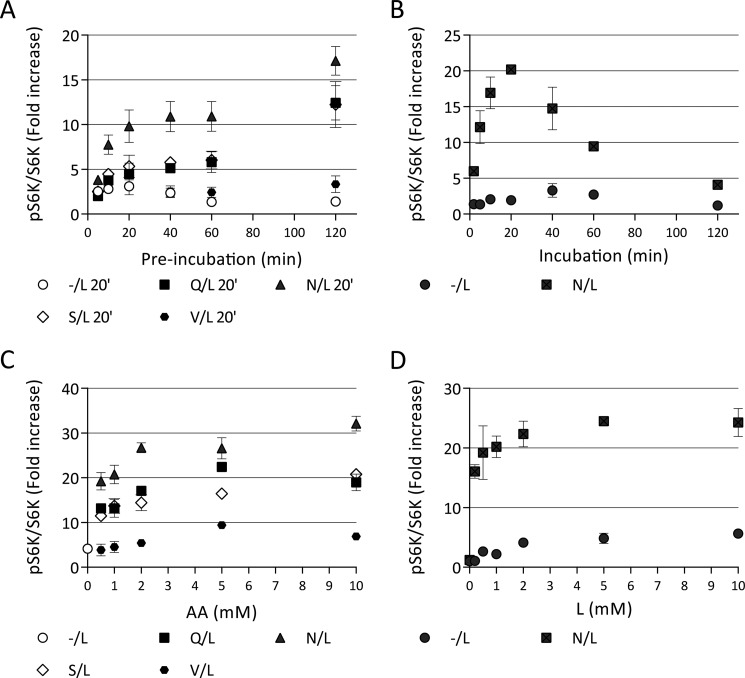
Concentration ranges and time courses of the two phases of mTORC1 activation by amino acids. HeLa cells were starved before treatments in KRBH for 1 h. A, cells were preincubated in the absence (−) or in the presence of 5 mm priming amino acids (Gln, Asn, Ser, or Val) for times indicated. The cells were washed to remove amino acids and incubated with 5 mm Leu (L) for 20 min. B, cells were preincubated in the absence of amino acids (−) or in the presence of 5 mm Asn for 30 min. The cells were washed to remove amino acids and incubated with 5 mm Leu for indicated lengths of time. C, cells were preincubated in the absence (−) or in the presence of indicated concentrations of Gln, Asn, Ser, or Val for 20 min. The cells were washed to remove amino acids and incubated with 5 mm Leu for another 20 min. D, cells were preincubated in the absence of amino acids (−) or in the presence of 5 mm Asn for 30 min. The cells were washed to remove amino acids and incubated with indicated concentrations of L for another 20 min. The phosphorylation of S6K (Thr389) and total S6K were analyzed by immunoblotting. The means of pS6K/S6K are expressed as fold increase compared with starved cells. The data shown are representative of two independent experiments performed in duplicate (B) or triplicate (A, C, and D). The data with error bars represent means ± S.D.
To better understand the basis of the two-step activation of mTORC1 by the different amino acids, we compared the requirements for duration of exposure and amino acid concentration for both the priming and activating phases. Priming by Gln, Asn, or Ser reached a maximum at ∼20 min and then remained stable for at least 2 h (Fig. 6A). Because the priming amino acids had little effect alone even after prolonged incubation (Figs. 1 and 6A), the failure of a single amino acid alone to activate mTORC1 is not merely the result of a slow response. After priming, activation of mTORC1 by Leu was clearly detectable at 2 min, reached maximum at ∼20-fold activation at ∼20 min, and then declined toward the baseline over 2 h (Fig. 6B). Without priming, activation by Leu alone was less than 3-fold at any time within 2 h and with no obvious time dependence. The kinetics of priming and activation are thus clearly different, with priming remaining essentially tonic and activation being transient and followed by desensitization.
Concentration dependence for priming and subsequent activation by Leu were somewhat different but were all in the physiological range. Depending on the amino acid, priming displayed an EC50 of ∼0.5 mm and reached a maximum by about 5 mm (Fig. 6C). Although the concentration of individual priming amino acids in DMEM is below saturation, DMEM contains eight priming amino acids and priming is probably maximal during growth. Leu was somewhat more potent during the activation step, with EC50 < 0.2 mm, and reaching a maximum by 2 mm (Fig. 6D). Thus mTORC1 priming and activation differ in their amino acid specificities, concentration dependences, and kinetics.
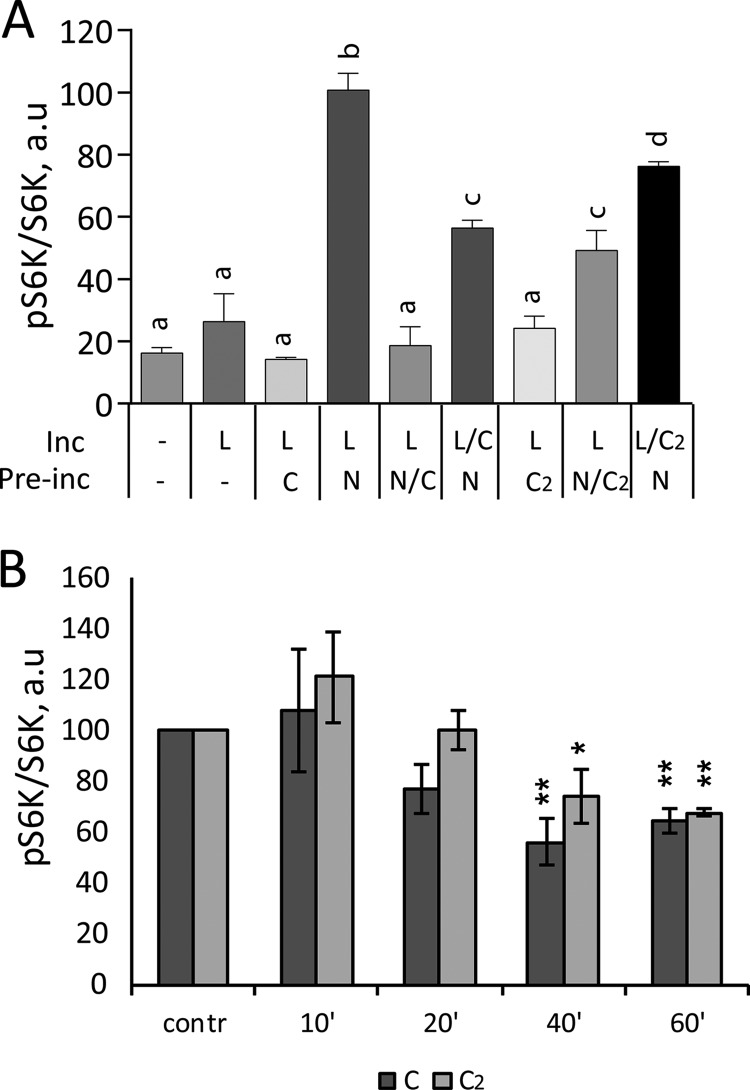
Antagonism by non-activating ligands is frequently observed in signaling pathways. During preliminary experiments, we found that a mixture of all 12 essential amino acids (EAAs) activated mTORC1 less effectively than a mixture of only Leu, Met, and Ile, suggesting that one or more of the EAA(s) antagonizes mTORC1 activation. We found that cystine, but not other EAAs in the mixture, inhibits mTORC1 activation by Leu after priming with Asn or Ala (Fig. 7). Cystine is a disulfide-linked dimer of Cys that is used in place of Cys in commercial growth media. It is quickly converted to Cys inside the cell (49). We therefore compared Cys and cystine for their effects on mTORC1 activation. Both Cys and cystine inhibited mTORC1 activation by Leu after priming with Asn (Fig. 7A). Inhibition was strongest, >80%, when Cys or cystine were applied during the priming phase. Inhibition was weaker when they were applied during the activation phase together with Leu (Fig. 7A), suggesting that their major effect was to block the priming process. To test whether Cys or cystine alters mTORC1 activity in non-starved cells, we added excess (5 mm) amino acids to cells in DMEM, which contains 0.1 mm cystine, complete with 10% serum. Both Cys and cystine inhibited mTORC1 activity in these cells within 20–40 min (Fig. 7B). Together, the data demonstrate that Cys and cystine prevent mTORC1 activation both by inhibiting amino acid-dependent priming in starved cells and by suppressing mTORC1 activity in the tonic presence of amino acids and growth factors. Such behavior is consistent with the persistence of priming (Fig. 6) and suggests that Cys may be important as a negative regulator of mTORC1 in cells growing under normal conditions.
FIGURE 7.
Cysteine and cystine inhibit priming step of mTORC1 activation by amino acids. A, HeLa cells were starved in KRBH for 1 h and then incubated in the absence (−) or in the presence of 1 mm Asn (N), Cys (C), l-cystine (C2), or combinations of N and C or of N and C2 for 15 min. The cells were washed with KRBH twice followed by incubation in the absence (−) or in the presence of 1 mm Leu (L), or combinations of L and C or of L and C2 for another 15 min. The phosphorylation of S6K (Thr389) and total S6K were analyzed by immunoblotting. The means of pS6K/S6K are expressed as percentages compared with cells preincubated with Asn followed by incubation with Leu. The data shown are averages of two independent experiments performed in duplicate (n = 4) ± S.D. Means with different letters are significantly different (p < 0.05; Tukey's test). B, HeLa cells in complete growth medium (DMEM supplemented with 10% FBS) were supplemented with 5 mm C or C2 for indicated lengths of time. The phosphorylation of S6K (Thr389) and total S6K were analyzed by immunoblotting. The means of pS6K/S6K are expressed as percentages compared with their respective no supplement controls. The data shown are averages of two independent experiments (n = 4) ± S.D. Asterisks denote values significantly different from no treatment controls. *, p < 0.05; **, p < 0.01; ***, p < 0.001; ****, p < 0.0001 (Tukey's test).
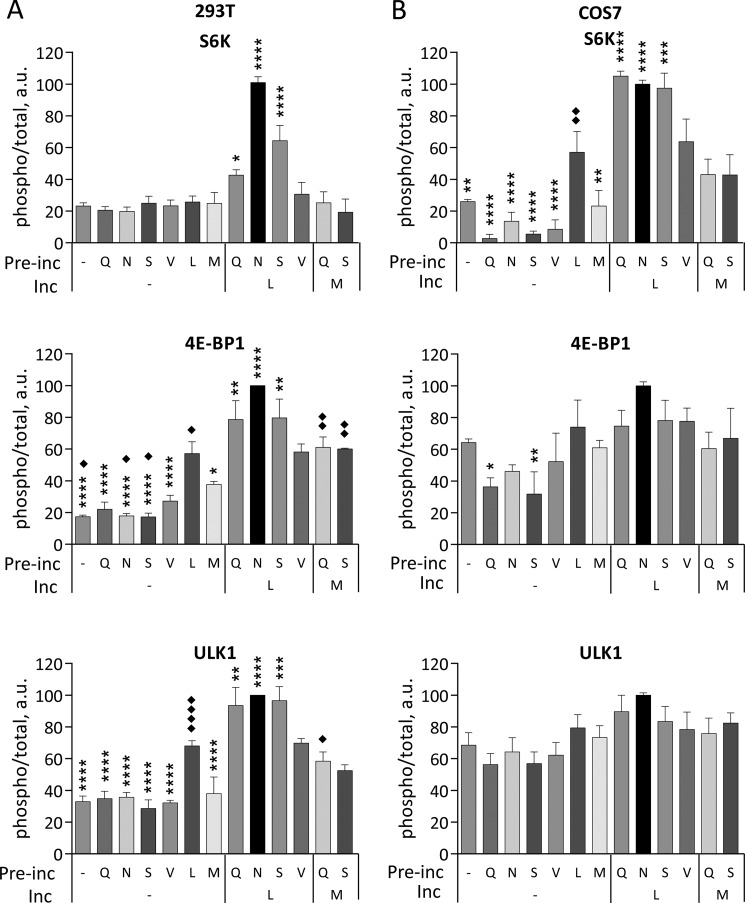
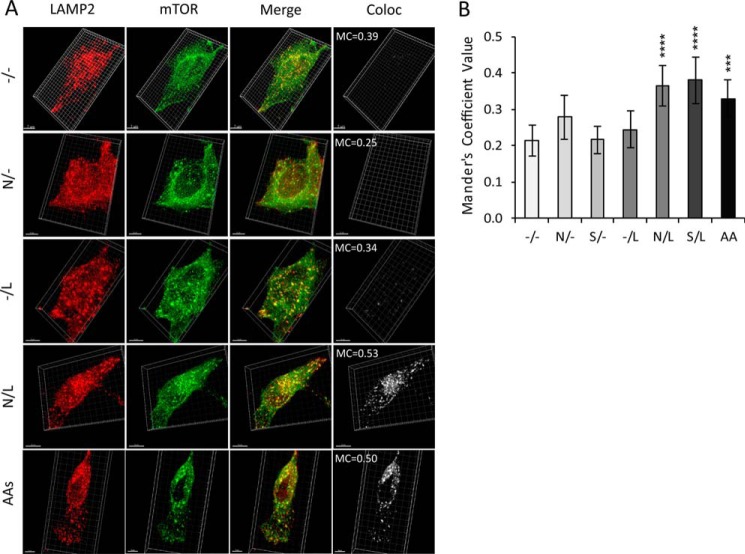
To test whether a two-step, priming-activation process is generally required for mTORC1 activation by amino acids, we measured this response in HEK293T and COS7 cells, two other widely used cell lines. In addition to S6K and ULK1 phosphorylation, we also measured phosphorylation of 4E-BP1, an additional direct mTORC1 substrate that is easily detectable in these cells. In general, the priming effect was clear in both HEK293T and COS7 cells, although it varied quantitatively with cell type and with mTORC1 substrate (Fig. 8). Relative activities of the priming amino acids were similar to those observed in HeLa cells, suggesting that a single priming mechanism is conserved. Responses of the 293T cells to priming and activating amino acids were similar to what was observed in HeLa cells (Fig. 8). Phosphorylation of ULK1 generally paralleled that of 4E-BP1, and relative phosphorylation was greater for S6K. The effect of priming in COS7 cells was smaller, particularly as reported by phosphorylation of 4E-BP1 and ULK1. This difference primarily reflected an increased effect of Leu by itself. Relative effectiveness of Leu and the priming amino acids were similar in COS7, however, suggesting that the same two processes are in place but that COS7 cells have a higher basal level of priming for stimulation by Leu (Fig. 8). In addition to HeLa, COS7 and HEK293T cells, we also found that Ala and Ser prime both MIN6 insulinoma cells and several lines of mouse embryo fibroblasts for activation of mTORC1 in response to Leu. Amino acids use the Rag GTPases to recruit mTORC1 to lysosomal membranes where it can be activated by the Rheb GTPase. The lysosomal surface thus serves as a platform that coordinates inputs from amino acids and growth factors for mTORC1 activation (12, 34). To assess whether amino acid priming or subsequent activation by Leu involves the lysosomal localization of mTORC1, we measured mTOR recruitment to lysosomes in response both to the priming amino acids and to Leu before or after priming. The cells were treated with Asn, Ser, or Leu alone or with Leu after priming with Asn or Ser as described above. They were then fixed for immunofluorescent localization of mTOR and the lysosome marker LAMP2 (Fig. 9). Differential co-localization of mTOR and LAMP2 was evaluated using Mander's coefficient, the fraction of mTOR-positive image voxels that also contain LAMP2 (32). This value indicates the fraction of mTOR that is associated with lysosomes. Because lysosomes themselves move and change shape during mTORC1 activation (35), this method indicates total, morphology-independent lysosomal localization of mTOR. As shown in Fig. 9A, mTOR localized to lysosomal membranes in cells treated with total amino acids compared with untreated cells. Quantitation of such images (Fig. 9B) indicates that none of the three amino acids alone drives mTOR translocation to lysosomes, but that priming with either Asn or Ser followed by Leu activation is as efficient as exposure to the amino acid mixture. Thus priming and subsequent activation are both required to localize mTORC1 to lysosomal surface and to promote mTOR phosphorylation and its consequent activation.
FIGURE 8.
Amino acids Gln, Asn, and Ser but not Val prime 293T and COS7 cells for mTORC1 activation by Leu or Met. Starved 293T (A) or COS7 (B) cells were incubated in the absence (−) or in the presence of indicated amino acids (Gln, Asn, Ser, or Val) for 20 min followed by incubation in the absence (−) or in the presence of Leu or Met for another 20 min. The phosphorylation of S6K (Thr389), 4E-BP1 (Thr37/46), ULK1 (Ser757), and total S6K, 4E-BP1, and ULK1 were analyzed by immunoblotting. The means of pS6K/S6K, p4E-BP1/4E-BP1, and pULK1/ULK1 are expressed as percentages compared with cells preincubated with Asn followed by Leu. The data shown are averages of two independent experiments (n = 3) ± S.D. Asterisks denote values significantly different from cells treated with Leu alone. *, p < 0.05; **, p < 0.01; ***, p < 0.001; ****, p < 0.0001 (Tukey's test). Diamonds denote values significantly different from cells treated with Mets alone. ♦, p < 0.05; ♦♦, p < 0.01; ♦♦♦, p < 0.001; ♦♦♦♦, p < 0.0001 (Tukey's test).
FIGURE 9.
Priming amino acids and Leu are required to localize mTOR to lysosomes. Starved HeLa cells were preincubated in the absence (−) or in the presence (+) of 5 mm Asn or Ser for 30 min followed by incubation for 20 min in the absence or in the presence of 5 mm Leu. Alternatively, the cells were supplemented for 30 min with complete amino acids at concentrations present in growth media (AAs). A, representative images of cells treated in the absence of amino acids or in the presence of Asn, Leu, or Asn followed by Leu or AAs. The cells were fixed, stained for LAMP2 and mTOR, and imaged as described under “Experimental Procedures.” The images are maximum intensity projections of 16 z slices. Shown are LAMP2 (red), mTOR (green), merge (LAMP2 and mTOR), and the co-localization (Coloc) channel showing voxels where LAMP2 and mTOR co-localization was indicated by Mander's coefficient (MC). Not shown are images of cells treated with Ser (similar to cells treated with Asn) and Ser followed by Leu (similar to Asn followed by Leu). B, quantification of mTOR and LAMP2 co-localization using thresholded Mander's coefficients, i.e. the number of voxels with above-threshold fluorescence in both channels (mTOR and LAMP2) divided by the number of voxels with above-threshold fluorescence for mTOR. The data shown are averages of two independent experiments (24–30 cells each) ± S.D.
Amino acid-dependent recruitment of mTORC1 to lysosomes is necessary but not sufficient for its activation (17, 34). Activation of mTORC1 also requires dissociation of the mTORC1 inhibitor TSC from lysosomes, which is promoted by activation of phosphatidylinositol 3-kinase type I pathways in response to insulin and other growth factors. Growth factors and amino acids thus combine to drive mTORC1 activation at the lysosomal surface (17, 34). To determine whether mTORC1 regulation by priming or activating amino acids shares mechanism(s) with the growth factors, we exposed serum-deprived and amino acid-starved HeLa cells to combinations of these stimuli and then quantitated S6K phosphorylation as a measure of mTORC1 activation. We first assessed the effect of Ala, a priming amino acid, and Leu on insulin-induced phosphorylation of S6K in HeLa cells. Insulin alone or in combination with Ala was insufficient to promote S6K phosphorylation in serum-starved cells (Fig. 10, A and B), but either insulin or Ala primed the cells for mTORC1 activation by Leu (Fig. 10, A and B). Priming by Ala plus insulin was more effective compared with that by insulin or Ala alone (Fig. 10, A and B). These data suggest that Ala and insulin prime cells for mTORC1 activation by Leu through independent mechanisms, but simple additivity of priming by insulin and amino acids is not conclusive from these experiments. To determine whether insulin-driven dissociation of TSC is independently involved in the priming process, we used MEFs derived from TSC2−/− (p53−/−) knock-out mice to eliminate any effect of TSC on priming (31, 36). In both control (TSC2+/+ (p53−/−)) and knock-out (TSC2−/− (p53−/−)) MEFs, mTORC1 was stimulated by Leu after priming with Ala (Fig. 10, C and D). As noted previously (34), the control MEFs also required insulin for maximal mTORC1 stimulation because of the inhibitory action of TSC2, whereas insulin was not required in the TSC2−/− MEFs because blocking TSC2 inhibition is unnecessary (15, 16). In the TSC2−/− MEFs, the priming step remained critical for maximal activation by Leu with or without insulin, and the Ala/Leu sequence activated mTORC1, as well as in HeLa cells (Fig. 10, C and D). The two-step activation of TORC1 by priming and activating amino acids is thus independent of the growth factor/TSC pathway.
Discussion
The results reported here support a two-step mechanism for the activation of mTORC1 by amino acids, in which sensitization by priming amino acids is required for subsequent activation by activating amino acids. Priming and activating amino acids use distinct signaling mechanisms and fall into two essentially non-overlapping groups. The concerted events of priming and activation bypass TSC and growth factor pathways and are required both for phosphorylation of mTOR at Ser2448 and for lysosomal localization of mTORC1.
Soon after the discovery of amino acid signaling to mTORC1, it became evident that a mixture of amino acids at concentrations typically present in growth medium effectively activates mTORC1, but individual amino acids do not (29). Effects of omitting single amino acids from the medium indicated the involvement of Leu, Ile, and Arg (23, 28, 29, 34, 37, 38), but using amino acid mixtures masked both redundancy among amino acids with similar activities and distinct signaling effects of particular amino acids. It also became apparent that different amino acids promote mTORC1 activation by different mechanisms, and multiple mechanisms have been proposed (20, 22, 23, 26–28, 38).
To identify independent stimulatory paths from amino acids to mTORC1, we used paired combinations of amino acids delivered sequentially to pinpoint their roles in mTORC1 activation. Our data demonstrate an obligate two-step activation process. First, one or more hydrophilic amino acids (Asn, Gln, Thr, Arg, Gly, Pro, Ser, Ala, and Glu) sensitize or prime cells for mTORC1 stimulation. After priming, a hydrophobic activating amino acid (Leu, Met, Ile, and Val) promotes mTORC1 activation through mTOR phosphorylation. The priming amino acids cause little if any mTORC1 activation by themselves, and in most cells tested, the activating amino acids are highly dependent on initial priming for their stimulatory activity. Thus, although the priming and activation reactions presumably take place concurrently in cells grown in amino acid-replete medium or in vivo, the two-step protocol used here demonstrates their independent importance.
Many of these amino acids have been previously implicated in mTORC1 signaling. Leu, Arg, and Gln regulate mTORC1 activity in many cell types (29, 39, 40). Synthesis of another priming amino acid, Ser, is up-regulated in cancer cells to sustain high mTORC1 activity (41). It is perhaps due to the absence of Asn and some other priming amino acids from typical growth medium that their role in mTORC1 activation has been largely overlooked.
In agreement with results for amino acid mixtures, we found that Ala does not require the TSC pathway for the priming stage of mTORC1 activation (17). This is in contrast to a recent report by Carroll et al. (37) that Arg, another priming amino acid, promotes the dissociation of TSC from lysosomes, although these authors starved cells for Arg in the presence of all the other amino acids, which would cloud the result. Furthermore, we found that the priming amino acids and insulin do not substitute for each other but rather have additive effects on subsequent mTORC1 activation by Leu. Our data thus suggest a new signaling axis from priming amino acids to mTORC1 in addition to the recognized pathways from growth factors through PI3K-TSC and from Leu through RAGs. We do not yet know the mechanism of priming, but it may involve modification of mTORC1 subunits or their interactions, similar to what has been shown for mitogens (8, 9). Priming amino acids may also aid in Leu uptake from the medium, as demonstrated for Gln (20), although the prolonged time course of the primed state (2 h; Fig. 6) is somewhat hard to reconcile with such a mechanism.
Distinct amino acid selectivities, time courses, and concentration dependences, as well as selective inhibition of priming by Cys, argue that priming and activation act through distinct pathways. Sestrins 1 and 2 are candidate sensors for the activating amino acids. They preferentially bind Leu but not the priming amino acids, and their biochemical actions are consistent with this role (26, 27). In contrast, priming amino acids Arg and Gln are sensed by the recently identified lysosomal membrane amino acid transporter SLC38A9 (22, 23). SLC38A9 deficiency abolishes mTORC1 stimulation by Arg but not Leu. SLC38A9 deficiency does not obstruct mTORC1 binding to lysosomes (22, 42), in agreement with our observation that priming amino acids do not promote mTORC1 binding to lysosomes (Fig. 9). The Gln transporter SLC1A5 in the plasma membrane is another candidate sensor for priming amino acids. Its activity is in some cells required for Gln to promote mTORC1 activation by Leu (20), possibly by supplying cytoplasmic Gln for Gln/Leu antiport (20, 43).
Perhaps most intriguing was the finding that Cys has a unique function among the l-amino acids by inhibiting the amino acid priming step in mTORC1 activation. Cys inhibits cellular mTORC1 activity in the presence of amino acids and growth factors. Hyperactive mTORC1 is strongly linked to cancer, as well as aging and diabetes, and is therefore a target for drug development (44, 45). Findings that higher levels of Cys in blood are associated with lower risk of different cancers encourage further studies of the mTORC1 inhibitory and anti-cancer properties of Cys for drug development (46–48).
Author Contributions
J. D. and E. M. R. conceived the project, analyzed the data, and wrote the manuscript. J. D. planned and performed the experiments. E. N. I. performed immunoblotting experiments. S. E. performed the immunofluorescence microscopy. M. H. C. advised throughout the project and helped write the manuscript. All authors approved the final version of the manuscript.
Acknowledgments
We thank Alexandra Muñiz and Irina Gradinaru for outstanding technical assistance.
This work was supported by Cancer Prevention and Research Institute of Texas Grant RP120695 and National Institutes of Health Grants R01GM30355 and R01DK34128. The authors declare that they have no conflicts of interest with the contents of this article. The content is solely the responsibility of the authors and does not necessarily represent the official views of the National Institutes of Health.
- mTORC1
- mammalian target of rapamycin complex 1
- S6K
- p70 ribosomal protein S6 kinase
- 4E-BP1
- factor 4E-binding protein
- ULK1
- uncoordinated 51-like kinase
- TSC
- tuberous sclerosis complex
- PI3K
- phosphatidylinositol 3-kinase type I
- MEF
- mouse embryonic fibroblast
- KRBH
- Krebs-Ringer's solution
- EAA
- essential amino acid.
References
- 1. Ma X. M., Yoon S.-O., Richardson C. J., Jülich K., and Blenis J. (2008) SKAR links pre-mRNA splicing to mTOR/S6K1-mediated enhanced translation efficiency of spliced mRNAs. Cell 133, 303–313 [DOI] [PubMed] [Google Scholar]
- 2. Gingras A. C., Raught B., and Sonenberg N. (2004) mTOR signaling to translation. Curr. Top. Microbiol. Immunol. 279, 169–197 [DOI] [PubMed] [Google Scholar]
- 3. Kim J., Kundu M., Viollet B., and Guan K.-L. (2011) AMPK and mTOR regulate autophagy through direct phosphorylation of Ulk1. Nat. Cell Biol. 13, 132–141 [DOI] [PMC free article] [PubMed] [Google Scholar]
- 4. Guertin D. A., and Sabatini D. M. (2007) Defining the role of mTOR in cancer. Cancer Cell 12, 9–22 [DOI] [PubMed] [Google Scholar]
- 5. Duan S., Skaar J. R., Kuchay S., Toschi A., Kanarek N., Ben-Neriah Y., and Pagano M. (2011) mTOR generates an auto-amplification loop by triggering the βTrCP- and CK1α-dependent degradation of DEPTOR. Mol. Cell 44, 317–324 [DOI] [PMC free article] [PubMed] [Google Scholar]
- 6. Gao D., Inuzuka H., Tan M.-K., Fukushima H., Locasale J. W., Liu P., Wan L., Zhai B., Chin Y. R., Shaik S., Lyssiotis C. A., Gygi S. P., Toker A., Cantley L. C., Asara J. M., Harper J. W., and Wei W. (2011) mTOR drives its own activation via SCF(βTrCP)-dependent degradation of the mTOR inhibitor DEPTOR. Mol. Cell 44, 290–303 [DOI] [PMC free article] [PubMed] [Google Scholar]
- 7. Peterson T. R., Laplante M., Thoreen C. C., Sancak Y., Kang S. A., Kuehl W. M., Gray N. S., and Sabatini D. M. (2009) DEPTOR is an mTOR inhibitor frequently overexpressed in multiple myeloma cells and required for their survival. Cell 137, 873–886 [DOI] [PMC free article] [PubMed] [Google Scholar]
- 8. Yoon M.-S., Rosenberger C. L., Wu C., Truong N., Sweedler J. V., and Chen J. (2015) Rapid mitogenic regulation of the mTORC1 inhibitor, DEPTOR, by phosphatidic acid. Mol. Cell 58, 549–556 [DOI] [PMC free article] [PubMed] [Google Scholar]
- 9. Carrière A., Cargnello M., Julien L.-A, Gao H., Bonneil E., Thibault P., and Roux P. P. (2008) Oncogenic MAPK signaling stimulates mTORC1 activity by promoting RSK-mediated raptor phosphorylation. Curr. Biol. 18, 1269–1277 [DOI] [PubMed] [Google Scholar]
- 10. Pearce L. R., Komander D., and Alessi D. R. (2010) The nuts and bolts of AGC protein kinases. Nat. Rev. Mol. Cell Biol. 11, 9–22 [DOI] [PubMed] [Google Scholar]
- 11. Long X., Lin Y., Ortiz-Vega S., Yonezawa K., and Avruch J. (2005) Rheb binds and regulates the mTOR kinase. Curr. Biol. 15, 702–713 [DOI] [PubMed] [Google Scholar]
- 12. Sancak Y., Peterson T. R., Shaul Y. D., Lindquist R. A., Thoreen C. C., Bar-Peled L., and Sabatini D. M. (2008) The Rag GTPases bind raptor and mediate amino acid signaling to mTORC1. Science 320, 1496–1501 [DOI] [PMC free article] [PubMed] [Google Scholar]
- 13. Inoki K., Li Y., Xu T., and Guan K. L. (2003) Rheb GTPase is a direct target of TSC2 GAP activity and regulates mTOR signaling. Genes Dev. 17, 1829–1834 [DOI] [PMC free article] [PubMed] [Google Scholar]
- 14. Dibble C. C., and Manning B. D. (2013) Signal integration by mTORC1 coordinates nutrient input with biosynthetic output. Nat. Cell Biol. 15, 555–564 [DOI] [PMC free article] [PubMed] [Google Scholar]
- 15. Inoki K., and Huber T. B. (2012) Mammalian target of rapamycin signaling in the podocyte. Curr. Opin. Nephrol. Hypertens. 21, 251–257 [DOI] [PubMed] [Google Scholar]
- 16. Manning B. D., Tee A. R., Logsdon M. N., Blenis J., and Cantley L. C. (2002) Identification of the tuberous sclerosis complex-2 tumor suppressor gene product tuberin as a target of the phosphoinositide 3-kinase/akt pathway. Mol. Cell 10, 151–162 [DOI] [PubMed] [Google Scholar]
- 17. Menon S., Dibble C. C., Talbott G., Hoxhaj G., Valvezan A. J., Takahashi H., Cantley L. C., and Manning B. D. (2014) Spatial control of the TSC complex integrates insulin and nutrient regulation of mTORC1 at the lysosome. Cell 156, 771–785 [DOI] [PMC free article] [PubMed] [Google Scholar]
- 18. Bar-Peled L., Chantranupong L., Cherniack A. D., Chen W. W., Ottina K. A., Grabiner B. C., Spear E. D., Carter S. L., Meyerson M., and Sabatini D. M. (2013) A tumor suppressor complex with GAP activity for the Rag GTPases that signal amino acid sufficiency to mTORC1. Science 340, 1100–1106 [DOI] [PMC free article] [PubMed] [Google Scholar]
- 19. Kim J. S., Ro S.-H., Kim M., Park H.-W., Semple I. A., Park H., Cho U.-S., Wang W., Guan K.-L., Karin M., and Lee J. H. (2015) Sestrin2 inhibits mTORC1 through modulation of GATOR complexes. Sci. Rep. 5, 9502. [DOI] [PMC free article] [PubMed] [Google Scholar]
- 20. Nicklin P., Bergman P., Zhang B., Triantafellow E., Wang H., Nyfeler B., Yang H., Hild M., Kung C., Wilson C., Myer V. E., MacKeigan J. P., Porter J. A., Wang Y. K., Cantley L. C., et al. (2009) Bidirectional transport of amino acids regulates mTOR and autophagy. Cell 136, 521–534 [DOI] [PMC free article] [PubMed] [Google Scholar]
- 21. Peng M., Yin N., and Li M. O. (2014) Sestrins function as guanine nucleotide dissociation inhibitors for Rag GTPases to control mTORC1 signaling. Cell 159, 122–133 [DOI] [PMC free article] [PubMed] [Google Scholar]
- 22. Rebsamen M., Pochini L., Stasyk T., de Araújo M. E., Galluccio M., Kandasamy R. K., Snijder B., Fauster A., Rudashevskaya E. L., Bruckner M., Scorzoni S., Filipek P. A., Huber K. V., Bigenzahn J. W., Heinz L. X., et al. (2015) SLC38A9 is a component of the lysosomal amino acid sensing machinery that controls mTORC1. Nature 519, 477–481 [DOI] [PMC free article] [PubMed] [Google Scholar]
- 23. Wang S., Tsun Z.-Y., Wolfson R. L., Shen K., Wyant G. A., Plovanich M. E., Yuan E. D., Jones T. D., Chantranupong L., Comb W., Wang T., Bar-Peled L., Zoncu R., Straub C., Kim C., et al. (2015) Metabolism. Lysosomal amino acid transporter SLC38A9 signals arginine sufficiency to mTORC1. Science 347, 188–194 [DOI] [PMC free article] [PubMed] [Google Scholar]
- 24. Wauson E. M., Zaganjor E., Lee A. Y., Guerra M. L., Ghosh A. B., Bookout A. L., Chambers C. P., Jivan A., McGlynn K., Hutchison M. R., Deberardinis R. J., and Cobb M. H. (2012) The G protein-coupled taste receptor T1R1/T1R3 regulates mTORC1 and autophagy. Mol. Cell 47, 851–862 [DOI] [PMC free article] [PubMed] [Google Scholar]
- 25. Zoncu R., Bar-Peled L., Efeyan A., Wang S., Sancak Y., and Sabatini D. M. (2011) mTORC1 senses lysosomal amino acids through an inside-out mechanism that requires the vacuolar H+-ATPase. Science 334, 678–683 [DOI] [PMC free article] [PubMed] [Google Scholar]
- 26. Wolfson R. L., Chantranupong L., Saxton R. A., Shen K., Scaria S. M., Cantor J. R., and Sabatini D. M. (2016) Sestrin2 is a leucine sensor for the mTORC1 pathway. Science 351, 43–48 [DOI] [PMC free article] [PubMed] [Google Scholar]
- 27. Jewell J. L., Kim Y. C., Russell R. C., Yu F.-X., Park H. W., Plouffe S. W., Tagliabracci V. S., and Guan K.-L. (2015) Metabolism: differential regulation of mTORC1 by leucine and glutamine. Science 347, 194–198 [DOI] [PMC free article] [PubMed] [Google Scholar]
- 28. Durán R. V., Oppliger W., Robitaille A. M., Heiserich L., Skendaj R., Gottlieb E., and Hall M. N. (2012) Glutaminolysis activates Rag-mTORC1 signaling. Mol. Cell 47, 349–358 [DOI] [PubMed] [Google Scholar]
- 29. Hara K., Yonezawa K., Weng Q. P., Kozlowski M. T., Belham C., and Avruch J. (1998) Amino acid sufficiency and mTOR regulate p70 S6 kinase and eIF-4E BP1 through a common effector mechanism. J. Biol. Chem. 273, 14484–14494 [DOI] [PubMed] [Google Scholar]
- 30. Thomas J. D., Zhang Y.-J., Wei Y.-H., Cho J.-H., Morris L. E., Wang H.-Y., and Zheng X. F. (2014) Rab1A is an mTORC1 activator and a colorectal oncogene. Cancer Cell 26, 754–769 [DOI] [PMC free article] [PubMed] [Google Scholar]
- 31. Brugarolas J. B., Vazquez F., Reddy A., Sellers W. R., and Kaelin W. G. Jr. (2003) TSC2 regulates VEGF through mTOR-dependent and -independent pathways. Cancer Cell 4, 147–158 [DOI] [PubMed] [Google Scholar]
- 32. Costes S. V., Daelemans D., Cho E. H., Dobbin Z., Pavlakis G., and Lockett S. (2004) Automatic and quantitative measurement of protein-protein colocalization in live cells. Biophys. J. 86, 3993–4003 [DOI] [PMC free article] [PubMed] [Google Scholar]
- 33. Roux P. P., Shahbazian D., Vu H., Holz M. K., Cohen M. S., Taunton J., Sonenberg N., and Blenis J. (2007) RAS/ERK signaling promotes site-specific ribosomal protein S6 phosphorylation via RSK and stimulates cap-dependent translation. J. Biol. Chem. 282, 14056–14064 [DOI] [PMC free article] [PubMed] [Google Scholar]
- 34. Sancak Y., Bar-Peled L., Zoncu R., Markhard A. L., Nada S., and Sabatini D. M. (2010) Ragulator-Rag complex targets mTORC1 to the lysosomal surface and is necessary for its activation by amino acids. Cell 141, 290–303 [DOI] [PMC free article] [PubMed] [Google Scholar]
- 35. Korolchuk V. I., Saiki S., Lichtenberg M., Siddiqi F. H., Roberts E. A., Imarisio S., Jahreiss L., Sarkar S., Futter M., Menzies F. M., O'Kane C. J., Deretic V., and Rubinsztein D. C. (2011) Lysosomal positioning coordinates cellular nutrient responses. Nat. Cell Biol. 13, 453–460 [DOI] [PMC free article] [PubMed] [Google Scholar]
- 36. Onda H., Lueck A., Marks P. W., Warren H. B., and Kwiatkowski D. J. (1999) Tsc2+/− mice develop tumors in multiple sites that express gelsolin and are influenced by genetic background. J. Clin. Invest. 104, 687–695 [DOI] [PMC free article] [PubMed] [Google Scholar]
- 37. Carroll B., Maetzel D., Maddocks O. D., Otten G., Ratcliff M., Smith G. R., Dunlop E. A., Passos J. F., Davies O. R., Jaenisch R., Tee A. R., Sarkar S., and Korolchuk V. I. (2016) Control of TSC2-Rheb signaling axis by arginine regulates mTORC1 activity. eLife 5, e11058. [DOI] [PMC free article] [PubMed] [Google Scholar]
- 38. Han J. M., Jeong S. J., Park M. C., Kim G., Kwon N. H., Kim H. K., Ha S. H., Ryu S. H., and Kim S. (2012) Leucyl-tRNA synthetase is an intracellular leucine sensor for the mTORC1-signaling pathway. Cell 149, 410–424 [DOI] [PubMed] [Google Scholar]
- 39. Ban H., Shigemitsu K., Yamatsuji T., Haisa M., Nakajo T., Takaoka M., Nobuhisa T., Gunduz M., Tanaka N., and Naomoto Y. (2004) Arginine and Leucine regulate p70 S6 kinase and 4E-BP1 in intestinal epithelial cells. Int. J. Mol. Med. 13, 537–543 [PubMed] [Google Scholar]
- 40. Yao K., Yin Y.-L., Chu W., Liu Z., Deng D., Li T., Huang R., Zhang J., Tan B., Wang W., and Wu G. (2008) Dietary arginine supplementation increases mTOR signaling activity in skeletal muscle of neonatal pigs. J. Nutr. 138, 867–872 [DOI] [PubMed] [Google Scholar]
- 41. Ye J., Mancuso A., Tong X., Ward P. S., Fan J., Rabinowitz J. D., and Thompson C. B. (2012) Pyruvate kinase M2 promotes de novo serine synthesis to sustain mTORC1 activity and cell proliferation. Proc. Natl. Acad. Sci. U.S.A. 109, 6904–6909 [DOI] [PMC free article] [PubMed] [Google Scholar]
- 42. Jung J., Genau H. M., and Behrends C. (2015) Amino acid-dependent mTORC1 regulation by the lysosomal membrane protein SLC38A9. Mol. Cell Biol. 35, 2479–2494 [DOI] [PMC free article] [PubMed] [Google Scholar]
- 43. Milkereit R., Persaud A., Vanoaica L., Guetg A., Verrey F., and Rotin D. (2015) LAPTM4b recruits the LAT1–4F2hc Leu transporter to lysosomes and promotes mTORC1 activation. Nat. Commun. 6, 7250. [DOI] [PMC free article] [PubMed] [Google Scholar]
- 44. Laplante M., and Sabatini D. M. (2012) mTOR signaling in growth control and disease. Cell 149, 274–293 [DOI] [PMC free article] [PubMed] [Google Scholar]
- 45. Perl A. (2015) mTOR activation is a biomarker and a central pathway to autoimmune disorders, cancer, obesity, and aging. Ann. N.Y. Acad. Sci. 1346, 33–44 [DOI] [PMC free article] [PubMed] [Google Scholar]
- 46. Al-Awadi F., Yang M., Tan Y., Han Q., Li S., and Hoffman R. M. (2008) Human tumor growth in nude mice is associated with decreased plasma cysteine and homocysteine. Anticancer Res. 28, 2541–2544 [PubMed] [Google Scholar]
- 47. Lin J., Lee I. M., Song Y., Cook N. R., Selhub J., Manson J. E., Buring J. E., and Zhang S. M. (2010) Plasma homocysteine and cysteine and risk of breast cancer in women. Cancer Res. 70, 2397–2405 [DOI] [PMC free article] [PubMed] [Google Scholar]
- 48. Murphy G., Fan J.-H., Mark S. D., Dawsey S. M., Selhub J., Wang J., Taylor P. R., Qiao Y.-L., and Abnet C. C. (2011) Prospective study of serum cysteine levels and oesophageal and gastric cancers in China. Gut 60, 618–623 [DOI] [PMC free article] [PubMed] [Google Scholar]
- 49. Ishii T., Bannai S., and Sugita Y. (1981) Mechanism of growth stimulation of L1210 cells by 2-mercaptoethanol in vitro. Role of the mixed disulfide of 2-mercaptoethanol and cysteine. J. Biol. Chem. 256, 12387–12392 [PubMed] [Google Scholar]


