

Abstract
Type 1 diabetes is an autoimmune disorder that is characterized by a failure of the unfolded protein response in islet β cells with subsequent endoplasmic reticulum stress and cellular death. Thiazolidinediones are insulin sensitizers that activate the nuclear receptor PPAR-γ and have been shown to partially ameliorate autoimmune type 1 diabetes in humans and non-obese diabetic (NOD) mice. We hypothesized that thiazolidinediones reduce β cell stress and death independently of insulin sensitivity. To test this hypothesis, female NOD mice were administered pioglitazone during the pre-diabetic phase and assessed for insulin sensitivity and β cell function relative to controls. Pioglitazone-treated mice showed identical weight gain, body fat distribution, and insulin sensitivity compared with controls. However, treated mice showed significantly improved glucose tolerance with enhanced serum insulin levels, reduced β cell death, and increased β cell mass. The effect of pioglitazone was independent of actions on T cells, as pancreatic lymph node T cell populations were unaltered and T cell proliferation was unaffected by pioglitazone. Isolated islets of treated mice showed a more robust unfolded protein response, with increases in Bip and ATF4 and reductions in spliced Xbp1 mRNA. The effect of pioglitazone appears to be a direct action on β cells, as islets from mice treated with pioglitazone showed reductions in PPAR-γ (Ser-273) phosphorylation. Our results demonstrate that PPAR-γ activation directly improves β cell function and survival in NOD mice by enhancing the unfolded protein response and suggest that blockade of PPAR-γ (Ser-273) phosphorylation may prevent type 1 diabetes.
Keywords: autoimmunity, beta cell (B-cell), diabetes, endoplasmic reticulum stress (ER stress), insulin, peroxisome proliferator-activated receptor (PPAR), unfolded protein response (UPR)
Introduction
Type 1 diabetes (T1D)2 is characterized by the loss of insulin production, as β cells succumb to targeted autoimmunity. The non-obese diabetic (NOD) mouse spontaneously develops T1D and is used as a model that closely mimics human disease (1). In this animal model insulitis (infiltration of the islet by cells of the immune system) is observed as early as 4 weeks of age, with the subsequent development of diabetes in many animals by 12–20 weeks of age (2). The concept that the only defect in T1D lies in the immune system has been revisited in recent years. Our group and others have demonstrated that endoplasmic reticulum (ER) stress and resultant insulin secretory defects in the β cell precede the onset of T1D in mice (3, 4). These findings raise the intriguing possibility that ER stress in the β cell might contribute to the aberrant production of “neoantigens” that subsequently invites autoimmunity and insulitis (5–7). Dysfunction of the β cell in pre-T1D has been observed in other studies in NOD mice (8), and both β cell ER stress and dysfunction have been observed in humans with early T1D or destined to develop T1D (9, 10). Therefore, therapies that directly enhance the ER stress-remediating response known as the unfolded protein response (UPR) may prove useful as adjunctive therapies to delay/prevent T1D.
Thiazolidinediones (TZDs) are activators of the nuclear transcription factor peroxisome proliferator-activated receptor-γ (PPAR-γ) and have been traditionally viewed as insulin sensitizers, due to their effects on adipose tissue. The anti-diabetic action of TZDs in adipose tissue occurs, in part, by blocking the phosphorylation of PPAR-γ at Ser-273 (11). Additionally, studies in humans with type 2 diabetes (T2D) and in rodent models of T2D suggest that TZDs may also directly enhance β cell function (12, 13). In addition to their potential effects on β cells, TZDs have also been implicated in the reduction of inflammation and autoimmunity due to the effects on dendritic cells, macrophages, and T cells of the immune system (14–16).
The potential utility of TZDs in T1D has been limited to only a few studies. In humans, treatment of established T1D with the TZD pioglitazone resulted in modest improvements in glycemic control (17–19), raising the prospect that intervention with the drug in the pre-diabetic phase might have greater impact. In accordance with this possibility, studies in NOD mice have shown that administration of the TZDs rosiglitazone and troglitazone at the time of weaning significantly reduced the incidence of T1D (20, 21). These studies in NOD mice did not address the possibility that direct effects of TZDs on the β cell may have led to reduced β cell stress early in the pathogenesis of T1D. To address this possibility, we studied the effects of pioglitazone in the pre-diabetic phase in NOD mice. Our results were consistent with a β cell sparing effect of pioglitazone independent of effects on insulin sensitivity or body fat distribution and suggest that reductions in early β cell stress in NOD mice may underlie the reduction in T1D incidence caused by TZDs.
Results
TZD Therapy Improves Glycemic Control in Pre-diabetic Female NOD Mice
Pre-diabetic female NOD mice show progressively worsening β cell function, failing UPR, and increasing ER stress in pancreatic islets as they age from 6 weeks onward (3, 4, 8). To determine if TZD therapy can restore the UPR and ameliorate β cell stress in the pre-diabetic phase, 6-week-old female NOD mice were fed a standard chow diet containing pioglitazone (0.01 wt%) until 10 weeks of age. Control mice were fed an identical diet not containing pioglitazone. By design, none of the animals developed overt diabetes (defined as blood glucoses on two consecutive measurements >250 mg/dl) during the course of the study. Whereas pioglitazone is known to increase body weight and fat mass in mouse models of T2D (22), during this study pioglitazone-treated NOD mice gained weight no differently than controls (Fig. 1A) and demonstrated no differences in body fat composition as determined by dual-energy x-ray absorptiometry scanning at the end of the study (Fig. 1, B, C, and D). Nevertheless, at the end of the study, pioglitazone-treated mice exhibited a significant improvement in glycemic control compared with control mice, as judged by an intraperitoneal glucose tolerance test (GTT) and corresponding area under the curve (AUC) analysis (Fig. 1, E and F). To assess if the improved glycemic control in pioglitazone-treated mice was caused by altered insulin sensitivity, an intraperitoneal insulin tolerance test was performed, revealing no differences in insulin sensitivity between the two groups (Fig. 1, G and H). Additionally, phosphorylation of Akt in liver and muscle after acute intraperitoneal insulin administration revealed no differences between control and pioglitazone-treated mice (Fig. 1I). Taken together, these results suggest that pioglitazone improves glucose tolerance in NOD mice without significant changes in tissue insulin sensitivity.
FIGURE 1.

Effect of pioglitazone treatment on metabolic parameters in pre-diabetic NOD mice. 6-Week-old pre-diabetic NOD mice (n = 10 per group) were placed on either normal chow (Control) or chow containing 0.01 wt% pioglitazone (Pio). A, body weights during feeding. B, lean body mass as assessed by dual-energy x-ray absorptiometry after 4 weeks of feeding. C, fat mass as assessed by dual-energy x-ray absorptiometry after 4 weeks of feeding. D, percent body fat as assessed by dual-energy x-ray absorptiometry after 4 weeks of feeding. E, results of intraperitoneal GTT after 4 weeks of feeding. F, AUC analysis of GTT shown in panel E. G, results of intraperitoneal insulin tolerance test after 4 weeks of feeding. H, AUC analysis of corresponding ITT in panel G. I, immunoblot analysis of phospho-AKT (Ser-473) and total AKT in liver and muscle isolated from 4-week-fed mice after acute insulin injection. Immunoblots show representative data from three mice per group (Control and Pio). * indicates that the value is significantly different from control by two-tailed t test.
Pioglitazone Treatment Reduces Insulitis in NOD Mice but Does Not Affect T Cell Proliferation in Vitro
To determine if the improved glycemic profile in pioglitazone-treated mice emanated from alterations to the immune response, we next assessed insulitis in histological sections of pancreas from treated and control mice. Fig. 2, A and B, shows that pioglitazone treatment reduced the incidence and severity of insulitis compared with controls. To test whether the reduction in insulitis might have been caused by an effect of pioglitazone on T cell populations, we isolated pancreatic lymph nodes from mice and assessed CD4+ T cell populations in these tissues. Notably, pioglitazone had no significant effect on Th1, Th17 (CD4+IL17A+), or Treg (CD4+CD25+Foxp3+) cell populations in the pancreatic lymph node (Fig. 2, C–E).
FIGURE 2.

Effect of pioglitazone on the frequency and severity of insulitis in pre-diabetic NOD mice. 6- Week-old pre-diabetic NOD mice were placed on either normal chow (Control) or chow containing 0.01 wt% pioglitazone (Pio). After 4 weeks of feeding, pancreas and pancreatic lymph nodes were harvested from animals (n = 5 per group). A, representative images of islets stained for glucagon, insulin, and nuclei (DAPI) from control- and pioglitazone-treated animals; the dense blue nuclei (region indicated by arrows) represent immune infiltrate (insulitis), B, results of insulitis scoring of control- and pioglitazone-treated animals. C, flow cytometric analysis from pancreatic lymph nodes showing Treg cells (CD4+CD25+Foxp3+) as a percentage of total CD4+ cells. D, flow cytometric analysis from pancreatic lymph nodes showing Th1 cells (CD4+IFN-γ+) as a percentage of total CD4+ cells. E, flow cytometric analysis from pancreatic lymph nodes showing Th17 cells (CD4+IL17A+) as a percentage of total CD4+ cells.
The reductions in insulitis without effects on specific CD4+ T cell populations led us to consider if pioglitazone might have caused a generalized reduction in T cell proliferation. Unfractionated splenocytes from NOD mice were loaded with the dye carboxyfluorescein succinimidyl ester (CFSE) and subjected to polyclonal stimulation using a combination of anti-CD3 antibody, anti-CD28 antibody, and IL-2 in vitro to mimic antigen-dependent and -independent signals as seen in T1D (23). After 4 days stimulation in the presence or absence of 1 or 10 μm pioglitazone, cells were gated for CD4 positivity and analyzed for CFSE dilution by flow cytometry. Fig. 3A shows representative histograms demonstrating dilution of CFSE upon stimulation with anti-CD3/anti-CD28/IL-2, findings indicative of T cell proliferation. No differences in CFSE dilution were observed with either 1 μm or 10 μm pioglitazone (Fig. 3B), indicating that pioglitazone at these concentrations does not alter the proliferative rate of T cells. These data suggest that the reduction in insulitis seen in treated mice is not likely an effect of pioglitazone to directly alter T cell populations or suppress T cell proliferation.
FIGURE 3.
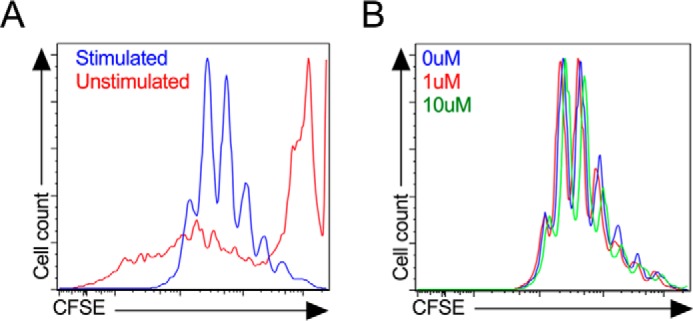
Proliferation of splenocytes in response to pioglitazone treatment in vitro. Unfractionated NOD mouse splenocytes were stimulated in vitro with anti-CD3/anti-CD28 and IL-2 for 4 days then gated on CD4+ cells by flow cytometry. A, CFSE dye fluorescence intensity in unstimulated (red line) and stimulated (blue line) CD4+ cells in the absence of pioglitazone. B, effects of 0 μm (blue line), 1 μm (red line), and 10 μm (green line) pioglitazone on CFSE fluorescence intensity in stimulated CD4+ cells.
Pioglitazone Inhibits PPAR-γ (Ser-273) Phosphorylation in β Cells and Islets
Pioglitazone and related TZDs interact with PPAR-γ and block phosphorylation of Ser-273, an effect that promotes actions of the nuclear receptor (11). To confirm a direct effect of pioglitazone in islet β cells, we pretreated the mouse β cell-derived cell line MIN6 with 10 μm pioglitazone or 10 μm roscovitine (an inhibitor of cyclin-dependent kinases, which are known to promote Ser-273 phosphorylation) (24) then performed an immunoblot for phospho-PPAR-γ (Ser-273). As shown in Fig. 4A, levels of phospho-PPAR-γ (S273) was detectable in non-treated (control) cells. By contrast, phospho-PPAR-γ (S273) levels were blunted in cells pretreated with 10 μm pioglitazone and 10 μm roscovitine (Fig. 4A). Islets of pioglitazone-treated NOD mice also showed reductions in phospho-PPAR-γ (S273) (Fig. 4B), consistent with a direct effect of pioglitazone on islets.
FIGURE 4.

Pioglitazone suppresses PPAR-γ (Ser-273) phosphorylation in β cells in vitro and in islets of NOD mice in vivo. A, MIN6 β cells were preincubated in vehicle, 10 μm pioglitazone (Pio), or 10 μm roscovitine overnight, then extracts were subjected to immunoblotting using anti-phospho-PPAR-γ (S273) and anti-acetyl-histone H3 (Lys-14) as a loading control. Representative immunoblots are shown, and the bar graph below shows the quantitation of immunoblots (normalized to loading control) from three independent experiments. * indicates that the value is significantly different (p < 0.05) compared with vehicle-treated (control) cells. B, 6-week-old pre-diabetic NOD mice were placed on either normal chow (Control) or chow containing 0.01 wt% pioglitazone (Pio). After 4 of weeks feeding, islets from 2 mice per group were isolated and subjected to immunoblotting using anti-phospho-PPAR-γ (S273), anti-phospho-eIF2α, and anti-acetyl-histone H3 (Lys-14) as a loading control.
TZD Therapy Augments Insulin Secretion and Reduces β Cell ER Stress and Death in Pre-diabetic Female NOD Mice
To determine if the improved glycemic control in pioglitazone-treated NOD mice was a consequence of enhanced β cell function, serum insulin levels were measured after an intraperitoneal glucose load. As shown in Fig. 5A, pioglitazone-treated mice displayed significantly higher levels of serum insulin compared with the control group at 10 min after the intraperitoneal glucose load. Isolated islets from treated mice also showed a lower basal insulin secretion at low glucose (2.5 mm) in vitro and a significantly more robust response to glucose stimulation (25 mm) compared with control islets (Fig. 5B). To assess if pioglitazone treatment affected β cell stress and prohormone processing, we next measured random-fed insulin and proinsulin and the proinsulin:insulin ratio. Higher proinsulin:insulin ratios have been shown to correlate to β cell ER stress in both humans and NOD mice (4, 25, 26). As shown in Fig. 5C, whereas the random-fed insulin was a significant 2-fold greater in the treatment group compared with controls, the proinsulin levels were not significantly different (Fig. 5D), resulting in a proinsulin:insulin ratio that trended lower (p = 0.07) in the treatment group (Fig. 5E).
FIGURE 5.

Effect of pioglitazone on insulin secretion in pre-diabetic NOD mice. 6-Week-old pre-diabetic NOD mice were placed on either normal chow (Control) or chow containing 0.01 wt% pioglitazone (Pio). A, serum insulin levels at the indicated time points after intraperitoneal glucose injection (2.0 g/kg body weight) after 4 weeks of feeding (n = 12 mice per group). B, glucose-stimulated insulin secretion from isolated islets from control and pioglitazone-fed mice (n = 9 mice per group). C, random-fed insulin levels after 4 weeks of feeding (n = 8 mice per group). D, random-fed proinsulin levels after 4 weeks of feeding (n = 8 mice per group). E, random-fed proinsulin:insulin ratio after 4 weeks of feeding (n = 8 mice per group). * indicates value is significantly different for the comparisons shown by two-tailed t test.
To assess more directly the possibility that pioglitazone enhanced the UPR and reduced ER stress, we next isolated islets from treated and control mice at the end of the study and measured both mRNA and protein markers of the UPR. The UPR is characterized by variable activation of three distinct pathways, IRE1α, PERK, and ATF6. In islet β cells, the IRE1α and PERK pathways predominate and are evident by increases in spliced Xbp1 mRNA levels and ATF4 protein levels (27). As shown in Fig. 6A, there was significant reduction in spliced Xbp1 (sXbp1) mRNA levels in islets from pioglitazone-treated mice compared with controls, demonstrating attenuation of the IRE1α pathway by pioglitazone treatment. By contrast, an increase in ATF4 protein levels was observed by immunoblot analysis (Fig. 6B). The elevation of ATF4 protein levels was confirmed by an increase in the mRNA encoding DNA damage-inducible protein 34 (Gadd34), a known ATF4 target gene (Fig. 6C) (28). GADD34 is a phosphatase that dephosphorylates eIF2α to restore protein synthesis in the remediation phase of the UPR (28, 29). As shown in Fig. 4B, phosphorylated eIF2α is reduced in islets of pioglitazone-treated mice. Consistent with the recovery of protein synthesis, a slight, but significant, increase in the levels of the protein folding chaperone BIP was observed in the islets of treated mice (Fig. 6C).
FIGURE 6.

Effect of pioglitazone on β cell ER stress in pre-diabetic NOD mice. 6-Week-old pre-diabetic NOD mice were placed on either normal chow (Control) or chow containing 0.01 wt% pioglitazone (Pio). After 4 weeks of feeding, pancreas was harvested (n = 5) or islets were isolated and subjected to RT-PCR (n = 3 per group) or immunoblot analysis (n = 3 per group). A, spliced Xbp1 mRNA (relative to Actb mRNA). B, immunoblot analysis and quantitation for ATF4. C, Gadd34 mRNA (relative to Actb mRNA). D, immunoblot analysis and quantitation for Bip. E, Chop mRNA (relative to Actb mRNA). * indicates that the values are significantly different (p < 0.05) by two-tailed t test.
Failure of the UPR to adapt to the underlying stress leads to frank ER stress and to activation of the proapoptotic pathway mediated by CHOP (30). Concordant with the adaptive UPR in pioglitazone-treated mice, there was a reduction in Chop mRNA in islets (Fig. 6E) and a corresponding reduction in CHOP protein in β cells by immunohistochemistry (Fig. 7A). Likewise, cleaved caspase 3 (CC3), a marker of apoptotic cells, was reduced in insulin+ cells of pioglitazone-treated mice compared with control mice (Fig. 7B).
FIGURE 7.
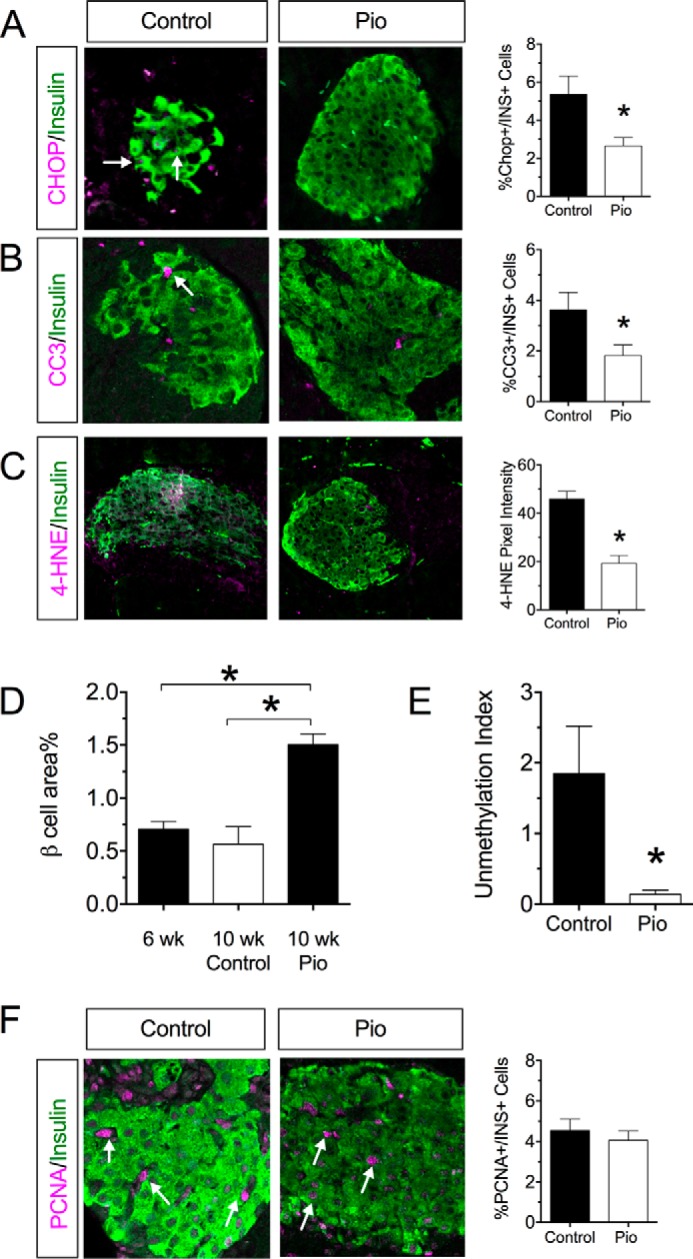
Pioglitazone reduces oxidative stress, enhances β cell mass, and suppresses β cell death in pre-diabetic NOD mice. 6-Week-old pre-diabetic NOD mice were placed on either normal chow (Control) or chow containing 0.01 wt% pioglitazone (Pio). After 4 of weeks feeding, pancreas was harvested from animals (n = 5). A, representative islet immunostaining from control and pioglitazone-treated mice for CHOP and insulin and corresponding quantitation of CHOP+insulin+ cells. Arrows indicate cells that costain for insulin and CHOP. B, representative islet immunostaining for CC3 and insulin and corresponding quantitation of CC3+insulin+ cells. The arrow indicates cells that costain for insulin and CC3. C, representative islet immunostaining for 4-HNE and insulin and corresponding 4-HNE pixel intensity. D, β cell area as a percentage of total pancreas area for animals at the start of the study (6 weeks of age) and for control and pioglitazone treated at the indicated ages. E, serum unmethylation index for control- and pioglitazone-treated mice (n = 4–5 per group). F, representative islet immunostaining from control and pioglitazone-treated mice for PCNA and insulin and corresponding quantitation of PCNA+insulin+ cells. Arrows indicate cells that costain for insulin and PCNA. * indicates that the values are significantly different (p < 0.05) by two-tailed t test.
To clarify the underlying mechanism promoting an adaptive UPR, we evaluated pancreas tissue sections for evidence of oxidative stress, which is known to drive the development of ER stress (27). Fig. 7C shows that control NOD mice exhibited evidence of oxidative stress in islets, as assessed by immunostaining for 4-hydroxynonenal (4-HNE). By contrast, minimal to no 4-HNE staining was observed in islets of pioglitazone-treated mice. As a likely consequence of reduced oxidative stress and more robust UPR, β cell area (as a percentage of total pancreatic area) was increased 2-fold upon pioglitazone treatment (Fig. 7D). This greater β cell area percent in pioglitazone-treated mice resulted primarily from reduced β cell death and not an increase in β cell proliferation, as β cell death parameters CC3 (Fig. 7C) and unmethylated preproinsulin DNA (Fig. 7E) (31) were reduced, but no changes in the proliferation marker proliferating cell nuclear antigen (PCNA) were observed (Fig. 7F).
Discussion
T1D develops as a disorder of the immune system in which β cell autoantigens, released as a result of β cell death, trigger the eventual selection and proliferation of autoreactive T cell clones (32). It has been speculated that the physiologic early turnover of β cells seen in neonatal mice (and possibly humans, as well) might contribute sufficient antigen exposure to trigger autoimmunity (33), but this possibility has been challenged in studies of NOD mice (34). A second hypothesis suggests that stress responses intrinsic to the β result in the pathologic formation of epitopes (as misfolded or postranslationally modified proteins) that are immunogenic (5, 6, 35). In this regard, β cell ER stress has been shown to occur in the early pre-diabetic phase in NOD mice and in humans with new-onset T1D (4, 10, 25). The UPR is a coordinated response that is activated under a variety of stress conditions that put increased burden on the ER (ER stress). Two phases of the UPR have been recognized: an adaptive, stress-remediating phase, and a subsequent maladaptive, pro-apoptotic phase that is initiated when remediation is not possible (for a review, see Ref. 29).
The adaptation to ER stress by enhancing the UPR has been proposed as viable, β cell-protective therapy for T1D (3). Because administration of TZDs has been shown to ameliorate ER stress (22), we asked if TZDs have the potential to directly impact β cell function and survival in NOD mice.
TZDs are traditionally viewed as insulin sensitizers, but evidence in recent years suggests that they have direct effects on the β cell. These effects include the stimulation of Pdx1 gene activity and increases in Pdx1 protein levels in isolated β cells (36, 37), stimulation of Serca2 gene activity and protein levels (22, 38), and reductions in β cell oxidative stress (39). Moreover, TZD administration was shown to delay the incidence of T1D in NOD mice (20, 21) and to improve T1D glycemic control in humans (17–19), although it is unclear if these findings were a result of β cell effects of TZDs. Notably, our studies showed that pioglitazone administration resulted in a reduction in phospho-PPAR-γ (Ser-273) in islets and an improvement in the islet UPR, as evidenced by enhanced ATF4 and BIP protein levels and a trend to reduced proinsulin:insulin ratio. Although our study points to a PPAR-γ-dependent effect of pioglitazone, we should point out that pioglitazone was also shown to have an acute effect of reducing metabolic flux and insulin secretion in β cells in a non-PPAR-γ-dependent fashion (40, 41). This effect may have allowed for reduced ER load early in disease pathogenesis and subsequent improvements in ER function. Nevertheless, because our findings were not accompanied by changes in body weight, body fat distribution, or insulin sensitivity, we believe they suggest a direct effect of pioglitazone on islet β cells.
It is noteworthy that we observed increased ATF4 levels despite a reduction in CHOP protein and mRNA in pioglitazone-treated mice. Whereas prior studies have linked ATF4 to activation of the gene encoding CHOP (42), it has become increasingly appreciated that other pathways and transcription factors may activate CHOP independently of ATF4 (43, 44) and that of GADD34 may dissociate ATF4 from Chop activation (45). We, therefore, propose that the elevation of ATF4 in our study likely represents an adaptive, ameliorative effect on ER stress.
A significant outcome in our studies was the increased area percent of β cells in pioglitazone-treated animals compared with controls. Importantly, β cell area was also higher in these animals when compared with 6-week-old NOD mice at the start of the study, suggesting that pioglitazone treatment either enhanced the rate of β cell replication or reduced β cell death or some combination of the two. This result is reminiscent of studies in type 2 diabetic db/db mice in which pioglitazone treatment resulted in increased β cell area that was coincident with improved glycemic control (22). In our case, pioglitazone-treated mice showed a reduction in the serum unmethylation index, a sensitive biomarker of β cell death (31), as well as CC3 staining in insulin+ cells. In light of the reduction in β cell death, it is noteworthy that we observed reductions in both oxidative stress (by 4-HNE immunostaining) and IRE1α activity (as judged by reduced spliced Xbp1 mRNA). IRE1α is an endoribonuclease that operates in a bifunctional manner, initially promoting the adaptive response of the UPR by leading to Xbp1 splicing and later, during prolonged ER stress, promoting the cleavage of other mRNAs and microRNAs and leading to cellular apoptosis (46–48). In prior studies, our group demonstrated that NOD mice show significant elevations in spliced Xbp1 mRNA (and, by inference, IRE1α activity) compared with non-diabetes-prone controls at 10–12 weeks of age (4). The studies of Kaufman et al. (27) suggest that oxidative stress is closely linked to ER stress. We suggest here that the reductions in IRE1α activity as a result of attenuated oxidative stress by pioglitazone likely reflect an augmented and more successful UPR.
Finally, we should comment on the significant reduction in insulitis we observed upon pioglitazone treatment. Despite the reduction in insulitis, we did not observe differences in relative proportions of CD4+ T cell subtypes in the draining pancreatic lymph node. These findings raise the possibility that pioglitazone may have had a primary effect on reducing proliferation of T cells. We tested this possibility by performing T cell activation assays in vitro wherein no changes in CD4+ cell proliferation or differentiation were observed in response to pioglitazone. Studies have shown stimulatory and inhibitory effects of PPAR-γ on Treg and Th17 cells, respectively (14, 49), so we cannot rule out the possibility that differences in CD4+ T cell subpopulations occurred in the immediate vicinity of the islets themselves. In the absence of a direct effect of pioglitazone on T cell proliferation, it nevertheless remains possible that the augmentation of the β cell UPR with pioglitazone may have diminished the stimulus for autoimmunity. In this regard recent studies have shown that chemical restoration of β cell UPR in type 1 diabetic mice results in a reduction in insulitis (3).
Certain key limitations to our study must be recognized. First, notwithstanding some evidence to the contrary, we cannot rule out non-β cell effects of pioglitazone in our study, and it remains possible that β cell-protective effects may still indirectly emanate from the effects on adipose tissue, muscle, or immune cells. Second, the implications of our findings to human T1D remain speculative, but recent observations suggesting elevations in β cell ER stress parameters in human T1D (3, 10, 25) suggest promise for the use interventions that enhance the UPR. Although pioglitazone and similar TZDs have fallen out of favor in clinical use, our findings linking pioglitazone treatment to reductions in phospho-PPAR-γ (Ser-273) open the exciting possibility that non-TZD approaches to blocking Ser-273 phosphorylation may be an alternative approach to enhancing the β cell UPR. Recently, imatinib (Gleevec) was shown to block PPAR-γ (Ser-273) phosphorylation (50) and as such represents a non-TZD with diabetes-ameliorating effects (50, 51). In this respect, an ongoing clinical trial (NCT01781975) is testing the potential for imatinib as therapy for recent-onset T1D. Taken together, our data support the conclusion that TZDs and similar-acting agents may have protective effects to reduce β cell stress and death in T1D and also support the notion that an aggressive approach to β cell function represents an important adjunctive means to control progression or severity of T1D.
Experimental Procedures
Cells, Animals, and Procedures
Mouse-derived MIN6 β cells were cultured and maintained as previously described (52). Pioglitazone and roscovitine were dissolved in DMSO at 1000× concentration and applied directly to cell culture medium at concentrations of 1 μm or 10 μm as indicated in the figures. Cells were preincubated with pioglitazone or roscovitine overnight before experimentation.
Female NOD/ShiLTJ (NOD) mice were purchased from The Jackson Laboratory (Bar Harbor, ME) and maintained at the Indiana University Laboratory Animal Resource Center under pathogen-free conditions according to protocols approved by the institutional animal care and use committee. Mice were allowed to acclimate for 1 week before experimentation. Mice were fed with either a standard chow diet or a standard chow diet containing 0.01 wt% pioglitazone (Harlan-Teklad Global). This concentration of pioglitazone was designed to deliver ∼20 mg/kg body weight pioglitazone based on average daily food intake (22, 39). Body weights and blood glucose levels were measured weekly. At 10 weeks of age, mice underwent a intraperitoneal GTT at 2 g/kg body weight of glucose as described previously (4). Serum during the GTT was collected for insulin measurements at 0 and 10 min post glucose injection. Lean body mass and fat mass was determined by dual-energy x-ray absorptiometry (DEXA) using a Lunar PIXImus2 densitometer (GE Medical Systems). Insulin tolerance tests were performed with 1.5 units/kg body weight of insulin injected intraperitoneally as described (22). At the end of the study, mice were euthanized, serum was collected, and pancreata harvested or islets isolated as described (53). Serum insulin was measured using an Ultra Sensitive Mouse Insulin ELISA kit (Crystal Chem), and serum proinsulin was measured using a Mouse Proinsulin ELISA kit (ALPCO). Some mice were stimulated with 10 units/kg insulin (Humulin®; Lilly) 5 min before euthanasia, and liver and muscle were harvested.
Quantitative Real-time RT-PCR and Immunoblot Analysis
Total RNA from islets or MIN6 cells was isolated, reverse-transcribed, and subjected to quantitative real-time RT-PCR as described previously (54). Results of RT-PCR analysis were normalized to Actb levels. Primers for mouse spliced Xbp1, GADD34, Chop, and Actb were described previously (30, 55–58). Measurement of methylated and unmethylated preproinsulin DNA in the serum by multiplex PCR was performed as we recently detailed (31).
Immunoblots were performed using 4–20% polyacrylamide gel electrophoresis as previously described (59). Antibodies were used as follows: anti-phospho-AKT (Ser-473) (1:1000 dilution, Cell Signaling Technology #9271), anti-total AKT (1:1000 dilution, Cell Signaling Technology #2920), anti-BIP (1:1000 dilution, Cell Signaling Technology #3183), anti-ATF4 (1:500 dilution, Santa Cruz Biotechnology #sc-200), anti-actin (1:1000 dilution, MP Biomedicals #691001), anti-GAPDH (1:4000 dilution, Ambion #AM4300), anti-phospho-PPAR-γ (Ser-273) (1:1000 dilution, Bioss #bs-4888R), and anti-acetyl histone H3 (Lys14) (1:2000, Millipore #06-911).
Immunohistochemistry, Immunofluorescence, β Cell Area, and Insulitis Scoring
Pancreata were fixed, sectioned, and stained for insulin as described (22). Pancreata were stained for immunofluorescence for glucagon, CHOP, PCNA, cleaved caspase 3, or 4-HNE with insulin and counterstained with DAPI and quantified as described (4, 60). Images were captured using an AxioObserver Z1 equipped with a high resolution color camera or LSM 700 confocal (Carl Zeiss). β cell area was calculated as described previously (61). For insulitis scoring, 3 pancreas sections at least 70 μm apart from 5 animals per group were scored using the following grading scheme (62): grade 1, no islet-associated mononuclear cell infiltrates; grade 2, peri-insulitis affecting <50% of the circumference of the islet without evidence of islet invasion; grade 3, peri-insulitis affecting >50% of the circumference of the islet with evidence of islet invasion; grade 4, islet invasion.
Flow Cytometric Analysis of T Cells
Single cell suspensions were prepared from harvested pancreatic lymph nodes from NOD mice (62, 63). For Treg cell analyses, equal volumes of the single cell suspensions were stained using anti-CD4-FITC (eBioscience RM4–5) and anti-CD25-APC (eBioscience PC61.5) antibodies and fixed overnight before being permeabilized and stained with anti-Foxp3-PE (eBioscience FJK-16s) antibody. For the Th1 and Th17 cell analyses, equal volumes of the single cell suspensions were first incubated with Cell Stimulation Mixture (eBioscience) for 4 h before staining with anti-CD4 antibody; cells were fixed overnight then permeabilized and stained for IL-17A (eBioscience eBio17B7) and IFNγ (eBioscience XMG1.2) according to the manufacturer's instructions (eBioscience). Cells were analyzed using a BD FACSCalibur flow cytometer (BD Biosciences) and FlowJo software (TreeStar). For determination of cellular proliferation, single cell suspensions of unfractionated splenocytes from NOD mice were incubated in 5 μm membrane dye carboxyfluorescein diacetate succinimidyl ester (CFSE) for 10 min at 37 °C, diluted with 5 volumes of ice-cold media, and incubated for 5 min on ice. Samples were then washed with PBS three times and subjected to stimulation in vitro and subjected to flow cytometry as described above.
Statistical Analysis
All data are presented as the mean ± S.E. One-way analysis of variance (with Dunnett's post-test) was used for comparisons involving more than two conditions, and a two-tailed Student's t test was used for comparisons involving two conditions. Prism 7 software (GraphPad) was used for all statistical analyses. Statistical significance was assumed at p < 0.05.
Author Contributions
A. V. M. and R. G. M. designed the experiments, performed the research, and wrote the paper. S. A. T. performed the research and wrote the paper. F. S., J. B. N. and S. C. C. performed the research. B. M. designed the experiments.
Acknowledgments
We thank N. Stull and K. Benninger of the Center for Diabetes and Metabolic Diseases Islet and Physiology Core laboratory for expert assistance in the isolation of islets and in the metabolic characterization of mice. This work utilized core services supported by National Institutes of Health Grant P30 DK097512 to the Indiana University School of Medicine.
This work was supported by National Institutes of Health Grants R01 DK60581, R01 DK105588, UC4 DK104166 (all to RGM), and F32 DK094489 (to S. C. C.). This work was also supported by a Junior Faculty Award grant from the American Diabetes Association (to S. A. T.) and by grants from the George and Frances Ball Foundation and the Ball Brothers Foundation (to R. G. M.). The authors declare that they have no conflicts of interest with the contents of this article. The content is solely the responsibility of the authors and does not necessarily represent the official views of the National Institutes of Health.
- T1D
- type 1 diabetes
- T2D
- type 2 diabetes
- NOD
- non-obese diabetic
- ER
- endoplasmic reticulum
- UPR
- unfolded protein response
- TZD
- thiazolidinedione
- PPAR
- peroxisome proliferator-activated receptor
- CFSE
- carboxyfluorescein succinimidyl ester
- AUC
- area under the curve
- CC3
- cleaved caspase 3
- GTT
- glucose tolerance test
- 4-HNE
- 4-hydroxynonenal
- PCNA
- proliferation marker proliferating cell nuclear antigen.
References
- 1. Anderson M. S., and Bluestone J. A. (2005) The NOD mouse: a model of immune dysregulation. Annu. Rev. Immunol. 23, 447–485 [DOI] [PubMed] [Google Scholar]
- 2. Leiter E. H., Prochazka M., and Coleman D. L. (1987) The non-obese diabetic (NOD) mouse. Am. J. Pathol. 128, 380–383 [PMC free article] [PubMed] [Google Scholar]
- 3. Engin F., Yermalovich A., Nguyen T., Ngyuen T., Hummasti S., Fu W., Eizirik D. L., Mathis D., and Hotamisligil G. S. (2013) Restoration of the unfolded protein response in pancreatic beta cells protects mice against type 1 diabetes. Sci. Transl. Med. 5, 211ra156–211ra156 [DOI] [PMC free article] [PubMed] [Google Scholar]
- 4. Tersey S. A., Nishiki Y., Templin A. T., Cabrera S. M., Stull N. D., Colvin S. C., Evans-Molina C., Rickus J. L., Maier B., and Mirmira R. G. (2012) Islet β-cell endoplasmic reticulum stress precedes the onset of type 1 diabetes in the nonobese diabetic mouse model. Diabetes 61, 818–827 [DOI] [PMC free article] [PubMed] [Google Scholar]
- 5. Maganti A., Evans-Molina C., and Mirmira R. (2014) From immunobiology to β-cell biology: the changing perspective on type 1 diabetes. Islets 6, e28778. [DOI] [PMC free article] [PubMed] [Google Scholar]
- 6. Marré M. L., James E. A., and Piganelli J. D. (2015) β cell ER stress and the implications for immunogenicity in type 1 diabetes. Front. Cell Dev. Biol. 3, 67. [DOI] [PMC free article] [PubMed] [Google Scholar]
- 7. O'Sullivan-Murphy B., and Urano F. (2012) ER stress as a trigger for β-cell dysfunction and autoimmunity in type 1 diabetes. Diabetes. 61, 780–781 [DOI] [PMC free article] [PubMed] [Google Scholar]
- 8. Ize-Ludlow D., Lightfoot Y. L., Parker M., Xue S., Wasserfall C., Haller M. J., Schatz D., Becker D. J., Atkinson M. A., and Mathews C. E. (2011) Progressive erosion of β-cell function precedes the onset of hyperglycemia in the NOD mouse model of type 1 diabetes. Diabetes 60, 2086–2091 [DOI] [PMC free article] [PubMed] [Google Scholar]
- 9. Ferrannini E., Mari A., Nofrate V., Sosenko J. M., Skyler J. S., and DPT-1 Study Group. (2010) Progression to diabetes in relatives of type 1 diabetic patients: mechanisms and mode of onset. Diabetes 59, 679–685 [DOI] [PMC free article] [PubMed] [Google Scholar]
- 10. Marhfour I., Lopez X. M., Lefkaditis D., Salmon I., Allagnat F., Richardson S. J., Morgan N. G., and Eizirik D. L. (2012) Expression of endoplasmic reticulum stress markers in the islets of patients with type 1 diabetes. Diabetologia 55, 2417–2420 [DOI] [PubMed] [Google Scholar]
- 11. Choi J. H., Banks A. S., Estall J. L., Kajimura S., Boström P., Laznik D., Ruas J. L., Chalmers M. J., Kamenecka T. M., Blüher M., Griffin P. R., and Spiegelman B. M. (2010) Anti-diabetic drugs inhibit obesity-linked phosphorylation of PPAR-γ by Cdk5. Nature 466, 451–456 [DOI] [PMC free article] [PubMed] [Google Scholar]
- 12. Gastaldelli A., Ferrannini E., Miyazaki Y., Matsuda M., Mari A., and DeFronzo R. A. (2007) Thiazolidinediones improve β-cell function in type 2 diabetic patients. Am. J. Physiol. Endocrinol. Metab. 292, E871–E883 [DOI] [PubMed] [Google Scholar]
- 13. Gupta D., Kono T., and Evans-Molina C. (2010) The role of peroxisome proliferator-activated receptor γ in pancreatic β cell function and survival: therapeutic implications for the treatment of type 2 diabetes mellitus. Diabetes Obes. Metab. 12, 1036–1047 [DOI] [PMC free article] [PubMed] [Google Scholar]
- 14. Klotz L., Burgdorf S., Dani I., Saijo K., Flossdorf J., Hucke S., Alferink J., Nowak N., Novak N., Beyer M., Mayer G., Langhans B., Klockgether T., Waisman A., Eberl G., et al. (2009) The nuclear receptor PPAR-γ selectively inhibits Th17 differentiation in a T cell-intrinsic fashion and suppresses CNS autoimmunity. J. Exp. Med. 206, 2079–2089 [DOI] [PMC free article] [PubMed] [Google Scholar]
- 15. Klotz L., Hucke S., Thimm D., Classen S., Gaarz A., Schultze J., Edenhofer F., Kurts C., Klockgether T., Limmer A., Knolle P., and Burgdorf S. (2009) Increased antigen cross-presentation but impaired cross-priming after activation of peroxisome proliferator-activated receptor γ is mediated by up-regulation of B7H1. J. Immunol. 183, 129–136 [DOI] [PubMed] [Google Scholar]
- 16. Ricote M., Li A. C., Willson T. M., Kelly C. J., and Glass C. K. (1998) The peroxisome proliferator-activated receptor-γ is a negative regulator of macrophage activation. Nature. 391, 79–82 [DOI] [PubMed] [Google Scholar]
- 17. Bhat R., Bhansali A., Bhadada S., and Sialy R. (2007) Effect of pioglitazone therapy in lean type 1 diabetes mellitus. Diabetes Res. Clin. Pract. 78, 349–354 [DOI] [PubMed] [Google Scholar]
- 18. Kawano Y., Irie J., Nakatani H., and Yamada S. (2009) Pioglitazone might prevent the progression of slowly progressive type 1 diabetes. Intern Med. 48, 1037–1039 [DOI] [PubMed] [Google Scholar]
- 19. Zdravkovic V., Hamilton J. K., Daneman D., and Cummings E. A. (2006) Pioglitazone as adjunctive therapy in adolescents with type 1 diabetes. J. Pediatr. 149, 845–849 [DOI] [PubMed] [Google Scholar]
- 20. Beales P. E., Liddi R., Giorgini A. E., Signore A., Procaccini E., Batchelor K., and Pozzilli P. (1998) Troglitazone prevents insulin-dependent diabetes in the non-obese diabetic mouse. Eur. J. Pharmacol. 357, 221–225 [DOI] [PubMed] [Google Scholar]
- 21. Beales P. E., and Pozzilli P. (2002) Thiazolidinediones for the prevention of diabetes in the non-obese diabetic (NOD) mouse: implications for human type 1 diabetes. Diabetes Metab. Res. Rev. 18, 114–117 [DOI] [PubMed] [Google Scholar]
- 22. Evans-Molina C., Robbins R. D., Kono T., Tersey S. A., Vestermark G. L., Nunemaker C. S., Garmey J. C., Deering T. G., Keller S. R., Maier B., and Mirmira R. G. (2009) PPAR-γ activation restores islet function in diabetic mice through reduction of ER stress and maintenance of euchromatin structure. Mol. Cell. Biol. 29, 2053–2067 [DOI] [PMC free article] [PubMed] [Google Scholar]
- 23. Tang Q., Henriksen K. J., Bi M., Finger E. B., Szot G., Ye J., Masteller E. L., McDevitt H., Bonyhadi M., and Bluestone J. A. (2004) In vitro-expanded antigen-specific regulatory T cells suppress autoimmune diabetes. J. Exp. Med. 199, 1455–1465 [DOI] [PMC free article] [PubMed] [Google Scholar]
- 24. Jörns A., Arndt T., Meyer zu Vilsendorf A., Klempnauer J., Wedekind D., Hedrich H.-J., Marselli L., Marchetti P., Harada N., Nakaya Y., Wang G.-S., Scott F. W., Gysemans C., Mathieu C., and Lenzen S. (2014) Islet infiltration, cytokine expression and β cell death in the NOD mouse, BB rat, Komeda rat, LEW.1AR1-iddm rat and humans with type 1 diabetes. Diabetologia 57, 512–521 [DOI] [PubMed] [Google Scholar]
- 25. Watkins R. A., Evans-Molina C., Terrell J. K., Day K. H., Guindon L., Restrepo I. A., Mirmira R. G., Blum J. S., and DiMeglio L. A. (2016) Proinsulin and heat shock protein 90 as biomarkers of β-cell stress in the early period after onset of type 1 diabetes. Transl. Res. 168, 96–106 [DOI] [PMC free article] [PubMed] [Google Scholar]
- 26. Watkins R. A., Evans-Molina C., Blum J. S., and DiMeglio L. A. (2014) Established and emerging biomarkers for the prediction of type 1 diabetes: a systematic review. Transl. Res. 164, 110–121 [DOI] [PMC free article] [PubMed] [Google Scholar]
- 27. Kaufman R. J., Back S. H., Song B., Han J., and Hassler J. (2010) The unfolded protein response is required to maintain the integrity of the endoplasmic reticulum, prevent oxidative stress, and preserve differentiation in β-cells. Diabetes Obes. Metab. 12, 99–107 [DOI] [PMC free article] [PubMed] [Google Scholar]
- 28. Ma Y., and Hendershot L. M. (2003) Delineation of a negative feedback regulatory loop that controls protein translation during endoplasmic reticulum stress. J. Biol. Chem. 278, 34864–34873 [DOI] [PubMed] [Google Scholar]
- 29. Wang M., and Kaufman R. J. (2016) Protein misfolding in the endoplasmic reticulum as a conduit to human disease. Nature 529, 326–335 [DOI] [PubMed] [Google Scholar]
- 30. Song B., Scheuner D., Ron D., Pennathur S., and Kaufman R. J. (2008) Chop deletion reduces oxidative stress, improves β cell function, and promotes cell survival in multiple mouse models of diabetes. J. Clin. Invest. 118, 3378–3389 [DOI] [PMC free article] [PubMed] [Google Scholar]
- 31. Fisher M. M., Perez Chumbiauca C. N., Mather K. J., Mirmira R. G., and Tersey S. A. (2013) Detection of islet β-cell death in vivo by multiplex PCR analysis of differentially methylated DNA. Endocrinology 154, 3476–3481 [DOI] [PMC free article] [PubMed] [Google Scholar]
- 32. Mathis D., Vence L., and Benoist C. (2001) β-Cell death during progression to diabetes. Nature 414, 792–798 [DOI] [PubMed] [Google Scholar]
- 33. Turley S., Poirot L., Hattori M., Benoist C., and Mathis D. (2003) Physiological β cell death triggers priming of self-reactive T cells by dendritic cells in a type-1 diabetes model. J. Exp. Med. 198, 1527–1537 [DOI] [PMC free article] [PubMed] [Google Scholar]
- 34. Carrington E. M., Kos C., Zhan Y., Krishnamurthy B., and Allison J. (2011) Reducing or increasing β-cell apoptosis without inflammation does not affect diabetes initiation in neonatal NOD mice. Eur. J. Immunol. 41, 2238–2247 [DOI] [PubMed] [Google Scholar]
- 35. McGinty J. W., Marré M. L., Bajzik V., Piganelli J. D., and James E. A. (2015) T cell epitopes and post-translationally modified epitopes in type 1 diabetes. Curr. Diab. Rep. 15, 90. [DOI] [PMC free article] [PubMed] [Google Scholar]
- 36. Gupta D., Jetton T. L., Mortensen R. M., Duan S. Z., Peshavaria M., and Leahy J. L. (2008) In vivo and in vitro studies of a functional peroxisome proliferator-activated receptor γ response element in the mouse pdx-1 promoter. J. Biol. Chem. 283, 32462–32470 [DOI] [PMC free article] [PubMed] [Google Scholar]
- 37. Moibi J. A., Gupta D., Jetton T. L., Peshavaria M., Desai R., and Leahy J. L. (2007) Peroxisome proliferator-activated receptor-γ regulates expression of PDX-1 and NKX6.1 in INS-1 Cells. Diabetes 56, 88–95 [DOI] [PubMed] [Google Scholar]
- 38. Kono T., Ahn G., Moss D. R., Gann L., Zarain-Herzberg A., Nishiki Y., Fueger P. T., Ogihara T., and Evans-Molina C. (2012) PPAR-γ activation restores pancreatic islet SERCA2 levels and prevents β-cell dysfunction under conditions of hyperglycemic and cytokine stress. Mol. Endocrinol. 26, 257–271 [DOI] [PMC free article] [PubMed] [Google Scholar]
- 39. Ishida H., Takizawa M., Ozawa S., Nakamichi Y., Yamaguchi S., Katsuta H., Tanaka T., Maruyama M., Katahira H., Yoshimoto K., Itagaki E., and Nagamatsu S. (2004) Pioglitazone improves insulin secretory capacity and prevents the loss of β-cell mass in obese diabetic db/db mice: possible protection of β cells from oxidative stress. Metabolism 53, 488–494 [DOI] [PubMed] [Google Scholar]
- 40. Lamontagne J., Jalbert-Arsenault E., Pepin E., Peyot M.-L., Ruderman N. B., Nolan C. J., Joly E., Madiraju S. R., Poitout V., and Prentki M. (2013) Pioglitazone acutely reduces energy metabolism and insulin secretion in rats. Diabetes 62, 2122–2129 [DOI] [PMC free article] [PubMed] [Google Scholar]
- 41. Lamontagne J., Pepin E., Peyot M.-L., Joly E., Ruderman N. B., Poitout V., Madiraju S. R., Nolan C. J., and Prentki M. (2009) Pioglitazone acutely reduces insulin secretion and causes metabolic deceleration of the pancreatic β-cell at submaximal glucose concentrations. Endocrinology 150, 3465–3474 [DOI] [PMC free article] [PubMed] [Google Scholar]
- 42. Krokowski D., Han J., Saikia M., Majumder M., Yuan C. L., Guan B. J., Bevilacqua E., Bussolati O., Bröer S., Arvan P., Tchórzewski M., Snider M. D., Puchowicz M., Croniger C. M., Kimball S. R., et al. (2013) A self-defeating anabolic program leads to β-cell apoptosis in endoplasmic reticulum stress-induced diabetes via regulation of amino acid flux. J. Biol. Chem. 288, 17202–17213 [DOI] [PMC free article] [PubMed] [Google Scholar]
- 43. Fusakio M. E., Willy J. A., Wang Y., Mirek E. T., Al Baghdadi R. J., Adams C. M., Anthony T. G., and Wek R. C. (2016) Transcription factor ATF4 directs basal and stress-induced gene expression in the unfolded protein response and cholesterol metabolism in the liver. Mol. Biol. Cell. 27, 1536–1551 [DOI] [PMC free article] [PubMed] [Google Scholar]
- 44. Pirot P., Ortis F., Cnop M., Ma Y., Hendershot L. M., Eizirik D. L., and Cardozo A. K. (2007) Transcriptional regulation of the endoplasmic reticulum stress gene chop in pancreatic insulin-producing cells. Diabetes 56, 1069–1077 [DOI] [PubMed] [Google Scholar]
- 45. Iwasaki N., Sugiyama Y., Miyazaki S., Nakagawa H., Nishimura K., and Matsuo S. (2015) An ATF4-signal-modulating machine other than GADD34 acts in ATF4-to-CHOP signaling to block CHOP expression in ER stress-related autophagy. J. Cell. Biochem. 116, 1300–1309 [DOI] [PubMed] [Google Scholar]
- 46. Han D., Lerner A. G., Vande Walle L., Upton J.-P., Xu W., Hagen A., Backes B. J., Oakes S. A., and Papa F. R. (2009) IRE1α kinase activation modes control alternate endoribonuclease outputs to determine divergent cell fates. Cell 138, 562–575 [DOI] [PMC free article] [PubMed] [Google Scholar]
- 47. Hollien J., Lin J. H., Li H., Stevens N., Walter P., and Weissman J. S. (2009) Regulated Ire1-dependent decay of messenger RNAs in mammalian cells. J. Cell Biol. 186, 323–331 [DOI] [PMC free article] [PubMed] [Google Scholar]
- 48. Upton J.-P., Wang L., Han D., Wang E. S., Huskey N. E., Lim L., Truitt M., McManus M. T., Ruggero D., Goga A., Papa F. R., and Oakes S. A. (2012) IRE1α cleaves select microRNAs during ER stress to derepress translation of proapoptotic caspase-2. Science 338, 818–822 [DOI] [PMC free article] [PubMed] [Google Scholar]
- 49. Cipolletta D., Feuerer M., Li A., Kamei N., Lee J., Shoelson S. E., Benoist C., and Mathis D. (2012) PPAR-γ is a major driver of the accumulation and phenotype of adipose tissue Treg cells. Nature 486, 549–553 [DOI] [PMC free article] [PubMed] [Google Scholar]
- 50. Choi S.-S., Kim E.-S., Jung J.-E., Marciano D. P., Jo A., Koo J. Y., Choi S. Y., Yang Y. R., Jang H.-J., Kim E.-K., Park J., Kwon H. M., Lee I. H., Park S. B., Myung K.-J., Suh P.-G., Griffin P. R., and Choi J. H. (2016) PPARγ Antagonist Gleevec improves insulin sensitivity and promotes the browning of white adipose tissue. Diabetes 65, 829–839 [DOI] [PMC free article] [PubMed] [Google Scholar]
- 51. Han M. S., Chung K. W., Cheon H. G., Rhee S. D., Yoon C.-H., Lee M.-K., Kim K.-W., and Lee M.-S. (2009) Imatinib mesylate reduces endoplasmic reticulum stress and induces remission of diabetes in db/db mice. Diabetes 58, 329–336 [DOI] [PMC free article] [PubMed] [Google Scholar]
- 52. Miyazaki J., Araki K., Yamato E., Ikegami H., Asano T., Shibasaki Y., Oka Y., and Yamamura K. (1990) Establishment of a pancreatic beta cell line that retains glucose-inducible insulin secretion: special reference to expression of glucose transporter isoforms. Endocrinology 127, 126–132 [DOI] [PubMed] [Google Scholar]
- 53. Stull N. D., Breite A., McCarthy R., Tersey S. A., and Mirmira R. G. (2012) Mouse Islet of Langerhans isolation using a combination of purified collagenase and neutral protease. J. Vis. Exp. 67, 4137. [DOI] [PMC free article] [PubMed] [Google Scholar]
- 54. Evans-Molina C., Garmey J. C., Ketchum R., Brayman K. L., Deng S., and Mirmira R. G. (2007) Glucose regulation of insulin gene transcription and pre-mRNA processing in human islets. Diabetes 56, 827–835 [DOI] [PMC free article] [PubMed] [Google Scholar]
- 55. Iype T., Francis J., Garmey J. C., Schisler J. C., Nesher R., Weir G. C., Becker T. C., Newgard C. B., Griffen S. C., and Mirmira R. G. (2005) Mechanism of insulin gene regulation by the pancreatic transcription factor Pdx-1: application of pre-mRNA analysis and chromatin immunoprecipitation to assess formation of functional transcriptional complexes. J. Biol. Chem. 280, 16798–16807 [DOI] [PubMed] [Google Scholar]
- 56. Lipson K. L., Fonseca S. G., and Urano F. (2006) Endoplasmic reticulum stress-induced apoptosis and auto-immunity in diabetes. Curr. Mol. Med. 6, 71–77 [DOI] [PubMed] [Google Scholar]
- 57. Nishio N., and Isobe K. (2015) GADD34-deficient mice develop obesity, nonalcoholic fatty liver disease, hepatic carcinoma and insulin resistance. Sci. Rep. 5, 13519. [DOI] [PMC free article] [PubMed] [Google Scholar]
- 58. Sachdeva M. M., Claiborn K. C., Khoo C., Yang J., Groff D. N., Mirmira R. G., and Stoffers D. A. (2009) Pdx1 (MODY4) regulates pancreatic beta cell susceptibility to ER stress. Proc. Natl. Acad. Sci. U.S.A. 106, 19090–19095 [DOI] [PMC free article] [PubMed] [Google Scholar]
- 59. Robbins R. D., Tersey S. A., Ogihara T., Gupta D., Farb T. B., Ficorilli J., Bokvist K., Maier B., and Mirmira R. G. (2010) Inhibition of deoxyhypusine synthase enhances islet β cell function and survival in the setting of endoplasmic reticulum stress and type 2 diabetes. J. Biol. Chem. 285, 39943–39952 [DOI] [PMC free article] [PubMed] [Google Scholar]
- 60. Tersey S. A., Maier B., Nishiki Y., Maganti A. V., Nadler J. L., and Mirmira R. G. (2014) 12-Lipoxygenase promotes obesity-induced oxidative stress in pancreatic islets. Mol. Cell. Biol. 34, 3735–3745 [DOI] [PMC free article] [PubMed] [Google Scholar]
- 61. Maier B., Ogihara T., Trace A. P., Tersey S. A., Robbins R. D., Chakrabarti S. K., Nunemaker C. S., Stull N. D., Taylor C. A., Thompson J. E., Dondero R. S., Lewis E. C., Dinarello C. A., Nadler J. L., and Mirmira R. G. (2010) The unique hypusine modification of eIF5A promotes islet β cell inflammation and dysfunction in mice. J. Clin. Invest. 120, 2156–2170 [DOI] [PMC free article] [PubMed] [Google Scholar]
- 62. Cabrera S. M., Colvin S. C., Tersey S. A., Maier B., Nadler J. L., and Mirmira R. G. (2013) Effects of combination therapy with dipeptidyl peptidase-IV and histone deacetylase inhibitors in the NOD mouse model of type 1 diabetes. Clin. Exp. Immunol. 172, 375–382 [DOI] [PMC free article] [PubMed] [Google Scholar]
- 63. Colvin S. C., Maier B., Morris D. L., Tersey S. A., and Mirmira R. G. (2013) Deoxyhypusine synthase promotes differentiation and proliferation of T helper type 1 (Th1) cells in autoimmune diabetes. J. Biol. Chem. 288, 36226–36235 [DOI] [PMC free article] [PubMed] [Google Scholar]