Abstract
Background
Contrast enhanced spectral mammography (CESM) is a new method of breast cancer diagnosis in which an iodinated contrast agent is injected and dual-energy mammography is obtained in multiple views of the breasts. The aim of this study was to compare the degree of enhancement on CESM with lesion characteristics on mammography (MG) and lesion histology in women with suspicious breast lesions.
Material/Methods
The degree of enhancement on CESM (absent, weak, medium, or strong) was compared to lesion characteristics on MG (mass, mass with microcalcifications, or microcalcifications alone) and histology (infiltrating carcinoma, intraductal carcinoma, or benign) to compare sensitivity of the two modalities and to establish correlations that might improve diagnostic accuracy.
Results
Among 225 lesions identified with CESM and MG, histological evaluation revealed 143 carcinomas (127 infiltrating, 16 intraductal) and 82 benign lesions. This is the largest cohort investigated with CESM to date. The sensitivity of CESM was higher than that of MG (100% and 90%, respectively, p=0.010). Medium or strong enhancement on CESM and the presence of a mass on MG was the most likely indictor of malignancy (55.1% p=0.002). Among benign lesions, 60% presented as enhancement on CESM (were false-positive), and most frequently as medium or weak enhancement, together with a mass on MG (53%, p=0.047). Unfortunately, the study did not find combinations of MG findings and CESM enhancement patterns that would be helpful in defining false-positive lesions. We observed systematic overestimation of maximum lesion diameter on CESM compared to histology (mean difference: 2.29 mm).
Conclusions
Strong or medium enhancement on CESM and mass or mass with microcalcifications on MG were strong indicators of malignant transformation. However, we found no combination of MG and CESM characteristics helpful in defining false-positive lesions.
MeSH Keywords: Breast Neoplasms, Contrast Media, Mammography
Background
Contrast enhanced spectral mammography (CESM) is a new method in breast cancer diagnostics. In recent years, CESM has developed dramatically and the number of mammography centers where these examinations are performed is gradually increasing. Typically, CESM is used for evaluating patients with suspicious focal lesions where conventional mammography (MG) and additional ultrasound examinations (US) fail to make a definitive diagnosis. CESM is frequently useful in cases of dense breasts (BI-RADS density category D) or heterogeneously dense breasts (BI-RADS category C), where cancer detection is impeded due to the lower sensitivity of mammography [1,2]. In CESM examinations, as in breast MRI, neoangiogenesis (tumor vascularity) is visualized, allowing detection of more breast lesions. Previous publications have suggested the superiority of CESM to mammography and the comparability of CESM to breast MRI for breast cancer detection [3–5]. Studies supporting the usefulness of CESM in breast cancer diagnostics are still limited due to its short time in clinical use.
The aim of this study was to compare the degree of enhancement on CESM to lesion characteristics on MG and histology results to compare the sensitivity of the two modalities and to establish correlations that might improve diagnostic accuracy. In addition, lesion diameters measured on MG and CESM were compared to lesion sizes on histological examinations. These analyses were performed in the largest cohort investigated with CESM to date.
Material and Methods
Patients
This study was performed in compliance with the Declaration of Helsinki and it received approval of the Ethical Committee at the Regional Medical Chamber in Cracow, Poland. Selection criteria for study participants were breast diagnostic problems and suspicious findings on MG. The study cohort included 193 patients, with a mean age of 55±0.8 years. All enrolled patients underwent both MG and CESM [6].
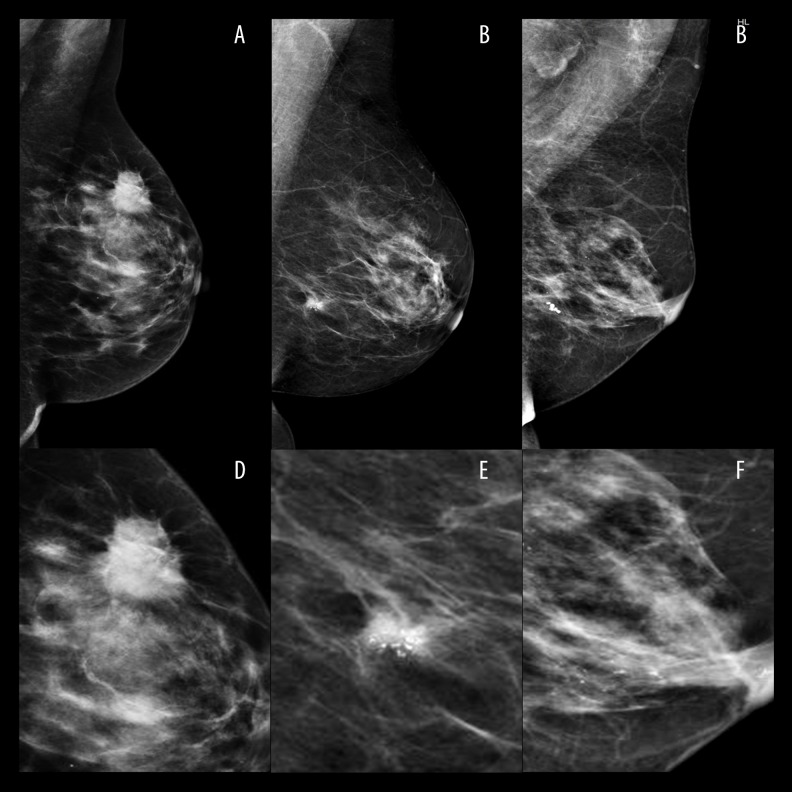
Lesions were divided into the following subcategories depending on presentation on mammography: mass, mass with microcalcifications, microcalcifications alone (Figure 1A–1F). CESM examinations were performed with GE Healthcare equipment designed to collect dual-energy images during a single positioning. CESM uses the energy dependency of x-ray attenuation in different breast constituents, in particular soft tissues and iodine. After a single injection of contrast medium, a bilateral breast examination was performed with craniocaudal (CC) and mediolateral (MLO) projections of each breast. Each dual-energy pair consists of a first image acquired with a standard low kilo voltage (all x-rays below the k-edge of iodine which occurs at 33.2 keV), and a second image acquired with a higher energy x-ray beam (45–49 kVp) and sufficient x-ray filtration to ensure that most of the x-ray spectrum is above the k-edge of iodine. Both images were automatically acquired in a very short time interval using the CESM protocol implemented on the x-ray system. A mathematical combination of low- and high-energy images allows reconstruction of a single image maximizing the conspicuity of iodine-based contrast medium within the breast, emphasizing the vascularity of enhancing lesions [7,8]. A detailed description of the CESM method has been given by Daniaux et al. [9].
Figure 1.
Example of lesions visible on mammography: (A) mass, (B) mass with microcalcifications, (C) microcalcifications. Enlarged parts of these lesions are presented in (D) mass, (E) mass with microcalcifications, (F) microcalcifications only.
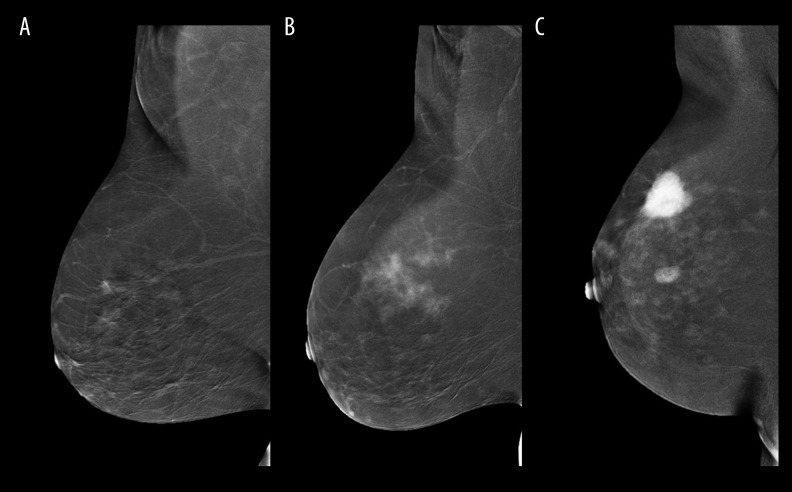
Lesions detected on CESM were classified according to BI-RADS-like categories of suspicion for breast cancer [10]. Lesions detected on CESM were also divided into categories: lesions without enhancement (absent), weak, medium, and strongly enhancing lesions (Figure 2A–2C) [11,12].
Figure 2.
Examples of degree of enhancement lesions on CESM (A) weak, (B) medium, (C) strong.
Subsequently, lesions found on MG were compared with enhancement foci on CESM. Lesion diameters measured with MG, CESM, and estimated histologically were compared.
Histopathological examination
Fresh specimens received after surgery or core biopsy (in case of benign lesions) were sent to the Pathology Department and underwent formalin fixation followed by paraffin embedding. Tumor diameter was assessed macroscopically in three dimensions and microscopically by examining sections stained with hematoxylin and eosin to compare the maximum diameter found on CESM and during pathological examination. If the breast cancer was diagnosed as multifocal, the diameter of the largest invasive tumor was used as the tumor size.
Statistical methods
The Pearson’s chi-square test of independence was used to examine relations between categorical variables (results of mammography versus results of CESM versus histological results of lesions). Results of this analysis were shown in contingency tables.
Receiver operating characteristic (ROC) curve analysis was used to evaluate the accuracy of MG and CESM to discriminate between benign and malignant lesions based on BI-RADS classifications. For analysis of sensitivity and specificity, lesions were classified as negative if the BI-RADS score of MG or CESM was less than four.
Correlation between lesion diameters based on MG, CESM, and estimated histologically (continuous variables) were calculated using Pearson’s correlation coefficients (PCC). To analyze agreement between the aforementioned measurements (MG versus histological examination, CESM versus histological examination) Bland-Altman plots were generated. The results of histologic examination of the surgical specimens served as the gold standard.
The comparison of lesion diameters (diameter difference between each imaging modality measurement and histologic examination) between benign lesions, intraductal carcinomas, and invasive carcinomas were analyzed using one-way ANOVA. Student’s t-test was used for the comparison of differences in diameters measured with MG or CESM and histologic assessment.
STATISTICA software 12.0 (StatSoft), with medical package, was used to perform all statistical tests and to display test results.
Results
As a result of performing both MG and CESM examinations in 193 patients, 225 lesions were diagnosed. In most of the patients, 163 (84%), one breast lesion was found, while in 28 patients (15%) two lesions were found, and in 2 patients (1%) three lesions were found. There were 143 cancers: 127 (56% of all lesions) infiltrating, 16 (7% of all lesions) intraductal; and 82 (36%) benign lesions. Conventional mammography examinations failed to diagnose 14 infiltrating carcinomas (12 invasive ductal carcinomas and 2 tubular carcinomas) out of 143 cancers (Table 1).
Table 1.
Contingency table of the lesion type on MG, enhancement type found on CESM, and lesion histology.
| Benign lesion | Intraductal carcinoma | Invasive carcinoma | p-value from Pearson’s chi-square test | ||
|---|---|---|---|---|---|
| N (% from row) | N (%) | N (%) | |||
| Mammography | |||||
| Lack of lesion | 7 (33) | 0 | 14 (67) | <0.001 | |
| Mass | 48 (38) | 2 (2) | 76 (60) | ||
| Microcalcifications | 9 (38) | 6 (25) | 9 (38) | ||
| Mass with microcalcifications | 18 (33) | 8 (15) | 28 (52) | ||
| Contrast enhanced spectral mammography | |||||
| Enhancement on CESM | Absent | 33 (100) | 0 | 0 | <0.001 |
| Weak | 25 (42) | 14 (23) | 21 (35) | ||
| Medium | 16 (26) | 2 (3) | 43 (70) | ||
| Strong | 8 (11) | 0 | 63 (89) | ||
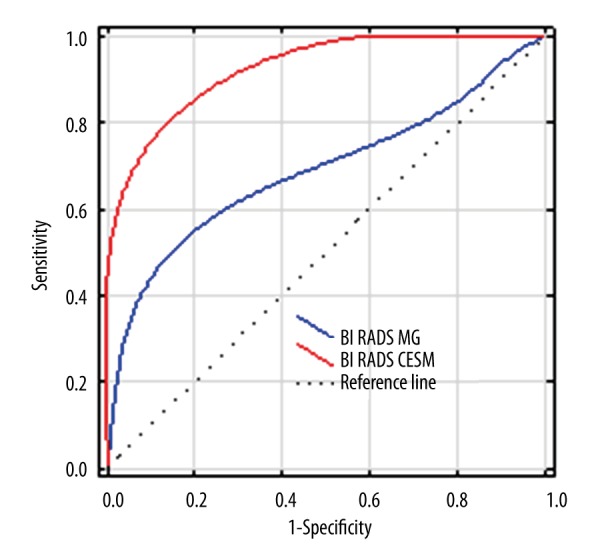
The sensitivity of CESM was 100%, which was higher than that of MG, which was 90% (statistical significance to difference in sensitivity was tested with McNemar’s test and p=0.010). Accuracy of CESM was also higher than that of MG: 78% compared to 62%. ROC differences between CESM and MG are presented in Figure 3.
Figure 3.

Comparison of ROC curves for CESM (red line) and MG (blue line). Dashed line is the reference line representing the ROC curve for a random decision (coin flip) about the positivity of each case (i.e., a useless test).
Correlation between results of CESM, MG, and histology of analyzed lesions
Table 1 shows the frequencies of the different lesion types on MG and the degree of enhancement on CESM for benign lesions, intraductal carcinomas, and invasive carcinomas. On MG, 14 out of 127 invasive carcinomas (11%) were false-negatives, and 75 out of 82 benign lesions (91%) were false-positives. Most of the lesions identified as masses or masses with microcalcifications, however, were invasive cancers (60% and 52%, respectively). Intraductal carcinomas most frequently presented as masses with microcalcifications on MG (8 out of 16 in situ carcinomas), while invasive carcinomas were most likely to be defined as masses on MG (76 out of 127 invasive carcinomas). Forty-eight of 82 benign lesions (59%) presented as masses on MG – masses were the most frequent lesion type on MG among benign lesions.
All invasive and intraductal carcinomas showed enhancement on CESM (all were true positives). Invasive carcinomas most frequently showed strong enhancement on CESM; of 127 invasive carcinomas, 106 (83%) showed medium or strong enhancement, while only 21 (17%) showed weak enhancement. In the group of 82 benign lesions, 49 (60%) presented with some enhancement on CESM (were false-positives); weak enhancement was most frequent (25 of 82), strong enhancement was least frequent (8 of 82). There were no in-situ carcinomas with strong enhancement. Of the 16 intraductal carcinomas, 14 presented as weak enhancement and 2 presented as medium enhancement (p<0.001, Table 1).
Relation between results of CESM and mammography in lesions with different histological type of the lesion
Correlation was found between lesion type on MG and type of enhancement on CESM for invasive carcinomas (p=0.002, Table 2), benign lesions (p=0.047) and all lesions (p<0.001).
Table 2.
Contingency table of the degree of enhancement on CESM and lesion type on MG for each lesion type on histology.
| Mammography | p-value from Pearson’s chi-square test | |||||
|---|---|---|---|---|---|---|
| No finding | Microcalcifications | Mass | Mass with Microcalcifications | |||
| N (% from row) | N (%) | N (%) | N (%) | |||
| All lesions (225 cases) | ||||||
| Degree of enhancement on CESM | Absent | 1 (3) | 8 (24) | 15 (45) | 9 (27) | <0.001 |
| Weak | 10 (17) | 10 (17) | 21 (35) | 19 (32) | ||
| Medium | 6 (9) | 3 (5) | 37 (61) | 15 (25) | ||
| Strong | 4 (6) | 3 (4) | 53 (75) | 11 (15) | ||
| Invasive carcinomas (127 cases) | ||||||
| Degree of enhancement on CESM | Absent | 0 | 0 | 0 | 0 | 0.002 |
| Weak | 7 (33) | 3 (14) | 6 (29) | 5 (24) | ||
| Medium | 4 (9) | 3 (7) | 24 (56) | 12 (28) | ||
| Strong | 3 (5) | 3 (5) | 46 (73) | 11 (17) | ||
| Intraductal carcinomas (16 cases) | ||||||
| Degree of enhancement on CESM | Absent | 0 | 0 | 0 | 0 | 0.180 |
| Weak | 0 | 6 (43) | 1 (7) | 7 (50) | ||
| Medium | 0 | 0 | 1 (50) | 1 (50) | ||
| Strong | 0 | 0 | 0 | 0 | ||
| Benign lesions (82 cases) | ||||||
| Degree of enhancement on CESM | Absent | 1 (3) | 8 (24) | 15 (45) | 9 (27) | 0.047 |
| Weak | 3 (12) | 1 (4) | 14 (56) | 7 (28) | ||
| Medium | 2 (13) | 0 | 12 (75) | 2 (13) | ||
| Strong | 1 (13) | 0 | 7 (88) | 0 | ||
Analysis of all lesions revealed that lesions appearing as masses on MG most often showed strong enhancement on CESM (53 of 126 cases), while microcalcifications or mass with microcalcifications on MG most often showed weak enhancement on CESM (10 of 24 cases and 19 of 54 cases, respectively) (Table 2).
Among invasive carcinomas, the most frequent combination of MG and CESM features was a mass on MG and medium or strong enhancement on CESM (70 of 127 cases). On the other hand, invasive carcinomas that were missed on MG (false-negatives) most often showed weak enhancement on CESM (7 of 14 cases) (Table 2).
There were no false-negative cases either on CESM or MG among in-situ carcinomas (Table 2). Intraductal carcinomas most frequently presented as microcalcifications or masses with microcalcifications on MG, together with weak enhancement on CESM (13 of 16 cases).
Among benign lesions, 32 out of 33 (97%) true-negative cases on CESM had tumor-like appearance on MG (mass; mass with microcalcifications, or microcalcifications), while 6 out of 7 (86%) true-negative benign lesions on MG showed enhancement (were false-positive) on CESM (Table 2). No benign lesions with microcalcifications on MG showed strong or medium enhancement on CESM (Table 2). On the other hand, among benign lesions that were false-positives on CESM (49 cases), medium or weak enhancement on CESM together with mass on MG was the most frequent combination (26 of 49 cases). Among benign lesions positive on CESM and MG (43 false-positive cases), some combinations of features was observed and is described in Table 2.
Comparison of lesions diameters measured during histological examination, on MG, and on CESM
The comparison between measurements obtained from MG and histological examination was performed in 130 cases, while the comparison between CESM and histological examination was done in 161 cases.
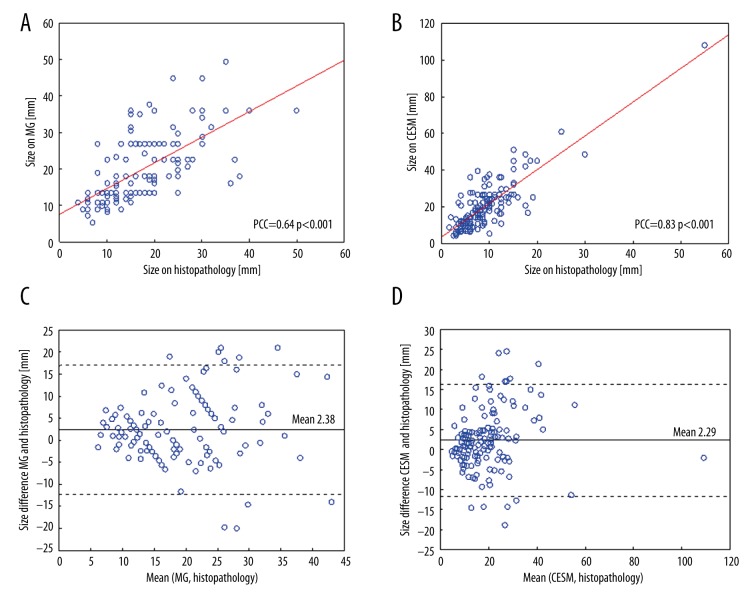
Mean lesion diameter on MG was 20.6±0.9 mm, on CESM it was 19.5±0.9 mm, and on histology it was 18.3±0.8 mm.
Correlations between the lesion diameters measured on MG and histology or CESM and histology were highly significant (p<0.001, Figure 4A, 4B), with PCC larger for CESM and histology (PCC=0.83, Figure 4B) than for MG and histology (PCC=0.64, Figure 4A).
Figure 4.
Comparison of lesion diameters estimated based on histological examination, MG, and CESM. Scatterplots and Pearson’s correlation coefficients (PCC) of diameters assessed (A) with mammography and histological examination and (B) CESM and histology. (C) Bland-Altman plots for the comparison of diameter difference between MG and histological examination and (D) diameter difference between CESM and histological examination. Continuous lines in (C) and (D) represent the mean differences between measurements, the dotted lines represent upper and lower limits of means + or –1.96 times the standard deviation of differences.
The Bland-Altman plots revealed slight systematic overestimation of tumor diameter measured by MG and CESM compared to histology The mean difference between diameters obtained during MG and histology was 2.38 mm (95% limits of agreement: –12 to 17 mm; range: –20 to 21 mm) while between measurements obtained during CESM and histology was 2.29 mm.
Discussion
CESM is a new diagnostic technique that may be considered better than digital mammography because it detects a larger number of focal breast lesions. Duration of the CESM examination is shorter than MRI, as is the time required for lesion evaluation with CESM. These are key reasons CESM is gaining use in breast cancer diagnosis. Moreover, it is worth mentioning that contrast enhanced studies can also be used for the pathologies of gastrointestinal cancers [13].
In our study of 193 patients with 225 diagnosed lesions (127 invasive carcinomas, 16 intraductal carcinomas, and 82 benign lesions), the sensitivity of CESM was 100% and the accuracy was 78%, both higher than MG. This is consistent with previous finding comparing CESM to MG [13,14].
On MG, 14 out of 127 lesions were false-negatives. In our study, all invasive carcinomas showed enhancement on CESM. Invasive carcinomas most frequently presented on MG as mass or mass with microcalcifications, while presenting most often with strong or medium enhancement on CESM. Correlation of both modalities showed invasive carcinomas most frequently characterized by strong or medium enhancement on CESM and a mass on MG. We suggest these radiological characteristics as strong indicator of malignant transformation.
Both MG and CESM produced false-positive results. In our series, 43% of false-positive results on MG were diagnosed as true-negatives on CESM, while 12% of false-positives on CESM were true-negatives on MG. Despite the fact that in the group of false-positive benign lesions (60% of benign lesions were false-positives on CESM) the most frequent presentation was medium or weak enhancement together with a mass on MG, our study did not find that the combination of MG findings and CESM enhancement patterns would be helpful in defining false-positive lesions.
To date. only one other publication has analyzed the correlation between the degree of enhancement on CESM and the lesion type on MG [12]. That study included only 26 patients and the results revealed that malignant lesions had strong or moderate enhancement, while benign lesions were characterized by weak or absent enhancement. That study also showed that nodular lesions on MG enhanced strongly on CESM, while microcalcifications failed to enhance or had weak enhancement. Due to the small number of patients, statistical significance was not tested in that study. Our results confirmed these patterns: we found medium or strong enhancement occurs most frequently for invasive carcinomas, while weak or no enhancement occurs most frequently for benign lesions.
The current study shows reasonable correlation between maximum lesion dimensions measured on MG or CESM and dimensions measured on histological examination, confirming previous results [8,15–17]. Like other researchers, we observed somewhat larger maximum lesion dimensions on MG and CESM than on histology. In our series, mean difference between maximum lesion dimensions measured on MG and histological examination was 2.38 mm, and mean difference between maximum dimensions on CESM and histology was 2.29 mm. Other authors have also reported systematic overestimation of tumor diameter measured by CESM compared to histology, the mean difference between those measurements ranging from 0.03 mm (in a group of 87 invasive breast cancers) to over 3 cm in another report [8,15]. It is worth mentioning that overestimation of maximum lesion dimension does not carry the risk of positive surgical margins.
The systematic overestimation of tumor diameter measured by MG and CESM could be caused by varied pressures applied during MG and CESM examinations, differences concerning details of patient positioning, natural flexibility of the breast, and by the specific vascularity of tumors depending on their types [11]. Moreover, it might hypothetically be possible that in radiological examinations, molecular margins or inflammatory changes are visible (for example changes in peritumoral vascularity). The discrepancies between our and other authors results might be due to different clinical characteristic of the analyzed group of patients (other researchers included only 87 invasive carcinomas, while we analyzed 193 patients and 127 carcinomas) or technical details of CESM (for example, slightly different pressure applied during the examination).
Our study has several limitations. The first limitation is the use of qualitative assessment of degree of enhancement on CESM. A second limitation is the small number of patients in particular subgroups (which might result in lack of statistical power of applied statistical tests), for example in the subgroup of patients with microcalcifications on MG or in the subgroup of in-situ cancers.
Conclusions
Invasive carcinomas were more frequently characterized by both: strong or medium enhancements on CESM, and mass or mass plus microcalcifications on MG. Therefore we suggest the aforementioned radiological characteristics are strong indicators of malignant transformation.
We found no combination of MG and CESM characteristics that would aid in resolving the problem of false-positive enhancement on CESM.
Footnotes
Competing interests
The authors have declared that no competing interest exists.
Source of support: Departmental sources
References
- 1.Harvey JA, Bovbjerg VE. Quantitative assessment of mammographic breast density: Relationship with breast cancer risk. Radiology. 2004;230(1):29–41. doi: 10.1148/radiol.2301020870. [DOI] [PubMed] [Google Scholar]
- 2.Boyd NF, Guo H, Martin LJ, et al. Mammographic density and the risk and detection of breast cancer. N Engl J Med. 2007;356(3):227–36. doi: 10.1056/NEJMoa062790. [DOI] [PubMed] [Google Scholar]
- 3.Fallenberg EM, Dromain C, Diekmann F, et al. Contrast-enhanced spectral mammography versus MRI: Initial results in the detection of breast cancer and assessment of tumour size. Eur Radiol. 2014;24(1):256–64. doi: 10.1007/s00330-013-3007-7. [DOI] [PubMed] [Google Scholar]
- 4.Thibault F, Balleyguier C, Tardivon A, Dromain C. Contrast enhanced spectral mammography: better than MRI? Eur J Radiol. 2012;81(Suppl 1):S162–64. doi: 10.1016/S0720-048X(12)70068-2. [DOI] [PubMed] [Google Scholar]
- 5.Łuczyńska E, Heinze-Paluchowska S, Hendrick E, et al. Comparison between breast MRI and contrast-enhanced spectral mammography. Med Sci Monit. 2015;21:1358–67. doi: 10.12659/MSM.893018. [DOI] [PMC free article] [PubMed] [Google Scholar]
- 6.Mercado CL. BI-RADS update. Radiol Clin North Am. 2014;52(3):481–87. doi: 10.1016/j.rcl.2014.02.008. [DOI] [PubMed] [Google Scholar]
- 7.Dromain C, Balleyguier C, Adler G, et al. Contrast-enhanced digital mammography. Eur J Radiol. 2009;69(1):34–42. doi: 10.1016/j.ejrad.2008.07.035. [DOI] [PubMed] [Google Scholar]
- 8.Luczyńska E, Heinze-Paluchowska S, Dyczek S, et al. Contrast-enhanced spectral mammography: Comparison with conventional mammography and histopathology in 152 women. Korean J Radiol. 2014;15(6):689–96. doi: 10.3348/kjr.2014.15.6.689. [DOI] [PMC free article] [PubMed] [Google Scholar]
- 9.Daniaux M, De Zordo T, Santner W, et al. Dual-energy contrast-enhanced spectral mammography (CESM) Arch Gynecol Obstet. 2015;292(4):739–47. doi: 10.1007/s00404-015-3693-2. [DOI] [PubMed] [Google Scholar]
- 10.Diekmann F, Freyer M, Diekmann S, et al. Evaluation of contrast-enhanced digital mammography. Eur J Radiol. 2011;78(1):112–21. doi: 10.1016/j.ejrad.2009.10.002. [DOI] [PubMed] [Google Scholar]
- 11.Luczynska E, Niemiec J, Ambicka A, et al. Correlation between blood and lymphatic vessel density and results of contrast-enhanced spectral mammography. Pol J Pathol. 2015;66(3):310–22. doi: 10.5114/pjp.2015.54965. [DOI] [PubMed] [Google Scholar]
- 12.Lewin JM, Isaacs PK, Vance V, Larke FJ. Dual-energy contrast-enhanced digital subtraction mammography: feasibility. Radiology. 2003;229(1):261–68. doi: 10.1148/radiol.2291021276. [DOI] [PubMed] [Google Scholar]
- 13.Dromain C, Thibault F, Muller S, et al. Dual-energy contrast-enhanced digital mammography: initial clinical results. Eur Radiol. 2011;21(3):565–74. doi: 10.1007/s00330-010-1944-y. [DOI] [PubMed] [Google Scholar]
- 14.Francescone MA, Jochelson MS, Dershaw DD, et al. Low energy mammogram obtained in contrast-enhanced digital mammography (CEDM) is comparable to routine full-field digital mammography (FFDM) Eur J Radiol. 2014;83(8):1350–55. doi: 10.1016/j.ejrad.2014.05.015. [DOI] [PubMed] [Google Scholar]
- 15.Lobbes MBI, Lalji UC, Nelemans PJ, et al. The quality of tumor size assessment by contrast-enhanced spectral mammography and the benefit of additional breast MRI. J Cancer. 2015;6(2):144–50. doi: 10.7150/jca.10705. [DOI] [PMC free article] [PubMed] [Google Scholar]
- 16.Jochelson MS, Dershaw DD, Sung JS, et al. Bilateral contrast-enhanced dual-energy digital mammography: feasibility and comparison with conventional digital mammography and MR imaging in women with known breast carcinoma. Radiology. 2013;266(3):743–51. doi: 10.1148/radiol.12121084. [DOI] [PMC free article] [PubMed] [Google Scholar]
- 17.Dromain C, Thibault F, Diekmann F, et al. Dual-energy contrast-enhanced digital mammography: Initial clinical results of a multireader, multicase study. Breast Cancer Res. 2012;14(3):R94. doi: 10.1186/bcr3210. [DOI] [PMC free article] [PubMed] [Google Scholar]


