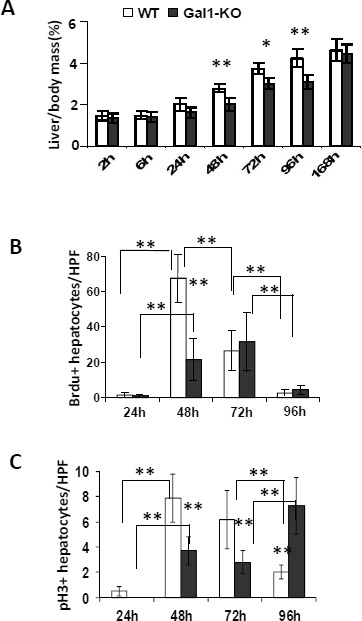
Figure 1. Delayed liver regeneration following PHx in Gal1-KO (Lgals1−/−) mice.

A. Liver-to-body weight ratios (%) in WT versus Gal1-KO mice at different time points following PHx. B. Quantification of the BrdU-positive hepatocyte nuclei at 24 to 96 hours following PHx. C. Quantification of hepatocyte nuclei positive for phosphorylated histone 3 (pH3) in regenerating livers post-PHx. B. and C. on “y” axis - average numbers of positive nuclei per one HPF; at least 10 HPFs were counted per each liver sample. Standard deviation and statistical significance (t-test) are shown: *, P < 0.05 and **, P < 0.005; 5 - 6 males per each experimental group.
