
Figure 8. Expression of c-FLIP was inversely correlated with miR-708 expression in renal cancer tissues.
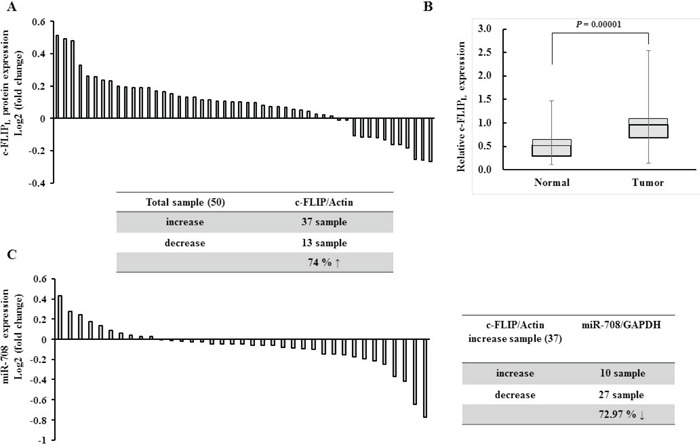
A. Relative c-FLIPL protein expression levels in RCC clinical specimens and patient-matched normal tissues as assessed by Western blotting. B. Relative c-FLIPL expression in normal versus tumor samples. Columns show c-FLIPL expression in all normal and tumor tissue samples. The bars represent the SD. C. Relative miR-708 expression in c-FLIPL overexpressing RCC clinical specimens and patient-matched normal tissues, as assessed by real-time PCR. The table summarizes relative c-FLIPL protein and miR-708 expression in the RCC specimens.