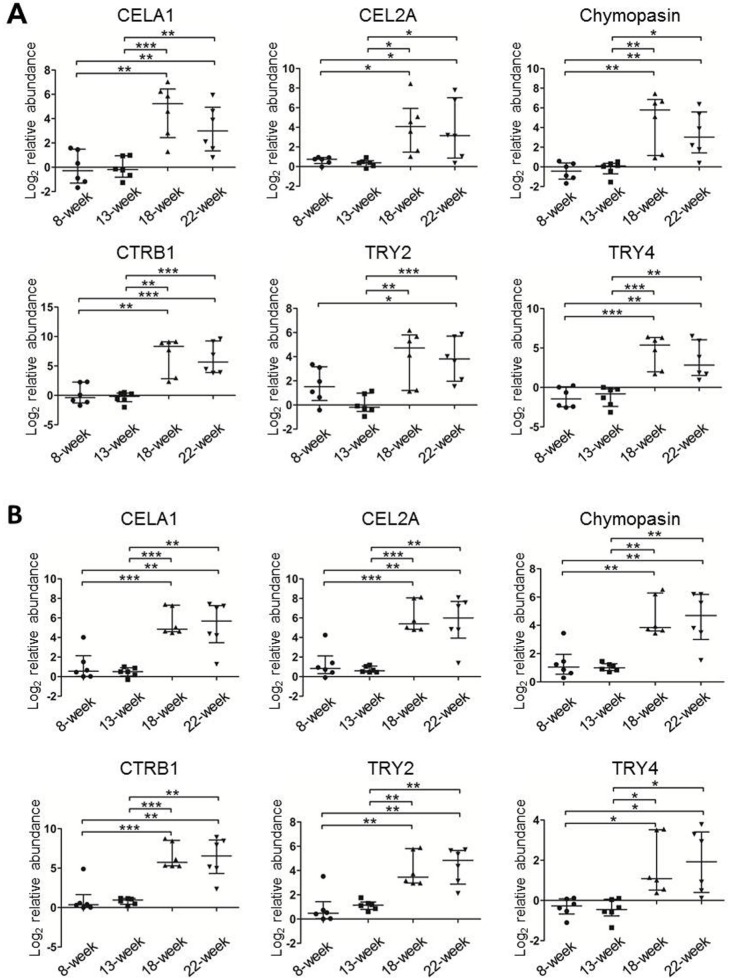
Figure 4. The relative protein levels of the six serine proteases in individual TIF (A) and serum (B) samples from ApcMin/+ mice (n=6/time point) measured using MRM.
The protein peak areas of one 13-week-old mouse and one 8-week-old mouse were used as the references for the TIF and serum samples, respectively. * p≤0.05, ** p≤0.01, *** p≤0.001 (Mann-Whitney U test). Bars, median with interquartile range.

