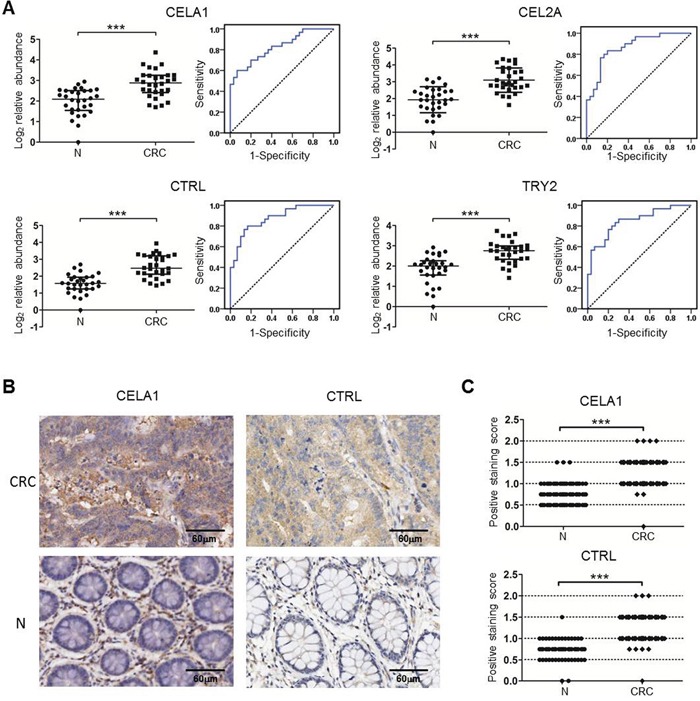
Figure 5. Verification of the serine proteases using MRM and TMA in individual human samples.

A. The relative protein levels and ROC curves of the four serine proteases in human sera based on an MRM analysis. The protein peak area of one healthy control was used as the reference. * p≤0.05, ** p≤0.01, *** p≤0.001 (Mann-Whitney U test). Bars, median with interquartile range. The solid lines in the ROC curves represent the plot of 1-specificity versus sensitivity. B-C. Representative images (B) and statistical analysis (C) of TMA detection of CELA1 and CTRL in 80 pairs of human CRC and their adjacent tissues (N). *** p≤0.001 (Paired-Samples T test).
