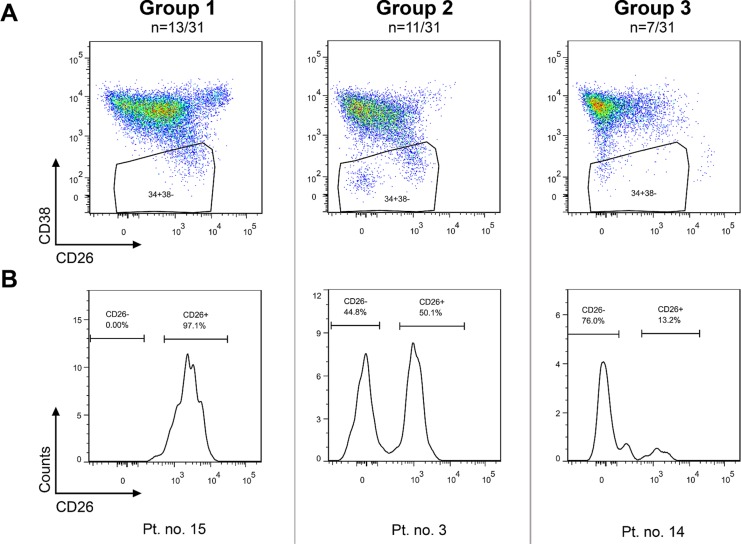
Figure 1. CP CML patients can be categorized into 3 groups based on CD26 expression pattern on CD45+34+38− SCs.
Group 1: dominant CD26+ SC population; Group 2 – comparable numbers (percentages) of CD26+ and CD26− SC populations; Group 3 – minor population of CD26+ SCs. The results for one representative patient per group are shown as dot plots (upper series) (A) and corresponding histograms (lower series) (B). Pt. no. – patient number.

