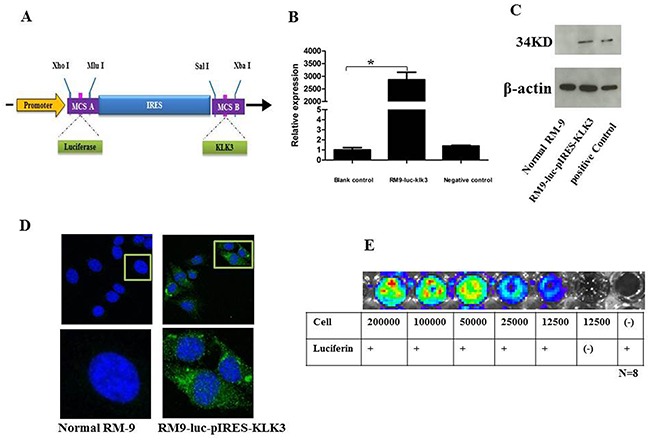
Figure 1. Construction and verification of the new recombinant cell line RM9-luc-pIRES-KLK3.

A. Schematic representation of the construction of plasmid Luc-pIRES-KLK3. Luc was obtained by enzyme digestion of plasmid pGL3-basic. KLK3 were obtained through RT-PCR. The IRES element was chosen to connect upstream Luc and downstream KLK3. Restriction enzyme cutting sites included Xho I, Mlu I, Sal I, and Xba I. RT-PCR, reverse transcription polymerase chain reaction; IRES, internal ribosome entry site; pCMV, cytomegalovirus promoter B. KLK3 mRNA expression level in RM9-Luc-pIRES-KLK3 cell line * vs. control, p < 0.001 C. Western blotting analysis for prostate specific antigen expression Normal RM9 cells served as negative control (left) and LNCaP cells served as positive control (right) for RM9-Luc-pIRES-KLK3 cells (middle). Beta-actin levels served as loading control. D. Immunofluorescence (IF) staining using PSA on RM9-Luc-pIRES-KLK3 cell line. PSA (green), cell nuclear (pseudo-colored blue). RM9 cells are stained as a negative control which shown on the left. Images were captured using a 40× oil objective. E. In vitro bioluminescence imaging of RM9-Luc-pIRES-KLK3 cells In a 96-well plate, cells were serially diluted from 200,000 to 12,500 cells. Luciferin 100 μl (150 μg/ml) was added to all wells, except for blank controls, and the plate was subjected to imaging for 1 min. Bioluminescence per well was quantified in photons per second. Expression was positively correlated with cell counts.
