

Abstract
Delays often occur between CLSI and FDA revisions of antimicrobial interpretive criteria. Using our Regional Healthcare Ecosystem Analyst (RHEA) simulation model, we found that the 32-month delay in changing carbapenem-resistant Enterobacteriaceae (CRE) breakpoints might have resulted in 1,821 additional carriers in Orange County, CA, an outcome that could have been avoided by identifying CRE and initiating contact precautions. Policy makers should aim to minimize the delay in the adoption of new breakpoints for antimicrobials against emerging pathogens when containment of spread is paramount; delays of <1.5 years are ideal.
INTRODUCTION
Delays often occur between the issuance of new diagnostic interpretive criteria for microbiology laboratories by standard-setting organizations, such as the Clinical and Laboratory Standards Institute (CLSI), and their adoption by the Food and Drug Administration (FDA) to inform breakpoints for the manufacturers of diagnostic tests. Delays occur due to the FDA's required regulatory processes and the necessity of generating data from pharmaceutical companies to support interpretive criteria changes. Quantifying the impact of such delays could help determine the value of addressing and rectifying their causes. A recent example is the 32- to 42-month delay (depending on the antimicrobial) between CLSI's release of more-sensitive criteria for diagnosing carbapenem-resistant Enterobacteriaceae (CRE), beginning with M100-S20 issuances in 2010, and the conveyance of these new criteria to manufacturers by the FDA (1). Such a delay could result in CRE transmission if CRE carriers are missed (because old criteria are still in use) and are not placed on contact precautions to reduce CRE spread (2). This is of concern because CRE are considered an urgent public health threat by the Centers for Disease Control and Prevention (CDC) (3), and few treatment options exist for CRE infection, which can result in high mortality. Using our Regional Healthcare Ecosystem Analyst (RHEA)-generated simulation model of Orange County, CA (OC) (4), we determined the impact of this delay on estimated (i.e., potential) CRE transmission within health care facilities.
MATERIALS AND METHODS
We used our previously described Regional Healthcare Ecosystem Analyst (RHEA) software platform (4–6) to generate a detailed agent-based model of Orange County, CA, which included detailed representations of all 28 acute-care hospitals (including 5 long-term acute-care facilities [LTACs]) and 74 free-standing nursing homes serving adult patients, along with the patients flowing among these locations and the community at large. We utilized the RHEA OC model to simulate the spread of CRE (7, 8) and the impact of changing CRE breakpoints in the early stages of OC's epidemic (years 4 to 5). Our model drew from detailed 2011–2012 OC patient-level data for adult inpatient hospital and nursing home admissions (9, 10). Table 1 shows key model inputs.
TABLE 1.
RHEA model input parameters, values, and sources
| Parameter | Valuea | Source or reference |
|---|---|---|
| Targeted point prevalence at yr 7 from CRE emergence in OC | ||
| In LTACs | 25 | 11–14 |
| In nursing homes | 8 | 26 |
| Ratio of carriers to clinical isolates | 8:1 | 15, 16, 27; M. Lin, Rush University, Chicago, IL, personal communication |
| Transmission coefficient | ||
| ICUs | 0.00025095 | Parameterized by model |
| Non-ICUs | 0.0001673 | Parameterized by model |
| LTACsb | 0.00467996 (0.00411885–0.00834316) | Parameterized by model |
| Nursing homesb | 0.000057895 (0–0.00053513) | Parameterized by model |
| Increased risk of readmission for CRE carriers on discharge | 80 | 22; D. Terashita, Los Angeles County Department of Public Health, Los Angeles, CA, personal communication |
| Persistent carriers (remaining colonized) | 30 | 28, 29 |
| Loss rate at 12 moc | 50 | 30 |
| Sensitivity of single rectal swabs | 70 | 20 |
| Screening test sensitivity | 91 (85–92) | 31–33 |
| Screening test specificity | 94 (89–97) | 31–33 |
| Test turnaround time (days) | 1 | 34 |
Values are percentages unless indicated otherwise.
The range represents the minimum and maximum coefficients across all facilities.
Assumes a linear loss for the remaining 70% of carriers that experience a loss rate.
Briefly, the model represents each patient with a computational agent. As in real life, each virtual patient moves from the community into a virtual facility, enters a unit/ward (stratified by intensive-care units [ICUs] and non-ICUs), and stays in one of the facility's patient beds for a period of time before being discharged to the community or to another facility. Actual 2011–2012 patient data from OC determined facility-specific admission rates, length of stay (LOS), and patient transfer probabilities among facilities, including instances when patients were shared between facilities after an intervening stay at home or elsewhere (9, 10). Once a patient is admitted to a facility, a probability draw determines which of that facility's wards/units the patient will enter, and a draw from a facility- and unit/ward-specific LOS distribution determines how long the patient will remain in the ward/unit and facility. Each patient could potentially harbor CRE based on estimates from hospital survey data and national literature (Table 1) (7, 8). CRE carriers draw from a CRE-specific LOS distribution (on average, 7.6 days longer than for noncarriers) generated from vancomycin-resistant enterococcus (VRE) carrier data in OC (9). While in a health care facility, a patient interacts with other patients directly or through health care workers. CRE carriers have a probability each day of transmitting CRE to other patients who do not have CRE, based on a unit- and facility-specific transmission coefficient (beta).
Our initial conditions assume a region of CRE naïveté (i.e., a region with no CRE cases in facilities or among recently discharged patients) at year zero, and our model is calibrated to reach a target CRE carriage prevalence of 25% in LTACs and 8% in nursing homes by year 7 after CRE introduction. These target prevalence estimates were based on regional surveillance data and published literature (11–15). We then parameterized the ICU and non-ICU ward betas (Table 1), taking OC data into account, so that CRE prevalence trends matched those currently seen in OC facilities based on epidemiologic surveys conducted in year 4 of CRE emergence (16).
We evaluated an intervention (i.e., active surveillance and contact precautions) that follows the CDC-recommended CRE toolkit (2). Scenarios entailed all hospitals and LTACs performing active rectal CRE surveillance for all direct transfers from another hospital or nursing home and placing patients who are known carriers or who newly test positive for CRE on contact precautions (a single room; gown and glove use for staff). We assumed that screening was performed by chromogenic agar (with a 1-day turnaround time) and that contact precautions had 50% effectiveness in reducing CRE transmission (a combination of the efficacy of personal protective equipment and health care worker compliance and appropriate use of the equipment) (17–19). We assumed that contact precaution status was relayed when patients were directly transferred between hospitals. Patients returning to a hospital where their CRE carriage status was previously known were automatically placed on contact precautions upon readmission. In nursing homes, only residents with CRE infections (assumed to be 50% of known CRE carriers) were placed on contact precautions for 10 days.
We compared surveillance scenarios using old breakpoints and new breakpoints for imipenem. We assumed that the sensitivity of a single rectal swab for CRE (70%) did not differ based on relative carbapenem resistance (20). The difference in the detection of CRE carriers was based on the impact of misclassification due to the old breakpoints (sensitivity, 76.3%; specificity, 99.7%) and new breakpoints (sensitivity, 90.1%; specificity, 97.3%) for imipenem. Our misclassification estimates were derived from MIC data for 18,283 isolates of Klebsiella spp., Enterobacter spp., and Escherichia coli collected globally and 464 clinical isolates (399 Klebsiella spp., 41 Enterobacter spp., and 24 E. coli isolates), collected as part of a 2012–2013 global surveillance study, that carried genes encoding serine- or metallo-beta-lactamases (see the supplemental material for details). These isolates were molecularly characterized using a combination of the Check-MDR CT101 microarray (Check-Points B.V., Wageningen, the Netherlands) and multiplex PCR assays (21). We used CRE rather than carbapenemase-producing Enterobacteriaceae (CPE) for the definition of breakpoints and as the main target of intervention. The reason for this choice is that in U.S. hospitals, clinical microbiology laboratory methods seek out CRE based on phenotypic criteria (i.e., identification of these resistant organisms using standard microbiologic techniques for antimicrobial susceptibility testing). Sensitivity analyses increased the sensitivity of the test for the old breakpoints by 5% and 10% (to 80.1% and 83.9%, respectively) to simulate the application of phenotypic carbapenemase detection assays (e.g., modified Hodge test [MHT], CarbaNP) to isolates that meet criteria short of phenotypic resistance. Each experimental scenario was run 50 times, each consisting of 1,000 Monte Carlo trials. The results reported are the means and distributions from each experiment and the differences and 95% confidence intervals (95% CI) of the difference between scenarios with the old and new breakpoints. The CRE prevalence presented is based on true CRE carriage status, regardless of identification.
RESULTS
Table 2 shows the CRE prevalence countywide and in acute-care hospitals, LTACs, and nursing homes for old and new breakpoints at 6-month intervals over 5 years. The difference in countywide prevalence between the old and new breakpoints does not become statistically significant until 8 months after use (0.008 [95% CI, 0.001 to 0.015]). The difference in CRE prevalence becomes more pronounced over time; at 2.5 years, the difference in prevalence was 0.038 (95% CI, 0.028 to 0.048). LTACs experienced the greatest reduction in CRE prevalence from the change in breakpoints, resulting from fewer transmission events due to contact precaution use among a larger number of identified carriers.
TABLE 2.
Simulated impact of changing diagnostic breakpoints on CRE prevalence countywide and by facility type in Orange County, CA, at half-year time points over a 5-year period
| Facility type and diagnostic breakpoints | CRE prevalencea at the following time (yr): |
|||||||||
|---|---|---|---|---|---|---|---|---|---|---|
| 0.5 | 1 | 1.5 | 2 | 2.5 | 3 | 3.5 | 4 | 4.5 | 5 | |
| Countywide (all facilities [n = 102]) | ||||||||||
| Old breakpoints | 1.25 (0.02) | 1.42 (0.02) | 1.62 (0.02) | 1.83 (0.02) | 2.05 (0.02) | 2.28 (0.02) | 2.53 (0.03) | 2.78 (0.03) | 3.04 (0.03) | 3.33 (0.03) |
| New breakpoints | 1.24 (0.02) | 1.41 (0.02)* | 1.60 (0.02)* | 1.80 (0.02)* | 2.01 (0.03)* | 2.23 (0.03)* | 2.47 (0.03)* | 2.70 (0.03)* | 2.96 (0.03)* | 3.23 (0.03)* |
| Acute-care hospitals (n = 23) | ||||||||||
| Old breakpoints | 0.36 (0.01) | 0.40 (0.01) | 0.45 (0.01) | 0.49 (0.01) | 0.55 (0.01) | 0.60 (0.01) | 0.65 (0.01) | 0.71 (0.01) | 0.77 (0.01) | 0.83 (0.01) |
| New breakpoints | 0.36 (0.00)* | 0.40 (0.01)* | 0.44 (0.01)* | 0.48 (0.01)* | 0.53 (0.01)* | 0.58 (0.01)* | 0.63 (0.01)* | 0.68 (0.01)* | 0.74 (0.01)* | 0.79 (0.01)* |
| LTACs (n = 5) | ||||||||||
| Old breakpoints | 3.65 (0.06) | 3.78 (0.07) | 3.91 (0.06) | 4.05 (0.06) | 4.19 (0.06) | 4.35 (0.06) | 4.51 (0.06) | 4.67 (0.06) | 4.83 (0.08) | 5.00 (0.06) |
| New breakpoints | 3.55 (0.05)* | 3.60 (0.06)* | 3.66 (0.05)* | 3.74 (0.05)* | 3.85 (0.05)* | 3.96 (0.05)* | 4.09 (0.06)* | 4.22 (0.07)* | 4.36 (0.07)* | 4.49 (0.05)* |
| Nursing homes (n = 74) | ||||||||||
| Old breakpoints | 1.53 (0.02) | 1.78 (0.02) | 2.04 (0.03) | 2.33 (0.03) | 2.63 (0.03) | 2.95 (0.03) | 3.29 (0.04) | 3.63 (0.04) | 3.99 (0.04) | 4.39 (0.04) |
| New breakpoints | 1.53 (0.02) | 1.77 (0.03) | 2.02 (0.03)* | 2.31 (0.03)* | 2.60 (0.04)* | 2.91 (0.04)* | 3.23 (0.04)* | 3.56 (0.04)* | 3.90 (0.05)* | 4.28 (0.05)* |
Expressed as a percentage (with the standard deviation in parentheses). Asterisks indicate that the difference between new breakpoints and old breakpoints is statistically significant.
Figure 1 shows the cumulative countywide number of CRE carriers over time (averaged over trajectories) by facility type. A 1 year delay would result in an average 264.2 additional carriers due to transmission (95% CI, −30.8 to 559.1) across all OC facilities. Differences were statistically significant at 1.5 years (the approximate length of the delay). Thus, delaying new-breakpoint use by 1.5 years resulted in an average of 618.1 (95% CI, 163.2 to 1,072.9) more CRE carriers countywide. A 2.5-year delay in using new breakpoints would have resulted in an average of 1,821.0 (95% CI, 1,009.6 to 2,632.4) more CRE carriers countywide. Even though the new breakpoints identified more existing CRE carriers, their identification resulted in fewer cases of transmission due to the use of contact precautions. Over a 5-year period, assuming contact precautions were promptly initiated, using the new breakpoints resulted in 8,497.9 fewer CRE carriers countywide (95% CI, 6,560.4 to 10,435.4) than if the delay had occurred. These figures correspond to averages of 7, 13, 31, and 106 fewer transmission events in all health care facilities countywide by use of the new breakpoints over 1-, 1.5-, 2.5-, and 5-year periods, respectively. A 2.5-year delay in implementing new breakpoints resulted in a total of 261 (95% CI, 198 to 323) additional carriers among acute-care hospitals, 659 (95% CI, 600.3 to 717.5) additional carriers among LTACs, and 901 (95% CI, 171 to 1,631) additional carriers among nursing homes (2%, 5%, and 1% increases in the numbers of CRE carriers, respectively). The impact in OC by facility type can be determined by taking the difference between the number of carriers with the old and new breakpoints at a given point in time.
FIG 1.
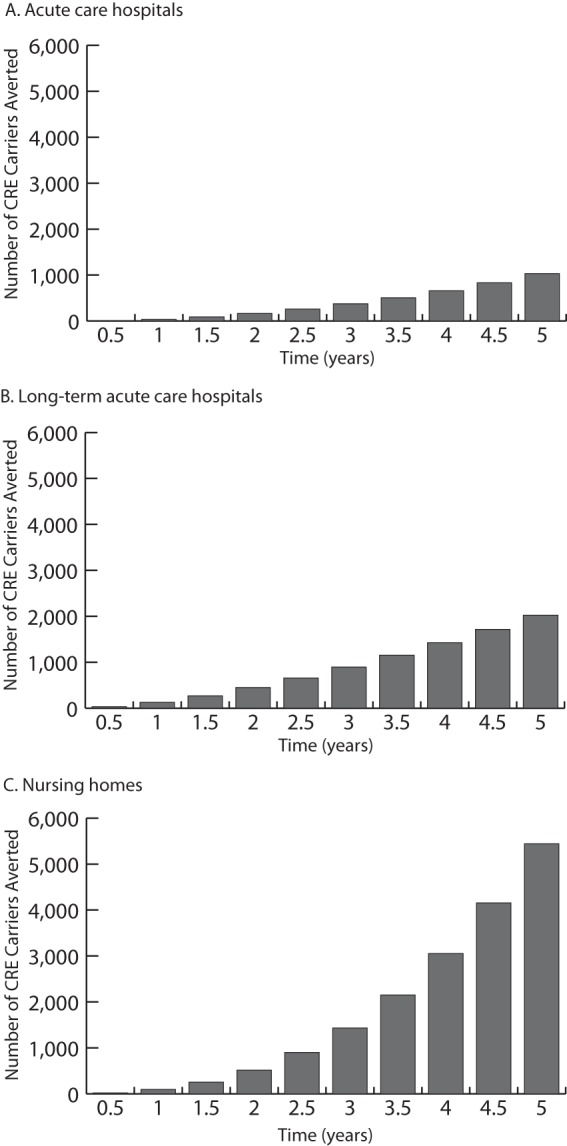
Simulated impact of changing diagnostic breakpoints on the cumulative total number of CRE carriers averaged over trajectories by facility type in Orange County, CA, at half-year intervals over a 5-year period.
Decreasing the difference between the old and new breakpoints (i.e., increasing old-breakpoint sensitivity by 5% and 10%) had little impact on the prevalence of CRE with the delay in new-breakpoint use. Both resulted in a statistically significant difference in countywide prevalence after 8 months of use (0.009 [95% CI, 0.016 to 0.001] with a 5% increase and 0.008 [95% CI, 0.015 to 0.001] with a 10% increase), which became more pronounced over time (0.034 [95% CI, 0.045 to 0.023] with a 5% increase at 2.5 years). Likewise, the difference in the cumulative number of countywide carriers remained statistically significant at 1.5 years (the approximate length of the delay) for both increases in old-breakpoint sensitivity evaluated. Delaying new-breakpoint use by 1.5 years resulted in an average of 593.9 (95% CI, 120.9 to 1,066.9) or 545.4 (95% CI, 97.9 to 1,580.5) more CRE carriers countywide with a 5% or 10% increase in old-breakpoint sensitivity, respectively.
DISCUSSION
Our model indicated that the delay between CLSI and FDA revisions of antimicrobial interpretive criteria likely resulted in a statistically significant increase in CRE cases due to ongoing transmission. While the number may not seem large, delays (from 1 to 5 years) resulted in 264 to 8,498 additional CRE carriers countywide, which could have been avoided had the delay not occurred. Decreasing the difference between the sensitivities of the old and new breakpoints, representing additional testing, had little impact on the CRE epidemiology for the various delays. LTACs, which are well known epidemiologically as focal points for concentrating CRE (12, 22), would experience the greatest reduction in CRE prevalence with the new breakpoints, due to the use of contact precautions on a great number of identified carriers. The effects on LTACs are due to their having greater importation of CRE among admitted patients, generally higher transmission coefficients (calibrated based on studies in the literature [11–14]), longer patient LOS, smaller sizes (e.g., bed capacity), and substantial interconnectivity with other facilities. Although nursing homes did not perform surveillance testing, they do experience a decrease in prevalence due to the downstream effect of increased carrier detection leading to contact precautions that reduce transmission.
Assuming nationwide conditions similar to those that we modeled in OC, the shortest delay between issuances could have prevented thousands of CRE transmission events. These delays have important ramifications, especially since CRE pose an urgent public health threat, are difficult to treat, and are associated with high mortality (3). If CRE prevalence were higher before the new breakpoints were implemented, the impact would be even greater, since more CRE carriers would be identified and placed on contact precautions, thus preventing more transmission events. The new CRE cases generated by delays could, in turn, affect the economy in several ways. First these CRE infections would consume medical resources such as personnel time, procedures, antibiotics, and other costs. Second, infections could lead to absenteeism and presenteeism productivity losses for patients and caregivers. Third, premature mortality resulting from CRE would also lead to productivity losses. It should be noted that while more-sensitive diagnostic criteria reduce overall CRE prevalence (due to reduced transmission following higher levels of detection and contact precaution use), interpretative criteria should not become too inclusive and should remain clinically relevant for appropriate care and antibiotic use.
Policy makers should aim to minimize the delay in the adoption of new breakpoints for antimicrobials. Streamlining the process for updating breakpoints could reduce this delay and the need for clinical laboratories to perform their own validation of new breakpoints, since the laboratory equipment on which assays are run is FDA regulated and is developed using interpretive criteria issued by the FDA. As of this writing, equipment manufacturers (e.g., bioMérieux [Vitek 2] and Beckman Coulter [MicroScan]) have not installed software containing the revised FDA breakpoints. Thus, even when the FDA and CLSI have set interpretive criteria, there may be continued underreporting of CRE if manufacturers have not released software with the new FDA/CLSI breakpoints (23). In the absence of streamlining, laboratories may want to consider implementing new sensitivity criteria when they are released by the CLSI. While there will always be delays while technologies catch up to guideline changes, the overall time should be minimized; under the conditions modeled, delays of <1.5 years would be ideal, since new breakpoints do not result in a statistically significant impact until then.
We attempted to be conservative in estimating the impact of breakpoint delays. While our estimates for the sensitivity and specificity of the old breakpoints did not account for supplemental laboratory testing methods (e.g., MHT, PCR testing), we did conduct a sensitivity analysis to estimate the potential impact of increasing sensitivity using supplemental testing methodologies. Additionally, we did not evaluate the impact of different chromogenic agars missing certain resistance mechanisms, since this would affect the old and new breakpoints in the same way, and the incremental difference between them would be relatively unchanged. We chose to model the sensitivity and specificity associated with imipenem rather than those associated with meropenem, which were slightly higher (sensitivity, 91.6%; specificity, 99.3%). We did not assume differential transmission in CRE-infected versus CRE-colonized patients. Additionally, our spontaneous CRE loss rate and persistent carriage rate may be undervalued, since persistent carriers are typically detected using rectal swabs. The sensitivity of such swabs is dependent on the detectable levels of CRE; they are not efficient at detecting CRE that may still be present at very low levels. Thus, CRE carriage could be longer, allowing for more transmission and worse outcomes of delays in interpretive criteria.
Our analysis is subject to several limitations. First, we assumed that the delay in implementing the new breakpoints was uniform across all facilities. Manufacturers must use FDA breakpoints, although it is possible that a subset of laboratories could have performed independent verification studies to implement CLSI breakpoints ahead of FDA breakpoint changes. However, a survey of members of the Emerging Infections Network and a survey of microbiology laboratories in Rhode Island suggest that a minority of facilities surveyed implemented such changes (24, 25). Second, our results depict the “true” number of CRE carriers and show a decrease in CRE prevalence after more-sensitive interpretative criteria are implemented and patients are appropriately placed on contact precautions. It is important to keep in mind that because a higher proportion of cases are detected after the implementation of a more-sensitive breakpoint, there would likely be a surveillance artifact showing an increase in total CRE carriers detected. Additionally, we did not include the potential for CRE carriers to be placed on contact precautions for other reasons (e.g., cocolonization). Third, all models are simplifications of real life and as such cannot represent every CRE event or outcome. Our model considers only CRE carriers and does not explicitly represent CRE infection (apart from those found via clinical cultures and our nursing home assumption) separately from colonization. In this model, those with CRE colonization did not convert to CRE infection; thus, we are unable to determine the difference between breakpoints on infection versus colonization. While we did use CRE carriage as the primary outcome measure, raising the prevalence of CRE colonization could raise the incidence of CRE infection. It is possible that clinically apparent CRE infections increase transmission. However, placing patients on contact precautions could also reduce this increase, and currently there are a dearth of data on how such infections affect transmission. Our model does not include comorbidities that may affect CRE transmission. We modeled a region in the early stages of a CRE epidemic (years 4 to 5 in a region of naïveté) and did not fully explore the impact of breakpoint changes at later stages or in a setting of higher endemicity. We assumed that all hospitals employed CRE control measures; in reality, this may not be the case. It should be noted that in the absence of CRE-specific LOS data, we used VRE LOS data as a proxy, and VRE likely has a lower mortality rate than CRE. Additionally, our model does not include pediatric facilities (or their patients) or account for effects on health care facilities outside OC.
Conclusions.
Delays in the issuance of new interpretive criteria can lead to statistically significant increases in the number of CRE cases, potentially resulting in 1,821 additional CRE carriers in Orange County, CA, for a 32-month delay. While there will always be delays while technologies catch up, policy makers should aim to minimize the overall length of delays in the adoption of new breakpoints for antimicrobials.
Supplementary Material
ACKNOWLEDGMENTS
This work was supported by the Agency for Healthcare Research and Quality (AHRQ) via grant R01HS023317, by the National Institute of Child Health and Human Development (NICHD) and the Global Obesity Prevention Center (GOPC) via grant U54HD070725, and by NICHD via grant U01 HD086861. The University of Pittsburgh Center for Simulation and Modeling provided supercomputing resources for the project. Programmer analyst time was supported in part by the CDC under an intergovernmental personnel act. The funders had no role in the design and conduct of the study; the collection, management, analysis, and interpretation of the data; or the preparation, review, or approval of the manuscript.
The findings and conclusions in this report are those of the authors and do not necessarily represent the official position of the Centers for Disease Control and Prevention.
S.S.H. conducts studies in participating hospitals and nursing homes that receive contributed products from Sage Products, Molnlycke, 3M, and Clorox. All other authors are not aware of any significant conflict of interest.
Footnotes
Supplemental material for this article may be found at http://dx.doi.org/10.1128/JCM.00635-16.
REFERENCES
- 1.Humphries RM, Hindler JA. 29 March 2016. Emerging resistance, new antimicrobial agents … but no tests! The challenge of antimicrobial susceptibility testing in the current US regulatory landscape. Clin Infect Dis doi: 10.1093/cid/ciw201. [DOI] [PubMed] [Google Scholar]
- 2.Centers for Disease Control and Prevention. 2012. Guidance for control of carbapenem-resistant Enterobacteriaceae (CRE): 2012 CRE toolkit. Centers for Disease Control and Prevention, National Center for Emerging and Zoonotic Infectious Diseases, Division of Healthcare Quality and Promotion, Atlanta, GA. [Google Scholar]
- 3.Centers for Disease Control and Prevention. 2013. Antibiotic resistance threats in the United States, 2013. Centers for Disease Control and Prevention, Atlanta, GA: http://www.cdc.gov/drugresistance/pdf/ar-threats-2013-508.pdf. [Google Scholar]
- 4.Lee BY, Wong KF, Bartsch SM, Yilmaz SL, Avery TR, Brown ST, Song Y, Singh A, Kim DS, Huang SS. 2013. The Regional Healthcare Ecosystem Analyst (RHEA): simulation modeling tool to assist infectious disease control in a health system. J Am Med Inform Assoc 20:e139–146. doi: 10.1136/amiajnl-2012-001107. [DOI] [PMC free article] [PubMed] [Google Scholar]
- 5.Lee BY, Bartsch SM, Wong KF, Yilmaz SL, Avery TR, Singh A, Song Y, Kim DS, Brown ST, Potter MA, Platt R, Huang SS. 2012. Simulation shows hospitals that cooperate on infection control obtain better results than hospitals acting alone. Health Affairs 31:2295–2303. doi: 10.1377/hlthaff.2011.0992. [DOI] [PMC free article] [PubMed] [Google Scholar]
- 6.Lee BY, Singh A, Bartsch SM, Wong KF, Kim DS, Avery TR, Brown ST, Murphy CR, Yilmaz SL, Huang SS. 2013. The potential regional impact of contact precaution use in nursing homes to control methicillin-resistant Staphylococcus aureus. Infect Control Hosp Epidemiol 34:151–160. doi: 10.1086/669091. [DOI] [PMC free article] [PubMed] [Google Scholar]
- 7.Slayton RB, Toth D, Lee BY, Tanner W, Bartsch SM, Khader K, Wong KF, Brown K, McKinnell JA, Ray W, Miller LG, Rubin M, Kim DS, Adler F, Cao C, Stone NTB, Kallen AJ, Samore MH, Huang SS, Fridkin SK, Jernigan JA. 2015. Vital signs: estimated effects of coordinated action to reduce antibiotic-resistant infections in health care facilities—United States. MMWR Morb Mortal Wkly Rep 64:826–831. doi: 10.15585/mmwr.mm6430a4. [DOI] [PMC free article] [PubMed] [Google Scholar]
- 8.Lee BY, Bartsch SM, Wong KF, McKinnell JA, Slayton RB, Miller LG, Cao C, Kim DS, Kallen AJ, Jernigan JA, Huang SS. 1 March 2016. The potential trajectory of carbapenem-resistant Enterobacteriaceae, an emerging threat to health-care facilities, and the impact of the Centers for Disease Control and Prevention toolkit. Am J Epidemiol doi: 10.1093/aje/kwv299. [DOI] [PMC free article] [PubMed] [Google Scholar]
- 9.Office of Statewide Health Planning and Development. September 2014. California inpatient data reporting manual. MIRCal (Medical Information Reporting for California), 7th ed, version 8.3 Office of Statewide Health Planning and Development, Sacramento, CA. [Google Scholar]
- 10.Centers for Medicare and Medicaid Services. 2014. Long Term Care Minimum Data Set. https://www.cms.gov/Research-Statistics-Data-and-Systems/Files-for-Order/IdentifiableDataFiles/LongTermCareMinimumDataSetMDS.html.
- 11.Bhargava A, Hayakawa K, Silverman E, Haider S, Alluri KC, Datla S, Diviti S, Kuchipudi V, Muppavarapu KS, Lephart PR, Marchaim D, Kaye KS. 2014. Risk factors for colonization due to carbapenem-resistant Enterobacteriaceae among patients exposed to long-term acute care and acute care facilities. Infect Control Hosp Epidemiol 35:398–405. doi: 10.1086/675614. [DOI] [PubMed] [Google Scholar]
- 12.Lin MY, Lyles-Banks RD, Lolans K, Hines DW, Spear JB, Petrak R, Trick WE, Weinstein RA, Hayden MK. 2013. The importance of long-term acute care hospitals in the regional epidemiology of Klebsiella pneumoniae carbapenemase-producing Enterobacteriaceae. Clin Infect Dis 57:1246–1252. doi: 10.1093/cid/cit500. [DOI] [PMC free article] [PubMed] [Google Scholar]
- 13.Munoz-Price LS, Hayden MK, Lolans K, Won S, Calvert K, Lin MY, Stemer A, Weinstein RA. 2010. Successful control of an outbreak of Klebsiella pneumoniae carbapenemase-producing K. pneumoniae at a long-term acute care hospital. Infect Control Hosp Epidemiol 31:341–347. doi: 10.1086/651097. [DOI] [PubMed] [Google Scholar]
- 14.Prabaker K, Lin MY, McNally M, Cherabuddi K, Ahmed S, Norris A, Lolans K, Odeh R, Chundi V, Weinstein RA, Hayden MK. 2012. Transfer from high-acuity long-term care facilities is associated with carriage of Klebsiella pneumoniae carbapenemase-producing Enterobacteriaceae: a multihospital study. Infect Control Hosp Epidemiol 33:1193–1199. doi: 10.1086/668435. [DOI] [PMC free article] [PubMed] [Google Scholar]
- 15.Hayden MK, Lin MY, Lolans K, Weiner S, Blom D, Moore NM, Fogg L, Henry D, Lyles R, Thurlow CJ, Sikka M, Weinstein RA. 2015. Prevention of colonization and infection by Klebsiella pneumoniae carbapenemase-producing Enterobacteriaceae in long-term acute-care hospitals. Clin Infect Dis 60:1153–1161. doi: 10.1093/cid/ciu1173. [DOI] [PMC free article] [PubMed] [Google Scholar]
- 16.Gohil SK, Singh RD, Gombosev A, Zahn M, Cheung M, Chang J, Huang SS, for Project MAPP and the Orange County APIC Chapter. 2014. Emergence of carbapenem-resistant Enterobacteriaceae (CRE) in Orange County, CA and support for regional strategies to limit spread. Open Forum Infect Dis 1(Suppl 1):S140. doi: 10.1093/ofid/ofu052.219. [DOI] [Google Scholar]
- 17.Clock SA, Cohen B, Behta M, Ross B, Larson EL. 2010. Contact precautions for multidrug-resistant organisms: current recommendations and actual practice. Am J Infect Control 38:105–111. doi: 10.1016/j.ajic.2009.08.008. [DOI] [PMC free article] [PubMed] [Google Scholar]
- 18.Golan Y, Doron S, Griffith J, El Gamal H, Tanios M, Blunt K, Barefoot L, Bloom J, Gamson K, Snydman LK, Hansjosten K, Elnekave E, Nasraway SA, Snydman DR. 2006. The impact of gown-use requirement on hand hygiene compliance. Clin Infect Dis 42:370–376. doi: 10.1086/498906. [DOI] [PubMed] [Google Scholar]
- 19.Weber DJ, Sickbert-Bennett EE, Brown VM, Brooks RH, Kittrell IP, Featherstone BJ, Adams TL, Rutala WA. 2007. Compliance with isolation precautions at a university hospital. Infect Control Hosp Epidemiol 28:358–361. doi: 10.1086/510871. [DOI] [PubMed] [Google Scholar]
- 20.Lewis JD, Enfield KB, Mathers AJ, Giannetta ET, Sifri CD. 2015. The limits of serial surveillance cultures in predicting clearance of colonization with carbapenemase-producing Enterobacteriaceae. Infect Control Hosp Epidemiol 36:835–837. doi: 10.1017/ice.2015.57. [DOI] [PubMed] [Google Scholar]
- 21.Lob SH, Kazmierczak KM, Badal RE, Hackel MA, Bouchillon SK, Biedenbach DJ, Sahm DF. 2015. Trends in susceptibility of Escherichia coli from intra-abdominal infections to ertapenem and comparators in the United States according to data from the SMART program, 2009 to 2013. Antimicrob Agents Chemother 59:3606–3610. doi: 10.1128/AAC.05186-14. [DOI] [PMC free article] [PubMed] [Google Scholar]
- 22.Marquez P, Terashita D. 2013. Long-term acute care hospitals and carbapenem-resistant Enterobacteriaceae: a reservoir for transmission. Clin Infect Dis 57:1253–1255. doi: 10.1093/cid/cit501. [DOI] [PubMed] [Google Scholar]
- 23.Humphries RM, McKinnell JA. 2015. Continuing challenges for the clinical laboratory for detection of carbapenem-resistant Enterobacteriaceae. J Clin Microbiol 53:3712–3714. doi: 10.1128/JCM.02668-15. [DOI] [PMC free article] [PubMed] [Google Scholar]
- 24.Kallen AJ, Beekman SE, Limbago B, Lentnek AL, Polgreen PM, Patel J, Srinivasan A. 2011. Prevalence of beta-lactam nonsusceptible Gram-negative bacilli and use and interpretation of current susceptibility breakpoints: a survey of infectious disease physicians. Diagn Microbiol Infect Dis 71:316–319. doi: 10.1016/j.diagmicrobio.2011.07.013. [DOI] [PubMed] [Google Scholar]
- 25.Alexander NE, Vanner C, Baier RR, Chapin KC, Mermel LA. 2013. Impact of non-FDA-approved CLSI breakpoint criteria on laboratory carbapenem-resistant Enterobacteriaceae detection practices: a state-wide assessment, abstr 154. Abstr Council State Territorial Epidemiol Annu Conf, Pasadena, CA, 9 to 13 June 2013. [Google Scholar]
- 26.Ben-David D, Masarwa S, Navon-Venezia S, Mishali H, Fridental I, Rubinovitch B, Samollan G, Carmeli Y, Schwaber MJ. 2011. Carbapenem-resistant Klebsiella pneumoniae in post-acute-care facilities in Israel. Infect Control Hosp Epidemiol 32:845–853. doi: 10.1086/661279. [DOI] [PubMed] [Google Scholar]
- 27.Pisney LM, Barron MA, Kassner E, Havens D, Madinger NE. 2014. Carbapenem-resistant Enterobacteriaceae rectal screening during an outbreak of New Delhi metallo-β-lactamase producing Klebsiella pneumoniae at an acute care hospital. Infect Control Hosp Epidemiol 35:434–436. doi: 10.1086/675597. [DOI] [PubMed] [Google Scholar]
- 28.O'Fallon E, Gautam S, D'Agata EMC. 2009. Colonization with multidrug-resistant gram-negative bacteria; prolonged duration and frequent co-colonization. Clin Infect Dis 48:1375–1381. doi: 10.1086/598194. [DOI] [PubMed] [Google Scholar]
- 29.Feldman N, Adler A, Molshatzki N, Navon-Venezia S, Khabra E, Cohen D, Carmeli Y. 2013. Gastrointestinal colonization by KPC-producing Klebsiella pneumoniae following hospital discharge: duration of carriage and risk factors for persistent carriage. Clin Microbiol Infect 19:E190–E196. doi: 10.1111/1469-0691.12099. [DOI] [PubMed] [Google Scholar]
- 30.Zimmerman FS, Assous MV, Bdolah-Abram T, Lachish T, Yinnon AM, Wiener-Well Y. 2013. Duration of carriage of carbapenem-resistant Enterobacteriaceae following hospital discharge. Am J Infect Control 41:190–194. doi: 10.1016/j.ajic.2012.09.020. [DOI] [PubMed] [Google Scholar]
- 31.Vrioni G, Daniil I, Voulgari E, Ranellou K, Koumaki V, Ghirardi S, Kimouli M, Zambardi G, Tsakris A. 2012. Comparative evaluation of a prototype chromogenic medium (ChromID Carba) for detecting carbapenemase-producing Enterobacteriaceae in surveillance rectal swabs. J Clin Microbiol 50:1841–1846. doi: 10.1128/JCM.06848-11. [DOI] [PMC free article] [PubMed] [Google Scholar]
- 32.Wilkinson KM, Winstanley TG, Lanyon C, Cummings SP, Raza MW, Perry JD. 2012. Comparison of four chromogenic culture media for carbapenemase-producing Enterobacteriaceae. J Clin Microbiol 50:3102–3104. doi: 10.1128/JCM.01613-12. [DOI] [PMC free article] [PubMed] [Google Scholar]
- 33.Adler A, Navon-Venezia S, Moran-Gilad J, Marcos E, Schwartz D, Carmeli Y. 2011. Laboratory and clinical evaluation of screening agar plates for detection of carbapenem-resistant Enterobacteriaceae from surveillance rectal swabs. J Clin Microbiol 49:2239–2242. doi: 10.1128/JCM.02566-10. [DOI] [PMC free article] [PubMed] [Google Scholar]
- 34.Nordmann P, Poirel L, Dortet L. 2012. Rapid detection of carbapenemase-producing Enterobacteriaceae. Emerg Infect Dis 18:1503–1507. doi: 10.3201/eid1809.120355. [DOI] [PMC free article] [PubMed] [Google Scholar]
Associated Data
This section collects any data citations, data availability statements, or supplementary materials included in this article.