
Fig. 4.
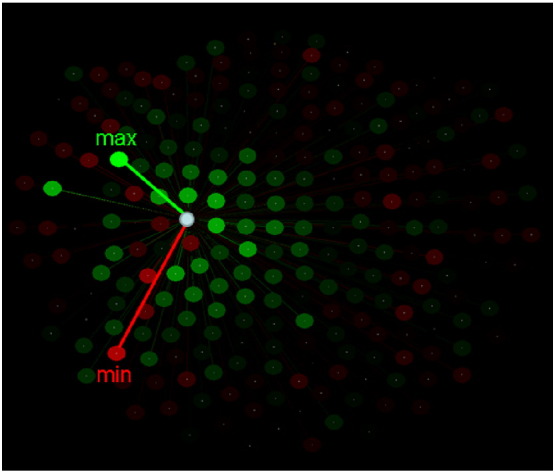
Spatial distribution of SNIs of a single sensor (white circle) to illustrate the maximum and minimum SNI. Color intensity is proportional to the absolute SNI value. Green and red correspond to positive and negative SNIs, respectively.
Official websites use .gov
A
.gov website belongs to an official
government organization in the United States.
Secure .gov websites use HTTPS
A lock (
) or https:// means you've safely
connected to the .gov website. Share sensitive
information only on official, secure websites.
Spatial distribution of SNIs of a single sensor (white circle) to illustrate the maximum and minimum SNI. Color intensity is proportional to the absolute SNI value. Green and red correspond to positive and negative SNIs, respectively.