

Abstract
Clostridium phoceensis sp. nov., strain GD3T (= CSUR P1929 = DSM 100334) is the type strain of C. phoceensis sp. nov., a new species within the genus Clostridium. This strain was isolated from the gut microbiota of a 28-year-old healthy French man. C. phoceensis is a Gram-negative, spore-forming, nonmotile, strictly anaerobic bacterium. We describe its complete genome sequence and annotation, together with its phenotypic characteristics.
Keywords: Anaerobe, Clostridium phoceensis, culturomics, gut microbiota, taxono-genomics
Introduction
Human adult gut microbiota is estimated to consist of up to 100 trillion microorganisms, comprising at least 500 different species, mostly anaerobic bacteria [1]. Although the advent of modern molecular microbiological methods has expanded the degree of bacterial detection from stool samples, it does not allow for the phenotypic description of new living species [2]. Consequently, there has been renewed interest in culture methods [3].
A new taxonomic approach known as taxonogenomics has recently been proposed to describe new isolated bacterial species [4]. This polyphasic strategy combines phenotypic characteristics, the matrix-assisted laser desorption/ionization time-of-flight mass spectrometry (MALDI-TOF MS) spectrum, and the analysis and comparison of the complete genome sequence.
Since the creation of the genus Clostridium in 1880, more than 200 species have been described [5]. While species belonging to the family Clostridiaceae are mainly associated with the commensal digestive flora of mammals and can be commonly found in the environment, some are major human pathogens, including toxigenic Clostridium botulinum, Peptoclostridium difficile, Clostridium tetani and Clostridium perfringens [6].
We propose Clostridium phoceensis sp. nov., strain GD3T (= CSUR P1929 = DSM 100334) as the type strain of C. phoceensis sp. nov., a new species within the genus Clostridium. This strain was isolated from the gut microbiota of a 28-year-old healthy French man as part of a culturomics study aiming at individually cultivating all bacterial species from a stool sample. Here we describe the characteristics of C. phoceensis sp. nov. strain GD3T, including its phenotype and genome sequence.
Materials and Methods
Sample collection
The stool sample was taken from a 28-year-old healthy French man. The sample was collected as part of a research study on the human gut microbiota. The study was approved by the Institut Fédératif de Recherche 48 (agreement no. 09-022, Marseille, France), and the patient's consent was obtained. The sample was stored at −80°C in La Timone Hospital (Marseille, France).
Strain isolation and identification (MALDI-TOF MS and 16S rRNA sequencing)
The faecal sample was treated using the concept of culturomics [7]. The colonies obtained were identified using MALDI-TOF MS [8], [9] (Bruker Daltonics, Leipzig, Germany) and analysed using a Microflex spectrometer (Bruker), leading to the protein spectrum being obtained. A score under 1.7 did not enable any identification. Subsequently, 16S rRNA was sequenced and the sequence was matched using BLAST (Basic Local Alignment Search Tool) against the National Center for Biotechnology Information database [10]. DNA was extracted using the EZ1 Tissue Extraction Kit (Qiagen, Hilden, Germany), and sequences were aligned using ChromasPro 1.6 (Technelysium, South Brisbane, Queensland, Australia).
Growth conditions
The growth condition of the strain was determined by testing different temperatures and atmospheres. Five growth temperatures (ambient, 28, 37, 45 and 56°C) were tested under anaerobic (GENbag anaer) microaerophilic atmospheres (GENbag microer) (bioMérieux, Marcy l’Étoile, France) and aerobic condition on 5% sheep's blood agar (bioMérieux). Colonies were obtained after thermal shock for 20 minutes at 80°C in an anaerobic blood culture bottle (Bactec Lytic/10 Anaerobic/F) supplemented with 5% sheep's blood at 37°C.
Phenotypic, biochemical and antibiotic susceptibility tests
Gram staining, motility, catalase and oxidase were determined as described by Lagier et al. [3]. Sporulation was tested using a thermal shock on bacterial colonies (diluted in phosphate-buffered saline) for 10 minutes at 80°C. The biochemical characteristics were tested using API 50CH, API ZYM and API 20A strips (bioMérieux). Antibiotic susceptibility referred to European Committee on Antimicrobial Susceptibility Testing 2015 recommendations.
Fatty acid methyl ester (FAME) analysis by gas chromatography/mass spectrometry (GC/MS)
FAME analysis was performed by GC/MS. Two samples were prepared with 2 mg of bacterial biomass from several culture plates. Two samples were prepared with approximately 2 mg of bacterial biomass per tube collected from several culture plates. FAMEs were prepared as described by Sasser (http://www.midi-inc.com/pdf/MIS_Technote_101.pdf). GC/MS analyses were carried out as described by Dione et al. [11]. Briefly, FAMEs were separated using an Elite 5-MS column and monitored by mass spectrometry (Clarus 500-SQ8S; PerkinElmer, Courtaboeuf, France). A spectral database search was performed using MS Search 2.0 operated using the Standard Reference Database 1A (National Institute of Standards and Technology, Gaithersburg, MD, USA) and the FAME mass spectral database (Wiley, Chichester, UK).
Microscopy
Individual cells of C. phoceensis strain GD3T were captured using a Tecnai G20 electron microscopy (FEI Company, Limeil-Brevannes, France). A Color Gram 2 Kit (bioMérieux) was used to perform the Gram coloration observed with a 100× oil-immersion objective lens using the DM1000 photonic microscope (Leica, Wetzlar, Germany) [12], [13].
Genome project history
The organism was selected for sequencing because it had been isolated from a healthy person for the first time and on the basis of its 16S rRNA similarity, phylogenetic position and phenotypic differences with other members of the genus Clostridia. The GenBank accession number is CVUG01000000 and consists of 10 scaffolds with a total of 16 contigs [14].
Genome sequencing and assembly
The genomic DNA of Clostridium phoceensis GD3T was sequenced on the MiSeq sequencer (Illumina, San Diego, CA, USA) using the mate-pair strategy. The gDNA was barcoded in order to be mixed with 11 other projects using the Nextera mate-pair sample prep kit (Illumina). The mate-pair library was prepared with 1.5 μg of genomic DNA using the Nextera Mate-Pair Illumina guide. The gDNA sample was simultaneously fragmented and tagged using a mate-pair junction adapter. The pattern of the fragmentation was validated on an Agilent 2100 BioAnalyzer (Agilent Technologies, Santa Clara, CA, USA) with a DNA 7500 lab chip. The DNA fragments ranged in size from 1 to 10 kb, with an optimal size of 4.490 kb. No size selection was performed, and only 600 ng of tagmented fragments were circularized. The circularized DNA was mechanically sheared to small fragments with an optimal size of 938 bp on the Covaris S2 device in microtubes (Covaris, Woburn, MA, USA). The library profile was visualized on a High Sensitivity Bioanalyzer LabChip (Agilent Technologies), and the final library concentration was measured at 4.457 nmol/L. The libraries were normalized at 2 nM and pooled. After a denaturation step and dilution at 15 pM, the pool of libraries was loaded onto the reagent cartridge and then onto the instrument along with the flow cell. Automated cluster generation and sequencing run were performed in a single 39-hour run in a 2 × 251 bp; 6.1 Gb of total information was obtained from a 653K/mm2 cluster density, with a cluster passing quality control filters of 96.1% (12 031 000 clusters). Within this run, the index representation for C. phoceensis GD3T was determined to 9.32%. The 1 121 200 paired reads were filtered according to the read qualities. These reads were trimmed, then assembled by SPDES software. Finally, the draft genome of C. phoceensis GD3T consisted of ten scaffolds with 16 contigs and generated a genome size of 3.4 Mb with 59.32% G+C content.
Genome annotation
Open reading frames (ORFs) were predicted using Prodigal [15] with default parameters, although the predicted ORFs were excluded if they spanned a sequencing gap region. The predicted bacterial protein sequences were searched against the GenBank database [16] and the Clusters of Orthologous Groups (COGs) databases using BLASTP. The tRNA genes were found using the tRNAScanSE tool [17], while RNAmmer [18] was used to find ribosomal RNAs and BLASTn against the GenBank database. Lipoprotein signal peptides and the number of transmembrane helices were predicted using SignalP [19] and TMHMM [20] respectively. Artemis [21] was used for data management, and DNA Plotter [22] was used to visualize genomic features. To estimate the mean level of nucleotide sequence similarity at the genome level, we used homemade average genomic identity of orthologous gene sequences (AGIOS) software [4].
Results
Strain isolation, identification and phylogeny
MALDI-TOF MS failed to identify the strain GD3T, so its mass spectrum was added to the Bruker database (Fig. 1). To improve identification, 16S rRNA sequencing was performed, and the access number in 16S rRNA EMBL-EBI (European Molecular Biology Laboratory–European Bioinformatics Institute) was assigned as LN846907. The highest value of nucleotide sequence similarity was observed with Flavonifractor plautii (97%), the phylogenetically closest species.
Fig. 1.

Reference mass spectrum (matrix-assisted desorption ionization–time of flight mass spectrometry) from Clostridium phoceensis strain GD3T.
Phenotypic and biochemical characterization
C. phoceensis strain GD3T is a Gram-negative (Fig. 2), spore-forming, nonmotile, strictly anaerobic bacterium that has no catalase and oxidase activities, measuring 1.8 μm in length and 0.5 μm in diameter (Fig. 3). The sporulation test was positive; the organism grows at 45°C in anaerobic conditions. Using the API ZYM gallery, C. phoceensis exhibits esterase (C4), phosphatase acid, naphthol-AS-BI-phosphohydrolase and β-glucosidase activities. When using the API 20A gallery, a positive reaction was only observed for d-glucose (Table 1).
Fig. 2.

Gram staining of Clostridium phoceensis strain GD3T.
Fig. 3.
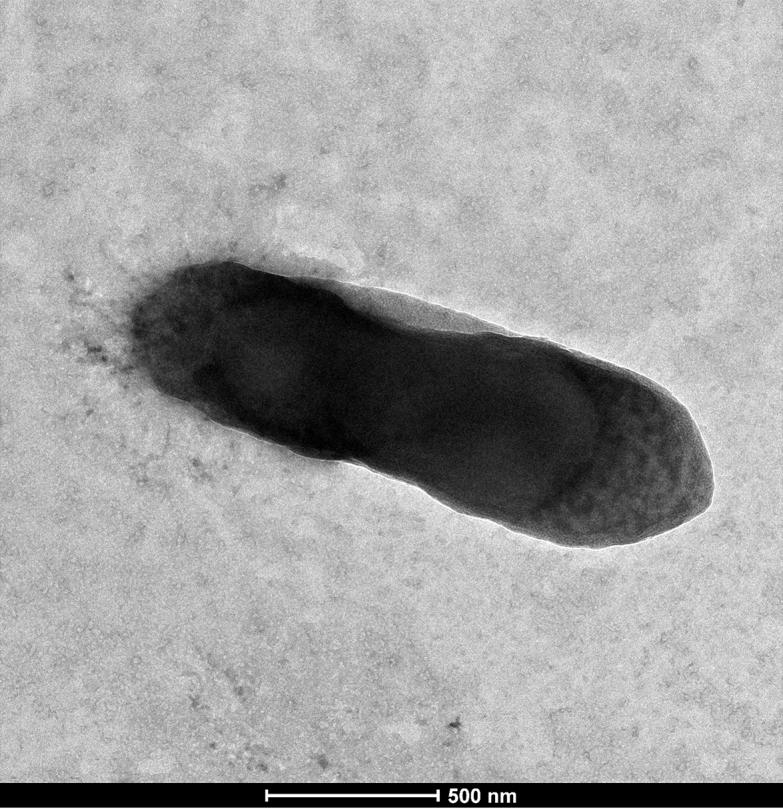
Electron microscopy of Clostridium phoceensis strain GD3T.
Table 1.
Classification, general features and biochemical tests of Clostridium phoceensis strain GD3T
| Property | Term |
|---|---|
| Current classification | Domain: Bacteria |
| Phylum: Firmicutes | |
| Class: Clostridia | |
| Order: Clostridiales | |
| Family: Clostriadaceae | |
| Genus: Clostridium | |
| Species: Clostridium phoceensis | |
| Type strain: GD3 | |
| Gram stain | Negative |
| Cell shape | Bacillus |
| Cell diameter (μm) | 0.5 μm |
| Cell length | 1.8 μm |
| Motility | No |
| Sporulation | Yes |
| Temperature range | Mesophilic |
| Production of: | |
| Alkaline phosphatase | No |
| Catalase | No |
| Oxidase | No |
| Nitrate reductase | No |
| Urease | No |
| β-Galactosidase | No |
| N-acetyl-glucosamine | No |
| Esterase | Yes |
| Acid from: | |
| l-Arabinose | No |
| Ribose | No |
| Mannose | No |
| Mannitol | No |
| Sucrose | No |
| d-Glucose | Yes |
| d-Fructose | No |
| d-Maltose | No |
| d-Lactose | No |
| Habitat | Human |
Of the antibiotics tested, C. phoceensis was found to be sensitive to amoxicillin, amoxicillin–clavulanate, ceftriaxone, ceftazidime, imipenem, doripenem and ciprofloxacin.
Predominant cellular fatty acids
The predominant cellular fatty acids of C. phoceensis strain GD3T are hexadecanoic acid (16:0; 33.1 ± 1.7%), 9-octadecenoic acid (18:1n9; 24.3 ± 0.6%), octadecanoic acid (18:0; 20.0 ± 0.1%), 9,12-octadecadienoic acid (18:2n6; 8.6 ± 0.1%), 11-octadecenoic acid (18:1n7; 5.5 ± 0.5%), tetradecanoic acid (14:0; 4.7 ± 0.8%) and trace amounts (less than 1%) of heptadecanoic acid, 9-hexadecenoic acid, pentadecanoic acid, 15-methyl-hexadecanoic acid, 14-methyl-hexadecanoic acid, 10-heptadecenoic acid, 13-methyl-tetradecanoic acid and 12-methyl-tetradecanoic acid (Table 2).
Table 2.
Cellular fatty acid composition (%) of Clostridium phoceensis strain GD3T
| Fatty acid | Name | Mean relative %a |
|---|---|---|
| 16:0 | Hexadecanoic acid | 33.1 ± 1.7 |
| 18:1n9 | 9-Octadecenoic acid | 24.3 ± 0.6 |
| 18:0 | Octadecanoic acid | 20.0 ± 0.1 |
| 18:2n6 | 9,12-Octadecadienoic acid | 8.6 ± 0.1 |
| 18:1n7 | 11-Octadecenoic acid | 5.5 ± 0.5 |
| 14:0 | Tetradecanoic acid | 4.7 ± 0.8 |
| 17:0 | Heptadecanoic acid | TR |
| 16:1n7 | 9-Hexadecenoic acid | TR |
| 15:0 | Pentadecanoic acid | TR |
| 17:0 iso | 15-methyl-Hexadecanoic acid | TR |
| 17:0 anteiso | 14-methyl-Hexadecanoic acid | TR |
| 17:1n7 | 10-Heptadecenoic acid | TR |
| 15:0 iso | 13-Methyl-tetradecanoic acid | TR |
| 15:0 anteiso | 12-Methyl-tetradecanoic acid | TR |
Genome properties
A phylogenetic tree highlighting the position of Clostridium phoceensis GD3T relative to other type strains within the order Clostridiales is provided in Fig. 4.
Fig. 4.

Phylogenetic tree highlighting position of Clostridium phoceensis GD3T relative to other type strains within Clostridiales order. GenBank accession numbers are indicated. Sequences were aligned using CLUSTALW, and phylogenetic inferences were obtained using maximum-likelihood method within MEGA 4 software [23]. Numbers at nodes are bootstrap values obtained by repeating analysis 500 times to generate majority consensus tree. Scale bar represents 5% nucleotide sequence divergence. Rubidus massiliensis was used as outgroup.
The genome of the C. phoceensis strain GD3T is 3 453 562 bp long with 59.32% G+C content. A total of 3320 genes were predicted, of which 3264 were protein-coding genes and 56 were RNA genes (three genes are 5S rRNA, one gene is 16S rRNA, one gene is 23S rRNA and 51 genes are TRNA genes). A total of 1967 genes (60.26%) were assigned a putative function. A total of 227 genes (6.95%) were identified as ORFans. The remaining genes (28.92%) were annotated as hypothetical proteins. The properties and statistics of the genome are summarized in Table 3 and Fig. 5. The distribution of genes into COGs functional categories is presented in Table 4 and Fig. 6.
Table 3.
Nucleotide content and gene count levels of genome
| Attribute | Genome (total) |
|
|---|---|---|
| Value | % of totala | |
| Genome size (bp) | 3 453 562 | 100 |
| DNA coding region (bp) | 2 924 785 | 84.68 |
| DNA G+C content (bp) | 2 044 366 | 59.31 |
| Total genes | 3320 | 100 |
| rRNA | 5 | 0.136 |
| tRNA | 51 | 0.116 |
| Protein-coding genes | 3264 | 98.31 |
| Genes with function prediction | 3111 | 17.02 |
| Genes assigned to COGs | 2534 | 57.39 |
| Pseudo genes | 62 | 1.86 |
| Genes in internal clusters | 1060 | 31.92 |
| Genes with Pfam domains | 2817 | 84 |
| Genes with signal peptides | 414 | 12.68 |
| Genes with transmembrane helices | 722 | 22.12 |
| ORFan genes | 227 | 6.95 |
| CRISPR repeats | 14 | 0.02 |
COGs, Clusters of Orthologous Groups database; CRISPR, clustered regularly interspaced short palindromic repeat.
Total is based on either size of genome in base pairs or total number of protein-coding genes in annotated genome.
Fig. 5.

Graphical circular map of Clostridium phoceensis GD3T genome. From outside in, outer two circles show ORFs oriented in forward (colored by COGs categories) and reverse (colored by COGs categories) directions, respectively. Third circle marks tRNA genes (green). Fourth circle shows G+C% content plot. Innermost circle shows GC skew, with purple indicating negative values and olive indicating positive values. COGs, Clusters of Orthologous Groups database; ORF, open reading frame.
Table 4.
Number of genes associated with 25 general COGs functional categories
| Code | Description | Value | % of totala |
|---|---|---|---|
| J | Translation | 150 | 4.59 |
| A | RNA processing and modification | 0 | 0 |
| K | Transcription | 212 | 6.49 |
| L | Replication, recombination and repair | 106 | 3.24 |
| B | Chromatin structure and dynamics | 0 | 0 |
| D | Cell cycle control, mitosis and meiosis | 22 | 0.67 |
| Y | Nuclear structure | 0 | 0 |
| V | Defense mechanisms | 75 | 2.29 |
| T | Signal transduction mechanisms | 94 | 2.87 |
| M | Cell wall/membrane biogenesis | 54 | 1.65 |
| N | Cell motility | 27 | 0.82 |
| Z | Cytoskeleton | 0 | 0 |
| W | Extracellular structures | 0 | 0 |
| U | Intracellular trafficking and secretion | 25 | 0.76 |
| O | Posttranslational modification, protein turnover, chaperones | 51 | 1.56 |
| C | Energy production and conversion | 94 | 2.87 |
| G | Carbohydrate transport and metabolism | 106 | 3.24 |
| E | Amino acid transport and metabolism | 217 | 6.54 |
| F | Nucleotide transport and metabolism | 49 | 1.50 |
| H | Coenzyme transport and metabolism | 63 | 1.93 |
| I | Lipid transport and metabolism | 53 | 1.62 |
| P | Inorganic ion transport and metabolism | 94 | 2.87 |
| Q | Secondary metabolites biosynthesis, transport and catabolism | 29 | 0.88 |
| R | General function prediction only | 231 | 7.07 |
| S | Function unknown | 126 | 3.86 |
| — | Not in COGs | 1684 | 51.59 |
COGS, Clusters of Orthologous Groups database.
Total is based on total number of protein-coding genes in annotated genome.
Fig. 6.

Distribution of functional classes of predicted genes in genomes from Clostridium phoceensis (Cp), Intestinimonas butyriciproducens strain ER1 (Ib), Flavonifractor plautii ATCC 29863 (Fp), Clostridium leptum DSM 753 (Cl), Clostridium cellulosi DG5 (Cc), Ethanoligenens harbinense YUAN-3 (Eh), Oscillibacter valericigenes Sjm18-20 (Ov), Clostridium viride DSM 6836 (Cv), Eubacterium siraeum V10Sc8a (Es) and Pseudoflavonifractor capillosus ATCC 29799 (PC) genomes according to clusters of orthologous groups of proteins. ATCC, American Type Culture Collection (Manassas, VA, USA).
Genome comparison
We made some brief comparisons against nine genomes: Intestinimonas butyriciproducens strain ER1 (GenBank accession no. JPJD01000000), Flavonifractor plautii ATCC 29863 (AGCK01000000), Clostridium leptum DSM 753 (ABCB02000000), Clostridium cellulosi DG5 (NZ_LM995447), Ethanoligenens harbinense YUAN-3 (NC_01482), Oscillibacter valericigenes Sjm18-20 (NC_016048), Clostridium viride DSM 6836 (NZ_JHZO01000000), Eubacterium siraeum V10Sc8a (FP929059) and Pseudoflavonifractor capillosus ATCC 29799 (NZ_AAXG02000000). The draft genome sequence of C. phoceensis is smaller than those of Pseudoflavonifractor capillosus, Oscillibacter valericigenes, Flavonifractor plautii, Clostridium cellulosi and Intestinimonas butyriciproducens (3.45, 4.24, 4.47, 3.81, 5.68 and 3.57 MB respectively), but larger than those of Clostridium viride, Ethanoligenens harbinense, Clostridium leptum and Eubacterium siraeum (2.41, 3.01, 2.82 and 2.84 MB respectively). The G+C content of C. phoceensis is smaller than those of Flavonifractor plautii (59.32 and 61.07% respectively) but larger than those of Pseudoflavonifractor capillosus, Oscillibacter valericigenes, Clostridium viride, Ethanoligenens harbinense, Clostridium leptum, Eubacterium siraeum, Clostridium cellulosi and Intestinimonas butyriciproducens (59.11, 53.19, 49.28, 55.56, 50.25, 45.13, 42.07 and 58.44% respectively). The gene content of C. phoceensis is smaller than those of Pseudoflavonifractor capillosus, Oscillibacter valericigenes, Flavonifractor plautii, Clostridium cellulosi and Intestinimonas butyriciproducens (3264, 4829, 4723, 4278, 5171 and 3529 respectively) but larger than those of Clostridium viride, Ethanoligenens harbinense, Clostridium leptum and Eubacterium siraeum (2321, 2701, 2482 and 2211 respectively). C. phoceensis has a similar distribution of genes into COGs categories with the most of the compared species (Fig. 4). However, Clostridium cellulosi was overrepresented for all the categories, and Clostridium viride was overrepresented for category Z (cytoskeleton).
In addition, Clostridium phoceensis shared 846, 884, 492, 562, 482, 717, 634, 407 and 842 orthologous genes respectively with Intestinimonas butyriciproducens, Flavonifractor plautii, Clostridium leptum, Clostridium cellulosi, Ethanoligenens harbinense, Oscillibacter valericigenes, Clostridium viride, Eubacterium siraeum and Pseudoflavonifractor capillosus (Table 5). Of these species, the orthologous genes shared ranged from 365 between Eubacterium siraeum and Clostridium viride to 1079 between Flavonifractor plautii and Intestinimonas butyriciproducens. Compared to other species, C. phoceensis exhibited AGIOS values ranging from 56.64 with Ethanoligenens harbinense to 71.58 with Flavonifractor plautii.
Table 5.
Orthologous genes shared (upper right) and AGIOS values obtained (lower left)a
| Cp | Ib | Fp | Cl | Cc | Eh | Ov | Cv | Es | Pc | |
|---|---|---|---|---|---|---|---|---|---|---|
| Cp | 3264 | 846 | 884 | 492 | 562 | 482 | 717 | 634 | 407 | 842 |
| Ib | 70.10 | 3529 | 1079 | 508 | 627 | 501 | 771 | 671 | 407 | 1016 |
| Fp | 71.58 | 73.64 | 4278 | 523 | 649 | 518 | 818 | 686 | 433 | 1039 |
| Cl | 61.83 | 61.60 | 61.65 | 2482 | 587 | 495 | 475 | 432 | 405 | 523 |
| Cc | 57.17 | 57.91 | 56.82 | 61.62 | 5171 | 619 | 604 | 562 | 465 | 616 |
| Eh | 56.64 | 56.86 | 56.92 | 56.13 | 55.34 | 2701 | 515 | 449 | 415 | 499 |
| Ov | 65.72 | 65.34 | 65.55 | 61.60 | 58.40 | 56.54 | 4723 | 653 | 409 | 710 |
| Cv | 63.84 | 64.57 | 64.21 | 60.85 | 59.13 | 55.02 | 62.58 | 2321 | 364 | 614 |
| Es | 57.83 | 58.77 | 57.72 | 60.78 | 61.38 | 54.37 | 59.13 | 58.93 | 2211 | 427 |
| Pc | 61.55 | 61.95 | 62.89 | 55.43 | 52.37 | 57.21 | 58.02 | 56.73 | 53.24 | 4829 |
AGIOS, average genomic identity of orthologous gene sequences; ATCC, American Type Culture Collection (Manassas, VA, USA).
Values in bold are gene numbers. Ten genomes were used for this study: Clostridium phoceensis (Cp), Intestinimonas butyriciproducens strain ER1 (Ib), Flavonifractor plautii ATCC 29863 (Fp), Clostridium leptum DSM 753 (Cl), Clostridium cellulosi DG5 (Cc), Ethanoligenens harbinense YUAN-3 (Eh), Oscillibacter valericigenes Sjm18-20 (Ov), Clostridium viride DSM 6836 (Cv), Eubacterium siraeum V10Sc8a (Es) and Pseudoflavonifractor capillosus ATCC 29799 (PC) genomes according to the clusters of orthologous groups of proteins.
Conclusion
On the basis of taxonogenomic analyses, we propose Clostridium phoceensis sp. nov., strain GD3T (= CSUR P1929 = DSM 100334), as the type strain of C. phoceensis sp. nov., a new species within the genus Clostridium (Fig. 4). This strain was isolated from the gut microbiota of a 28-year-old healthy French man.
Taxonomic and nomenclatural proposals
Description of Clostridium phoceensis sp. nov.
Clostridium phoceensis strain GD3T (pho.ce.en'sis, L. fem. adj., from phoceensis referring to Phocea, the Greek name of the city which founded Marseille, where it was isolated) is a Gram-negative nonmotile bacillus whose individual cell size is 1.8 μm in length and 0.5 μm in diameter. It is a strictly anaerobic and endospore-forming bacterium. Strain GD3T is catalase and oxidase negative, and its optimal growth temperature is 45°C, but it also grows weakly at 37°C. Biochemical analyses showed positive reactions of C. phoceensis for d-glucose and produced esterase (C4), phosphatase acid, naphthol-AS-BI-phosphohydrolase and β-glucosidase enzymes. C. phoceensis was sensitive to amoxicillin, amoxicillin–clavulanate, ceftriaxone, ceftazidime, imipenem, doripenem and ciprofloxacin. Its predominant cellular fatty acids are hexadecanoic acid (16:0; 33.1 ± 1.7%), 9-octadecenoic acid (18:1n9; 24.3 ± 0.6%), octadecanoic acid (18:0; 20.0 ± 0.1%), 9,12-octadecadienoic acid (18:2n6; 8.6 ± 0.1%), 11-octadecenoic acid (18:1n7; 5.5 ± 0.5%) and tetradecanoic acid (14:0; 4.7 ± 0.8%). Its 16S rRNA sequences were deposited in GenBank under accession numbers CVUG01000000 and LN846907. Strain GD3T, whose CSUR and DSMZ numbers are respectively CSUR P1929 and DSM 100334, was identified from the stool sample of a 28-year-old healthy French man.
Acknowledgements
The authors thank the Xegen Company (www.xegen.fr) for automating the genomic analysis process and culturomics team in URMITE for the bacteria isolation. This project was funded by the Fondation Méditerranée Infection.
Conflict of Interest
None declared.
References
- 1.Palmer C., Bik E.M., DiGiulio D.B., Relman D.A., Brown P.O. Development of the human infant intestinal microbiota. PLoS Biol. 2007;5:e177. doi: 10.1371/journal.pbio.0050177. [DOI] [PMC free article] [PubMed] [Google Scholar]
- 2.Lagier J.C., Million M., Hugon P., Armougom F., Raoult D. Human gut microbiota: repertoire and variations. Front Cell Infect Microbiol. 2012;2:136. doi: 10.3389/fcimb.2012.00136. [DOI] [PMC free article] [PubMed] [Google Scholar]
- 3.Lagier J.C., Edouard S., Pagnier I., Mediannikov O., Drancourt M., Raoult D. Current and past strategies for bacterial culture in clinical microbiology. Clin Microbiol Rev. 2015;28:208–236. doi: 10.1128/CMR.00110-14. [DOI] [PMC free article] [PubMed] [Google Scholar]
- 4.Ramasamy D., Mishra A.K., Lagier J.C., Padhmanabhan R., Rossi M., Sentausa E. A polyphasic strategy incorporating genomic data for the taxonomic description of novel bacterial species. Int J Syst Evol Microbiol. 2014;64:384–391. doi: 10.1099/ijs.0.057091-0. [DOI] [PubMed] [Google Scholar]
- 5.Lawson P.A., Rainey F.A. Proposal to restrict the genus Clostridium (Prazmowski) to Clostridium butyricum and related species. Int J Syst Evol Microbiol. 2015 doi: 10.1099/ijsem.0.000824. [DOI] [PubMed] [Google Scholar]
- 6.Popoff M.R., Bouvet P. Clostridial toxins. Future Microbiol. 2009;4:1021–1064. doi: 10.2217/fmb.09.72. [DOI] [PubMed] [Google Scholar]
- 7.Lagier J.C., Armougom F., Million M., Hugon P., Pagnier I., Robert C. Microbial culturomics: paradigm shift in the human gut microbiome study. Clin Microbiol Infect. 2012;18:1185–1193. doi: 10.1111/1469-0691.12023. [DOI] [PubMed] [Google Scholar]
- 8.Grosse-Herrenthey A., Maier T., Gessler F., Schaumann R., Böhnel H., Kostrzewa M. Challenging the problem of clostridial identification with matrix-assisted laser desorption and ionization–time-of-flight mass spectrometry (MALDI-TOF MS) Anaerobe. 2008;14:242–249. doi: 10.1016/j.anaerobe.2008.06.002. [DOI] [PubMed] [Google Scholar]
- 9.Seng P., Abat C., Rolain J.M., Colson P., Lagier J.C., Gouriet F. Identification of rare pathogenic bacteria in a clinical microbiology laboratory: impact of matrix-assisted laser desorption ionization–time of flight mass spectrometry. J Clin Microbiol. 2013;51:2182–2194. doi: 10.1128/JCM.00492-13. [DOI] [PMC free article] [PubMed] [Google Scholar]
- 10.Drancourt M., Bollet C., Carlioz A., Martelin R., Gayral J.P., Raoult D. 16S ribosomal DNA sequence analysis of a large collection of environmental and clinical unidentifiable bacterial isolates. J Clin Microbiol. 2000;38:3623–3630. doi: 10.1128/jcm.38.10.3623-3630.2000. [DOI] [PMC free article] [PubMed] [Google Scholar]
- 11.Dione N., Sankar S.A., Lagier J.C., Khelaifia S., Michele C., Armstrong N. Genome sequence and description of Anaerosalibacter massiliensis sp. nov. New Microbes New Infect. 2016;10:66–76. doi: 10.1016/j.nmni.2016.01.002. [DOI] [PMC free article] [PubMed] [Google Scholar]
- 12.Mourembou G., Yasir M., Azhar E.I., Lagier J.C., Bibi F., Jiman-Fatani A.A. Rise of microbial culturomics: noncontiguous finished genome sequence and description of Beduini massiliensis gen. nov., sp. nov. OMICS J Integr Biol. 2015;19:766–776. doi: 10.1089/omi.2015.0143. [DOI] [PMC free article] [PubMed] [Google Scholar]
- 13.Fournier P.E., Raoult D., Drancourt M. New species announcement: a new format to prompt the description of new human microbial species. New Microbes New Infect. 2016 doi: 10.1016/j.nmni.2016.04.006. In press. [DOI] [PMC free article] [PubMed] [Google Scholar]
- 14.Field D., Garrity G., Gray T., Morrison N., Selengut J., Sterk P. The minimum information about a genome sequence (MIGS) specification. Nat Biotechnol. 2008;26:541–547. doi: 10.1038/nbt1360. [DOI] [PMC free article] [PubMed] [Google Scholar]
- 15.Hyatt D., Chen G.L., LoCascio P.F., Land M.L., Larimer F.W., Hauser L.J. Prodigal: prokaryotic gene recognition and translation initiation site identification. BMC Bioinformatics. 2010;11:119. doi: 10.1186/1471-2105-11-119. [DOI] [PMC free article] [PubMed] [Google Scholar]
- 16.Benson D.A., Karsch-Mizrachi I., Clark K., Lipman D.J., Ostell J., Sayers E.W. GenBank. Nucleic Acids Res. 2012;40(Database issue):D48–D53. doi: 10.1093/nar/gkr1202. [DOI] [PMC free article] [PubMed] [Google Scholar]
- 17.Lowe T.M., Eddy S.R. tRNAscan-SE: a program for improved detection of transfer RNA genes in genomic sequence. Nucleic Acids Res. 1997;25:955–964. doi: 10.1093/nar/25.5.955. [DOI] [PMC free article] [PubMed] [Google Scholar]
- 18.Lagesen K., Hallin P., Rødland E.A., Stærfeldt H.H., Rognes T., Ussery D.W. RNAmmer: consistent and rapid annotation of ribosomal RNA genes. Nucleic Acids Res. 2007;35:3100–3108. doi: 10.1093/nar/gkm160. [DOI] [PMC free article] [PubMed] [Google Scholar]
- 19.Dyrløv Bendtsen J., Nielsen H., von Heijne G., Brunak S. Improved prediction of signal peptides: SignalP 3.0. J Mol Biol. 2004;340:783–795. doi: 10.1016/j.jmb.2004.05.028. [DOI] [PubMed] [Google Scholar]
- 20.Krogh A., Larsson B., von Heijne G., Sonnhammer E.L.L. Predicting transmembrane protein topology with a hidden markov model: application to complete genomes. J Mol Biol. 2001;305:567–580. doi: 10.1006/jmbi.2000.4315. [DOI] [PubMed] [Google Scholar]
- 21.Rutherford K., Parkhill J., Crook J., Horsnell T., Rice P., Rajandream M.A. Artemis: sequence visualization and annotation. Bioinformatics. 2000;16:944–945. doi: 10.1093/bioinformatics/16.10.944. [DOI] [PubMed] [Google Scholar]
- 22.Carver T., Thomson N., Bleasby A., Berriman M., Parkhill J. DNAPlotter: circular and linear interactive genome visualization. Bioinformatics. 2009;25:119–120. doi: 10.1093/bioinformatics/btn578. [DOI] [PMC free article] [PubMed] [Google Scholar]
- 23.Tamura K., Dudley J., Nei M., Kumar S. MEGA4: Molecular Evolutionary Genetics Analysis (MEGA) software version 4.0. Mol Biol Evol. 2007;24:1596–1599. doi: 10.1093/molbev/msm092. [DOI] [PubMed] [Google Scholar]