

Abstract
Background. Studies revealed that metabolic factors might contribute substantially to osteoarthritis (OA) pathogenesis. There has been an increasing interest to understand the relationship between knee OA and the metabolic syndrome (MetS). The purpose of this study was to explore the association between metabolic syndrome and knee osteoarthritis using meta-analysis. Methods. Databases, including PUBMED, EMBASE, and the Cochrane Library, were searched to get relevant studies. Data were extracted separately by two authors and pooled odds ratio (OR) with 95% confidence interval (CI) was calculated. Results. The meta-analysis was finished with 8 studies with a total of 3202 cases and 20968 controls finally retrieved from the database search. The crude pooled OR is 2.24 (95% CI = 1.38–3.64). Although there was significant heterogeneity among these studies, which was largely accounted for by a single study, the increase in risk was still significant after exclusion of that study. The pooled adjusted OR remained significant with pooled adjusted OR 1.05 (95% CI = 1.03–1.07, p < 0.00001). No publication bias was found in the present meta-analysis. Conclusions. The synthesis of available evidence supports that metabolic syndrome increases the risk for knee osteoarthritis, even after adjustment for many risk factors.
1. Introduction
Knee osteoarthritis (KOA) is a prevalent chronic joint disease affecting about 28% of the population in the USA at 45 years of age. It is estimated to rise up to 37% in adults aged over 65 years [1] within the next years. KOA affects joint tissues, including synovium, ligaments, tendons, muscle, and subchondral bone, causing cartilage and osteophyte formation at joints, eventually leading to arthralgia, stiffness, and limitations in the articular function, severely affecting patients' physical functioning and quality of life [2, 3]. KOA is a heterogeneous disease, and risk factors include sex, age, mechanical factors, or obesity. Understanding the role each of the risk factors plays is important for KOA prevention.
Recently, studies revealed that metabolic factors might contribute substantially to OA pathogenesis [4]. There has been an increasing interest to understand the relationship between knee OA and the metabolic syndrome (MetS). Some studies supported the link between OA and characteristics of MetS, including hypertension, type 2 diabetes, and dyslipidemia [5, 6]. Additionally, several studies were inclined to recognize metabolic phenotype to be a common subtype of OA. Some studies support MetS as a contributing factor to an increased risk of OA. However, literature results are controversial as there are other groups that do not support this belief. The purpose of this study was to provide a summary and analysis of published studies based on the association between OA and MetS.
2. Materials and Methods
2.1. Search Strategy
The authors did an intensive search on PUBMED, EMBASE, and the Cochrane Library for published studies until June 3, 2015. Relevant available articles were obtained using key words such as ("Osteoarthritis"[Majr]) AND "Metabolic Syndrome X"[Majr], “osteoarthritis metabolism syndrome”, and “osteoarthritis metabolic syndrome”. No language restrictions were applied. A reference list of relevant papers was also screened.
2.2. Study Selection Criteria
A study was included if it met the following inclusion criteria: (1) It is cohort, case-control, or cross-sectional study investigating the association between MetS and risk of OA; (2) relative risk (RR) or odds ratios (ORs) and the corresponding 95% confidence intervals (CIs) could be directly extracted or calculated from the available data; and (3) if there is duplicated data, the larger sample size was adopted. Two investigators independently applied the selection criteria to each reference identified by the search strategy. Any discrepancies regarding eligibility or quality were resolved by the third reviewer.
The following information was collected from each available article: year of publication, ethnicity of the studied population, numbers of cases and controls, mean age of case and control groups, and MetS criteria and OA criteria adopted adjusted OR and adjusted variables. All articles were independently reviewed by two investigators. Data was extracted independently and entered into separate databases. Results were compared and any discrepancy was resolved by the third investigator as well.
2.3. Definition of Metabolic Syndrome
The National Cholesterol Education Program-ATPIII (NCEP-ATPIII) definition was used to define metabolic syndrome (MetS) [14]. MetS is defined as the presence of any three out of five components: that is, abdominal obesity ≥102/88 cm (western, male/female) and ≥90/85 cm (eastern, male/female) [8, 15]; hypertriglyceridemia ≥150 mg/dL; low high density lipoprotein cholesterol (HDL-C) <40 mg/dL in men and <50 mg/dL in women; high blood pressure ≥130/85 mmHg or use of antihypertensive medication; or high fasting glucose ≥100 mg/dL or being under treatment for diabetes.
2.4. Definition of Knee Osteoarthritis
Kellgren and Lawrence grade (K-L grade) classified KOA into four grades (0, normal, to 4, severe). Radiographic knee OA is defined as K-L grade 2 or above [16]. The American Rheumatism Association (ACR) proposed an alternative definition for OA based on a clinical or self-reported approach [17].
2.5. Statistical Analysis
The crude pooled OR was calculated. Adjusted ORs controlling for potential confounding factors in the greatest degree were also extracted whenever available. The adjusted OR was converted by using the natural logarithm and the SEs and their corresponding 95% CIs were calculated from these logarithmic numbers. Pooled adjusted OR was also calculated. When I 2 >50%, heterogeneity was significant, and random-effects model was applied to estimate the pooled ORs and 95% CI. We considered I 2 of <50% as “heterogeneity might not be important,” and a fixed-effects model will be conducted. Cochrane Collaboration's Review Manager Software Package (RevMan 5, Version 5.0, Cochrane Collaboration, Oxford, United Kingdom) was used for the meta-analysis.
3. Results
A flow chart of literature search and study selection is shown in Figure 1. After a systematic search in PUBMED, EMBASE, and the Cochrane Library, 371 articles were retrieved. After a systematic review, 8 studies with a total of 3,202 cases and 20,968 controls were finally included. Among these studies, there were two prospective studies [7, 13], three cross-sectional studies [9, 10, 12], and three case-control studies [8, 11]. One study was excluded for lack of data [18]. The characteristics of the included studies are summarized in Table 1.
Figure 1.

Flow chart of studies selection.
Table 1.
Characteristics of studies included in the meta-analysis.
| Study | Study design and population | Ethnic | MetS criteria | OA criteria | Number of KOA/control | Age (KOA/control) | Gender | Waist circumference (KOA/control) (cm) | Weight (KOA/control) (kg) | BMI (KOA/control) (kg/m2) | Adjusted OR, 95% CI | Adjusted variables |
|---|---|---|---|---|---|---|---|---|---|---|---|---|
| Engström et al. 2009 [7] | Population-based cohort | Sweden | NCEP-ATPIII | A first knee arthroplasty or high tibial osteotomy and diagnosis of OA (715 or M17 according to ICD-9 and ICD-10) | 89/5082 | (59.7 ± 5.3)/(57.6 ± 6.0)∗ | Male and female | NE | NE | 28.9 ± 4.6/25.7 ± 3.9∗ | 1.1 (0.7–1.8) | Age, sex (all participants), smoking, CRP, physical activity, BMI |
| Han et al. 2013 [8] | Case-control | Korean | NCEP-ATPIII | NR | 270/1964 | (64.5 ± 10.1)/(53.2 ± 11.0)∗ | Male and female | 85.0 ± 9.5/82.7 ± 8.7∗ | 58.3 ± 9.5/62.0 ± 10.1∗ | 24.6 ± 3.3/23.8 ± 3.1∗ | NE | NE |
| Inoue et al. 2011 [9] | Cross-sectional | Japan | NCEP-ATPIII | K-L grade | 251/532 | NR | Male and female | Male: 84.5 ± 7.9/84.6 ± 7.4∗
Female: 84.6 ± 7.4/80.5 ± 8.2∗ |
NE | male: 23.6 ± 2.8/23.5 ± 2.7∗
female: 23.8 ± 3.6/22.3 ± 2.7∗ |
NE | NE |
| Michishita et al. 2008 [10] | Cross-sectional study | Japan | NCEP-ATPIII | K-L grade | 35/37 | (60.1 ± 6.7)/(58.6 ± 5.3)# | female | 91.7 ± 8.0/87.2 ± 9.0∗ | 68.9 ± 10.0/60.9 ± 8.2∗ | 28.2 ± 3.7/26.2 ± 2.8∗ | NE | NE |
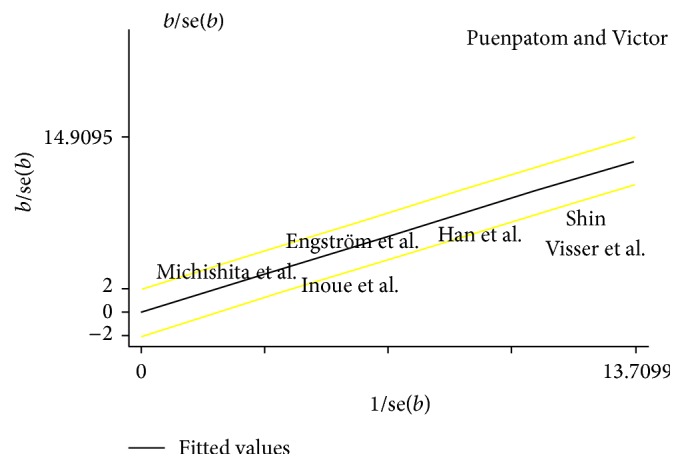
| Puenpatom and Victor 2009 [11] | Case-control | American | NCEP-ATPIII | K-L grade | 975/6739 | Age 18–65 years: (43.1% versus 92%)∗
Age >65 years: (56.9%/9.8%)∗ |
NE | NE | NE | NE | 1.05 (1.03–1.07) | Age, controlled for BMI |
| Shin 2014 [12] | Cross-sectional study | Korean | NCEP-ATPIII | K-L grade | 919/1444 | 67.2 ± 8.4/61.0 ± 8.1 | Male | 85.3 ± 8.8/82.2 ± 8.9 | 61.0 ± 10.2/60.6 ± 9.9 | 24.7 ± 3.2/23.5 ± 2.9 | 0.92 (0.74–1.13) | Age, sex, income, smoking, alcohol consumption, physical activity, BMI |
| Visser et al.2015 [13] | Population-based prospective cohort | Netherlander | NCEP-ATPIII | ACR criteria | 663/5170 | 58/55 | Male and female | NE | 80.4 ± 12.6/77.8 ± 10.2 | 26.9 ± 0.08/25.5 ± 2.5 | 1.08 (0.85–1.39) | Age, sex, smoking, education, ethnicity, height, weight |
∗: p < 0.05 and #: p > 0.05; K-L grade: Kellgren-Lawrence grade; NR: not recorded; and NE: not evaluated. Values are presented as mean ± SD.
The pooled ORs result suggested that MetS seemed to significantly increase overall KOA risk (pooled OR = 2.24, 95% CI = 1.38–3.64) (Figure 2). The Egger test did not suggest the presence of publication bias (p = 0.555) (Figure 3). However, the individual estimates of the ORs were significantly heterogeneous (I 2 = 96%, p < 0.00001 in random-effects model). The Galbraith plot showed that the study by Puenpatom and Victor largely accounted for heterogeneity (Figure 4). After excluding this study, the interstudy heterogeneity decreased (I 2 = 0%, p = 0.48), with the OR attenuated but remaining statistically significant (pooled OR, 1.74, 95% CI = 1.57–1.92; p < 0.00001 in a fixed effect model).
Figure 2.

Forest plot of MetS exposure and KOA risk.
Figure 3.
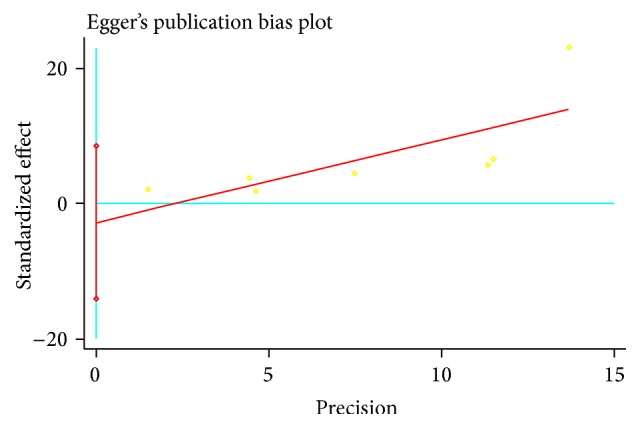
Publication bias evaluated by funnel plots in studies of MetS exposure and KOA risk.
Figure 4.
Galbraith plot of ORs of OA.
Four studies described the adjusted OR [7, 11–13]. After pooling the adjusted ORs, the results remained significant (pooled adjusted OR = 1.05, 95% CI = 1.03–1.07, and p < 0.00001) (Figure 5). No significant interstudy heterogeneity was observed (I 2 = 0%, p for heterogeneity = 0.86) and there was no publication bias (p = 0.649) (Figure 6).
Figure 5.

Forest plot of MetS exposure and KOA risk with risk factors adjusted.
Figure 6.
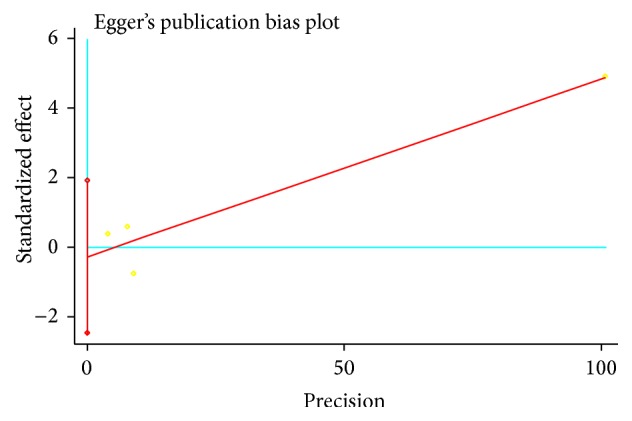
Publication bias evaluated by funnel plots in studies of MetS exposure and KOA risk with risk factors adjusted.
4. Discussion
KOA is the most prevalent form of arthritis and a major cause of pain and disability that affected 151 million individuals globally in 2000 [1, 2]. It has long been considered a “wear-and-tear” disease leading to loss of cartilage and used to be considered the sole consequence of any process leading to overloading pressure on knee joint. In recent studies, increasing evidence supports that MetS is associated with knee OA [4, 5]. MetS is a clustering of risk factors, including dyslipidemia, high blood pressure, impaired glucose tolerance, and abdominal obesity [15]. It is reported that MetS is prevalent in 59% of patients with OA and in 23% of the population without OA, in a population-based cohort study with a sample of 7,714 people across all ages [15]. Studies also proved that people with MetS develop OA at an earlier age and have more generalized pathology, increased inflammation, and augmented intensive pain in the joints, in comparison with patients with OA in the absence of MetS [4–6, 8, 14–16]. On the contrary, some literature results are controversial as there are other groups that do not support this belief [12]. Thus, it is meaningful to provide a summary and analysis of published studies based on the association between OA and MetS.
This study showed that MetS increases the risk of KOA, even after adjusting many of the risk factors. In our meta-analysis, one article was excluded for not providing the data for analysis. However, in the excluded article, it was indicated that MetS was prevalent in 59% of patients with OA, whereas it was 23% in the population without OA [18]. Thus, excluding this study did not alter the result of the current study. Aging remains the most important risk factor for OA. The overall incidence of knee OA in people at 65+ years of age is reported to be 40%. In the summary of adjusted OR, all studies have age adjusted.
OA and MetS share the same mechanisms of inflammation, oxidative stress, common metabolites, and endothelial dysfunction [5, 19–21]. Obese individuals have a higher risk for OA compared to nonobese people [22]. Metabolites characteristics including energy metabolism and lipid and carbohydrate metabolism in the OA patients' synovial tissue cultures were significantly decreased compared with those with little or no evidence of the disease [23, 24]. Obesity increased mass and joint load and altered proinflammatory factor adipokines secretion, leading to the chronic low grade inflammatory status in joint tissues [25, 26]. Additionally, cholesterol accumulation in the cartilage can impair the efflux function of cartilage, hence inducing OA [27, 28]. Oxidized LDL can activate synovial cells such as macrophages, endothelial cells, and synovial fibroblasts, resulting in release of growth factors, MMP, and proinflammatory cytokines, causing cartilage destruction and bone deformations [29].
As parts of the metabolic syndrome, insulin resistance, hyperglycaemia, and hyperinsulinemia are also strongly related to OA pathogenesis. In clinic, diabetes has been proved to be an independent predictor for osteoarthritis by the population-based cohort study followed over 20 years [30]. There is an increasing recognition of the mechanistic link between OA and DM include advanced glycation endproducts (AGEs), dyslipidemia, adipokines, and cytokines act through oxidative stress and inflammatory mechanisms [24–27]. Dyslipidemia with increased free fatty acid and decreased high density lipoprotein and adiponectin is associated with OA development by decreased vascular reactivity and endothelial dysfunction [31, 32]. Inflammatory transformation and proinflammatory cytokines could result in fibrosis of the synovium through the NFκB signalling pathway which plays a critical role during OA development [19, 33].
All of the above highlight the association between MetS and KOA. MetS not only increases the susceptibility to KOA but also exerts influence on its progression and prognosis. Yoshimura et al. demonstrated not only a dose-response relationship between MetS and KOA but also the relationship between MetS components accumulation and KOA progression and occurrence [15, 34]. Our study results could draw attention to the role of MetS in aetiopathology of KOA and give rise to new potential treatments.
This study has several limitations. First, the number of studies evaluated was very small. Future studies should include a more comprehensive analysis of the topic. Second, although genetic risk factors for OA have been found to contribute to the establishment and progression of this condition [35], in this study, we could not establish the effects of genetic factors and other risk factors potentially influencing MS and KOA.
5. Conclusion
For the first time, with meta-analysis, the synthesis of available evidence supports that metabolic syndrome increases the risk for knee osteoarthritis, even after adjustment for many risk factors. As a result, OA is a heterogeneous disease and metabolic factors contribute substantially to its pathogenesis. Furthermore, understanding that MetS contributes to KOA patients will be useful in assessing KOA patients' individual conditions and selection of precision therapeutic strategies.
Acknowledgments
This study is funded by the grants from China Postdoctoral Science Foundation (2015M582480), Natural Science Foundation of Guangdong Province (2016A030313100), and National Natural Science Foundation of China (81601219).
Competing Interests
No benefits in any form have been or will be received from a commercial party related directly or indirectly to the subject of this paper.
Authors' Contributions
Huajun Wang and Zhengang Zha designed the study and drafted the paper. Huajun Wang and Yanmei Cheng searched databases for the articles and screened them accordingly and analysed the data. Decheng Shao, Junyuan Chen, and Yuan Sang helped design the study, analysed and tabulated data, and helped draft and edit the paper. Tao Gui, Simin Luo, and Jieruo Li searched databases for the articles and screened them accordingly and tabulated data. Chao Chen, Yongguang Ye, Yong Yang, and Yikai Li helped analyse and tabulate data and helped draft the paper. All authors read and approved the final paper.
References
- 1.Losina E., Paltiel A. D., Weinstein A. M., et al. Lifetime medical costs of knee osteoarthritis management in the United States: impact of extending indications for total knee arthroplasty. Arthritis Care & Research. 2015;67(2):203–215. doi: 10.1002/acr.22412. [DOI] [PMC free article] [PubMed] [Google Scholar]
- 2.Loeser R. F., Goldring S. R., Scanzello C. R., Goldring M. B. Osteoarthritis: a disease of the joint as an organ. Arthritis and Rheumatism. 2012;64(6):1697–1707. doi: 10.1002/art.34453. [DOI] [PMC free article] [PubMed] [Google Scholar]
- 3.Neogi T. The epidemiology and impact of pain in osteoarthritis. Osteoarthritis and Cartilage. 2013;21(9):1145–1153. doi: 10.1016/j.joca.2013.03.018. [DOI] [PMC free article] [PubMed] [Google Scholar]
- 4.Courties A., Gualillo O., Berenbaum F., Sellam J. Metabolic stress-induced joint inflammation and osteoarthritis. Osteoarthritis and Cartilage. 2015;23(11):1955–1965. doi: 10.1016/j.joca.2015.05.016. [DOI] [PubMed] [Google Scholar]
- 5.Sellam J., Berenbaum F. Is osteoarthritis a metabolic disease? Joint Bone Spine. 2013;80(6):568–573. doi: 10.1016/j.jbspin.2013.09.007. [DOI] [PubMed] [Google Scholar]
- 6.Day C. Metabolic syndrome, or what you will: definitions and epidemiology. Diabetes and Vascular Disease Research. 2007;4(1):32–38. doi: 10.3132/dvdr.2007.003. [DOI] [PubMed] [Google Scholar]
- 7.Engström G., Gerhardsson de Verdier M., Rollof J., Nilsson P. M., Lohmander L. S. C-reactive protein, metabolic syndrome and incidence of severe hip and knee osteoarthritis. A population-based cohort study. Osteoarthritis and Cartilage. 2009;17(2):168–173. doi: 10.1016/j.joca.2008.07.003. [DOI] [PubMed] [Google Scholar]
- 8.Han C. D., Yang I. H., Lee W. S., Park Y. J., Park K. K. Correlation between metabolic syndrome and knee osteoarthritis: data from the Korean National Health and Nutrition Examination Survey (KNHANES) BMC Public Health. 2013;13(1, article 603) doi: 10.1186/1471-2458-13-603. [DOI] [PMC free article] [PubMed] [Google Scholar]
- 9.Inoue R., Ishibashi Y., Tsuda E., et al. Medical problems and risk factors of metabolic syndrome among radiographic knee osteoarthritis patients in the Japanese general population. Journal of Orthopaedic Science. 2011;16(6):704–709. doi: 10.1007/s00776-011-0157-9. [DOI] [PubMed] [Google Scholar]
- 10.Michishita R., Shono N., Kasahara T., Katoku M., Tsuruta T. The possible influence of osteoarthritis of the knee on the accumulation of coronary risk factors in postmenopausal obese women. Obesity Research and Clinical Practice. 2008;2(1):29–34. doi: 10.1016/j.orcp.2007.11.001. [DOI] [PubMed] [Google Scholar]
- 11.Puenpatom R. A., Victor T. W. Increased prevalence of metabolic syndrome in individuals with osteoarthritis: an analysis of NHANES III data. Postgraduate Medicine. 2009;121(6):9–20. doi: 10.3810/pgm.2009.11.2073. [DOI] [PubMed] [Google Scholar]
- 12.Shin D. Association between metabolic syndrome, radiographic knee osteoarthritis, and intensity of knee pain: results of a national survey. The Journal of Clinical Endocrinology & Metabolism. 2014;99(9):3177–3183. doi: 10.1210/jc.2014-1043. [DOI] [PubMed] [Google Scholar]
- 13.Visser A. W., de Mutsert R., Le Cessie S., et al. The relative contribution of mechanical stress and systemic processes in different types of osteoarthritis: the NEO study. Annals of the Rheumatic Diseases. 2015;74(10):1842–1847. doi: 10.1136/annrheumdis-2013-205012. [DOI] [PubMed] [Google Scholar]
- 14.Expert Panel on Detection. Executive summary of the third report of the National Cholesterol Education Program (NCEP) expert panel on detection, evaluation, and treatment of high blood cholesterol in adults (Adult Treatment Panel III) Journal of the American Medical Association. 2001;285(19):2486–2497. doi: 10.1001/jama.285.19.2486. [DOI] [PubMed] [Google Scholar]
- 15.Yoshimura N., Muraki S., Oka H., Kawaguchi H., Nakamura K., Akune T. Association of knee osteoarthritis with the accumulation of metabolic risk factors such as overweight, hypertension, dyslipidemia, and impaired glucose tolerance in Japanese men and women: the ROAD study. Journal of Rheumatology. 2011;38(5):921–930. doi: 10.3899/jrheum.100569. [DOI] [PubMed] [Google Scholar]
- 16.Kellgren J. H., Lawrence J. S. Radiological assessment of osteo-arthrosis. Annals of the Rheumatic Diseases. 1957;16(4):494–502. doi: 10.1136/ard.16.4.494. [DOI] [PMC free article] [PubMed] [Google Scholar]
- 17.Altman R. D. Classification of disease: osteoarthritis. Seminars in Arthritis and Rheumatism. 1991;20(6, supplement 2):40–47. doi: 10.1016/0049-0172(91)90026-v. [DOI] [PubMed] [Google Scholar]
- 18.Singh G., Miller J. D., Lee F. H., Pettitt D., Russell M. W. Prevalence of cardiovascular disease risk factors among US adults with self-reported osteoarthritis: data from the Third National Health and Nutrition Examination Survey. American Journal of Managed Care. 2002;8(15):S383–S391. doi: 10.18553/jmcp.2002.8.5.383. [DOI] [PubMed] [Google Scholar]
- 19.Zhuo Q., Yang W., Chen J., Wang Y. Metabolic syndrome meets osteoarthritis. Nature Reviews Rheumatology. 2012;8(12):729–737. doi: 10.1038/nrrheum.2012.135. [DOI] [PubMed] [Google Scholar]
- 20.Simopoulou T., Malizos K. N., Iliopoulos D., et al. Differential expression of leptin and leptin's receptor isoform (Ob-Rb) mRNA between advanced and minimally affected osteoarthritic cartilage; effect on cartilage metabolism. Osteoarthritis and Cartilage. 2007;15(8):872–883. doi: 10.1016/j.joca.2007.01.018. [DOI] [PubMed] [Google Scholar]
- 21.Findlay D. M. Vascular pathology and osteoarthritis. Rheumatology. 2007;46(12):1763–1768. doi: 10.1093/rheumatology/kem191. [DOI] [PubMed] [Google Scholar]
- 22.Oliveria S. A., Felson D. T., Cirillo P. A., Reed J. I., Walker A. M. Body weight, body mass index, and incident symptomatic osteoarthritis of the hand, hip, and knee. Epidemiology. 1999;10(2):161–166. doi: 10.1097/00001648-199903000-00013. [DOI] [PubMed] [Google Scholar]
- 23.Zhang Q., Li H., Zhang Z., Yang F., Chen J. Serum metabolites as potential biomarkers for diagnosis of knee osteoarthritis. Disease Markers. 2015;2015:7. doi: 10.1155/2015/684794.684794 [DOI] [PMC free article] [PubMed] [Google Scholar]
- 24.Ruiz-Romero C., Calamia V., Mateos J., et al. Mitochondrial dysregulation of osteoarthritic human articular chondrocytes analyzed by proteomics: a decrease in mitochondrial superoxide dismutase points to a redox imbalance. Molecular and Cellular Proteomics. 2009;8(1):172–189. doi: 10.1074/mcp.m800292-mcp200. [DOI] [PMC free article] [PubMed] [Google Scholar]
- 25.Conde J., Scotece M., López V., et al. Adipokines: novel players in rheumatic diseases. Discovery Medicine. 2013;15(81):73–83. [PubMed] [Google Scholar]
- 26.King L. K., Henneicke H., Seibel M. J., March L., Anandacoomarasmy A. Association of adipokines and joint biomarkers with cartilage-modifying effects of weight loss in obese subjects. Osteoarthritis and Cartilage. 2015;23(3):397–404. doi: 10.1016/j.joca.2014.11.020. [DOI] [PubMed] [Google Scholar]
- 27.Al-Arfaj A. S. Radiographic osteoarthritis and serum cholesterol. Saudi Medical Journal. 2003;24(7):745–747. [PubMed] [Google Scholar]
- 28.Tsezou A., Iliopoulos D., Malizos K. N., Simopoulou T. Impaired expression of genes regulating cholesterol efflux in human osteoarthritic chondrocytes. Journal of Orthopaedic Research. 2010;28(8):1033–1039. doi: 10.1002/jor.21084. [DOI] [PubMed] [Google Scholar]
- 29.de Munter W., van der Kraan P. M., van den Berg W. B., van Lent P. L. High systemic levels of low-density lipoprotein cholesterol: fuel to the flames in inflammatory osteoarthritis? Rheumatology. 2016;55(1):16–24. doi: 10.1093/rheumatology/kev270. [DOI] [PubMed] [Google Scholar]
- 30.Schett G., Kleyer A., Perricone C., et al. Diabetes is an independent predictor for severe osteoarthritis: results from a longitudinal cohort study. Diabetes Care. 2013;36(2):403–409. doi: 10.2337/dc12-0924. [DOI] [PMC free article] [PubMed] [Google Scholar]
- 31.Jonsson H., Helgadottir G. P., Aspelund T., et al. The presence of total knee or hip replacements due to osteoarthritis enhances the positive association between hand osteoarthritis and atherosclerosis in women: the AGES-Reykjavik study. Annals of the Rheumatic Diseases. 2011;70(6):1087–1090. doi: 10.1136/ard.2010.144980. [DOI] [PMC free article] [PubMed] [Google Scholar]
- 32.Miller D., Forrester K., Hart D. A., Leonard C., Salo P., Bray R. C. Endothelial dysfunction and decreased vascular responsiveness in the anterior cruciate ligament-deficient model of osteoarthritis. Journal of Applied Physiology. 2007;102(3):1161–1169. doi: 10.1152/japplphysiol.00209.2006. [DOI] [PubMed] [Google Scholar]
- 33.Zhou J. J., Ma J. D., Mo Y. Q., et al. Down-regulating peroxisome proliferator-activated receptor-gamma coactivator-1beta alleviates the proinflammatory effect of rheumatoid arthritis fibroblast-like synoviocytes through inhibiting extracellular signal-regulated kinase, p38 and nuclear factor-κB activation. Arthritis Research & Therapy. 2014;16, article 472 doi: 10.1186/s13075-014-0472-6. [DOI] [PMC free article] [PubMed] [Google Scholar]
- 34.Yoshimura N., Muraki S., Oka H., et al. Accumulation of metabolic risk factors such as overweight, hypertension, dyslipidaemia, and impaired glucose tolerance raises the risk of occurrence and progression of knee osteoarthritis: a 3-year follow-up of the ROAD study. Osteoarthritis and Cartilage. 2012;20(11):1217–1226. doi: 10.1016/j.joca.2012.06.006. [DOI] [PubMed] [Google Scholar]
- 35.Spector T. D., MacGregor A. J. Risk factors for osteoarthritis: genetics. Osteoarthritis and Cartilage. 2004;12:S39–S44. doi: 10.1016/j.joca.2003.09.005. [DOI] [PubMed] [Google Scholar]