Abstract
Background
Heavy metals can cause great harm to Siberian tigers in the natural environment. Cadmium (Cd2+) is an environmental contaminant that affects multiple cellular processes, including cell proliferation, differentiation, and survival. It has been shown to induce apoptosis in a variety of cell types and tissues.
Results
We investigated the apoptotic effects of Cd2+ on Siberian tiger fibroblasts in vitro. Our research revealed the typical signs of apoptosis after Cd2+ exposure. Apoptosis was dose- (0–4.8 μM) and duration-dependent (12–48 h), and proliferation was strongly inhibited. Cd2+ increased the activity of caspase-3, -8, and -9 and disrupted calcium homeostasis by causing oxidative stress and mitochondrial dysfunction. It also increased K+ efflux and altered the mRNA levels of Bax, Bcl-2, caspase-3, caspase-8, Fas, and p53.
Conclusions
Our results suggest that Cd2+ triggers the apoptosis of Siberian tiger fibroblasts by disturbing intracellular homeostasis. These results will aid in our understanding of the effects of Cd2+ on Siberian tigers and in developing interventions to treat and prevent cadmium poisoning.
Keywords: Siberian tiger, Cadmium, Apoptosis, Fibroblast, Calcium
Background
The tiger (Panthera tigris) ranges only in Asia [1]. There are four recognized subspecies of tigers in China, namely, the Siberian tiger (P. t. altaica) in northeast China, the Indochinese tiger (P. t. corbetti) in Yunnan, the South China tiger (P. t. amoyensis) in the middle east and south of China, and the India or Bengal tiger (P. t. tigris) in the Tibetan region. Currently, it is estimated that there are less than 400 Siberian tigers in eastern Russia, northeastern China, and Korea, with less than 20 ranging specifically in China [2, 3]. The remaining wild tiger population continues to shrink in China in response to increasing pressure from human-related factors. Moreover, the diversity of the tiger’s available genetic resources has gradually decreased. Habitat degradation is one reason why the tiger is on the edge of extinction and has become one of the most endangered large cat species in the world. With the rapid development of modern industry, agriculture, and transportation, the tiger habitat is under serious threat. It is especially threatened by cadmium (Cd2+) pollution, as this metal can cause great harm to the growth and development of tigers.
Cd2+ exists in the earth’s crust and is a naturally occurring heavy metal. It is an environmental and industrial pollutant that has increased in abundance worldwide, causing significant ecological problems. It is toxic even at low doses partly owing to its long biological half-life after ingestion or inhalation. Long-term exposure to Cd2+ causes a variety of pathological conditions and poisons many cell types, including kidney, liver, brain, testis, lung, and thymus, both in vitro and in vivo [4–6]. Cd2+ compounds promote tumorigenesis in the testes, lungs, and prostate as well as hematopoietic malignancies [7]. They also morphologically transform and induce chromosomal aberrations and gene mutations in cultured mammalian cells [8].
Cd2+ affects multiple cellular events, including proliferation, differentiation, and survival. It frequently alters the activity of biological molecules by binding to nitrogen, oxygen, or sulfur-containing groups, eventually disrupting normal cell function [9, 10]. Multiple lines of evidence indicate that apoptosis plays an important role in acute and chronic Cd2+ intoxication. Cd2+ has been shown to induce apoptosis, as indicated by cell contraction, annexin V overexpression, reactive oxygen species (ROS) generation, DNA fragmentation, and cell cycle arrest, in a dose-dependent manner [11, 12].
In the environment, Siberian tigers are exposed to Cd2+ via the consumption of contaminated food, water, and metal-smoldering fumes, which accounts in part for their dwindling numbers [13]. While Cd2+-induced apoptosis in Siberian tiger fibroblasts and other mammalian cell types has been documented, its underlying mechanisms remain unknown [14, 15]. Therefore, we aimed to further examine this process in Siberian tiger fibroblasts and to identify the responsible cellular and molecular mechanisms. We specifically evaluated the effects of Cd2+ on cell proliferation, mitochondrial function, calcium (Ca2+) homeostasis, caspase activation, and gene expression. We also established criteria for the early diagnosis of Cd2+ poisoning in Siberian tigers and the safety threshold for this metal. Lastly, we provide theoretical scientific and experimental information that will help protect Siberian tigers against Cd2+ poisoning.
Results
Growth dynamics
The Siberian tiger fibroblast growth curve showed a clear “S” shape, and the population doubling time (PDT) was 32 h (Fig. 1A). Cells entered the logarithmic growth phase 1–2 days after seeding and grew logarithmically from days 2–5. Cell density peaked on days 5 and 6 and subsequently declined.
Fig. 1.
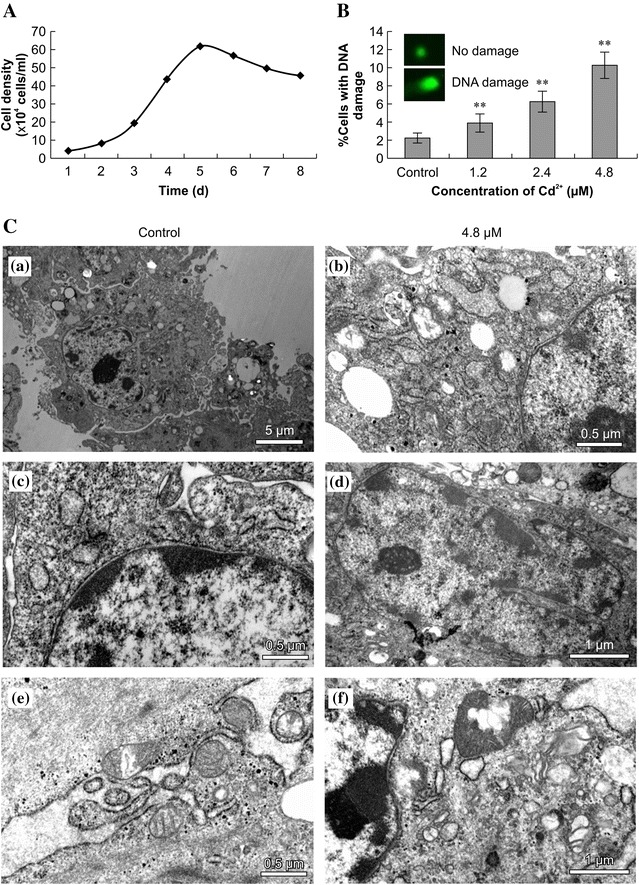
Comet assays and transmission electron microscopy (TEM). A Siberian tiger fibroblast growth curve. B Comet assays show DNA damage in Siberian tiger fibroblasts treated with cadmium (Cd2+) for 24 h. Statistically significant differences compared to the control cells are denoted by a double asterisk (P < 0.01; n = 3). C TEM shows disruption of the subcellular architecture in Siberian tiger fibroblasts treated with Cd2+ for 24 h. a, c, e control cells. b, d, f Cd2+ -treated cells. The scale bars are 5 μm (a), 0.5 μm (b, c, e), and 1 μm (d, f)
Comet assay
Control (no Cd2+) cells had intact nuclear DNA. In contrast, Cd2+-treated cells had DNA strand breaks, as well as DNA fragments that migrated along the electric field of the bright fluorescent tail in the comet assay (Fig. 1B). The size of the tail (which correlates with the severity of the damage) increased as a function of Cd2+ dose. These results indicate that Cd2+ undermines the integrity of the DNA of Siberian tiger fibroblasts. The comet assay has been shown to be a sensitive means of detecting nucleosome DNA fragmentation at the single-cell level [16].
Transmission electron microscopy (TEM)
Apoptosis is indicated by chromatin condensation, nuclear fragmentation, and nuclear and cytoplasmic blistering. The control cells had plump cytoplasm, as well as intact nuclear membranes and mitochondrial structures, whereas the Cd2+-treated cells contained small vacuoles, dense chromatin masses, and karyopyknotic nuclei (Fig. 1C). Moreover, the electron density of the cytoplasm of the treated cells was increased, indicating marginalization, and the nuclear membranes had begun to decompose.
Annexin V-fluorescein isothiocyanate (FITC)/propidium (PI) double-labeling
Apoptosis was quantified by measuring annexin V-FITC and PI staining (which indicates phosphatidylserine externalization) via flow cytometry. Cd2+ increased the percentage of stained cells, and within the dose range and time frame used in this experiment, this response was both dose- and time-dependent (Fig. 2). The apoptosis rate was significantly higher in the treated cells than in the control cells (P < 0.01). Moreover, 4.8 μM Cd2+ significantly increased the percentage of necrotic cells at 24, 36, and 48 h although not at 12 h (data not shown).
Fig. 2.
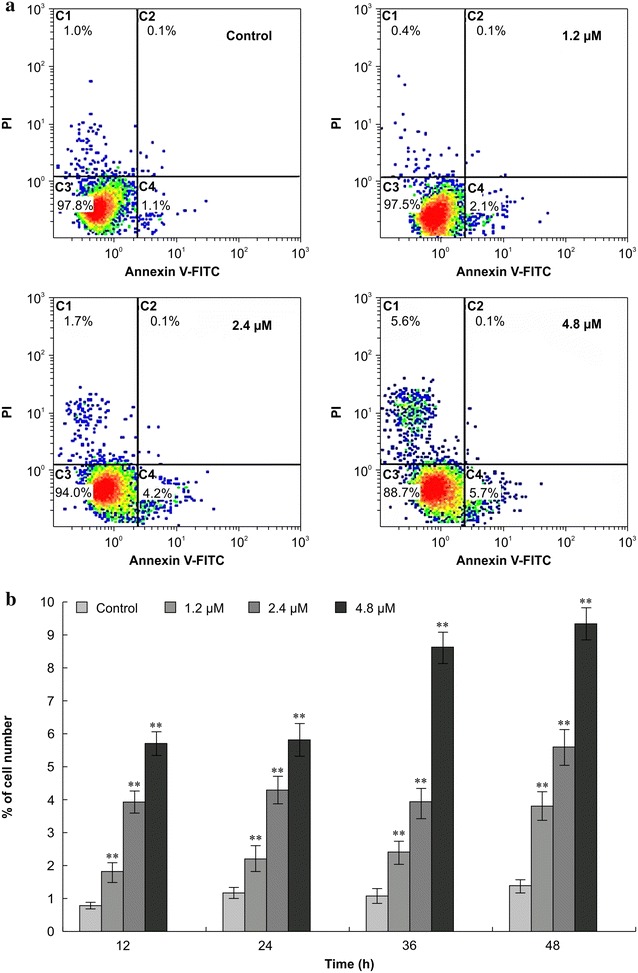
Annexin V-fluorescein isothiocyanate/propidium iodide double-labeling. a Percentage of stained Siberian tiger fibroblasts in the presence (24 h) or absence of cadmium (Cd2+). b Apoptotic rates of Siberian tiger fibroblasts treated with Cd2+ for 12, 24, 36 and 48 h. Statistically significant differences compared to the corresponding controls are denoted by a double asterisk (P < 0.01; n = 3)
Cell cycle analysis
To determine the mechanism underlying the toxic effect of Cd2+ on Siberian tiger fibroblasts, we analyzed cell cycle progression via flow cytometry. We found that the percentage of cells in the G0/G1 phase of the cell cycle increased, and the percentage of cells in the S and G2 phases correspondingly decreased, as Cd2+ concentration increased (Fig. 3). These results show a dose–response relationship between Cd2+ concentration and cell cycle perturbation.
Fig. 3.
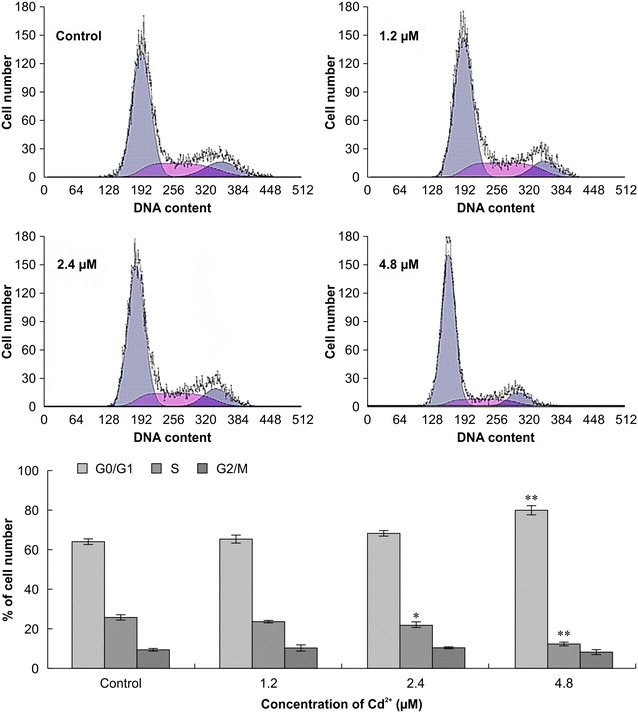
Cell cycle progression of Siberian tiger fibroblasts treated with cadmium for 24 h. The distribution of cells in the G0/G1, S, and G2/M phases of the cell cycle was determined via flow cytometry. Statistically significant differences compared with the corresponding controls are denoted by an asterisk (P < 0.05) and a double asterisk (P < 0.01; n = 3)
Mitochondrial membrane potential
5,5′, 6,6′-tetrachloro-1,1′,3,3′-tetraethylbenzimidazolcarbocyanine iodide (JC-1) is a lipophilic cationic dye that is selectively taken up by mitochondria. Its color changes from green to red as the membrane potential increases. In normal cells, JC-1 aggregates in the mitochondria and fluoresces red. In apoptotic or necrotic cells, JC-1 is monomeric and stains the cytoplasm green. Thus, the number of C-gated cells reflects the mitochondrial membrane potential, and a greater number indicates a reduction in mitochondrial membrane potential. Cells treated with Cd2+ had a significantly lower mitochondrial membrane potential than did control cells (P < 0.01; Fig. 4).
Fig. 4.
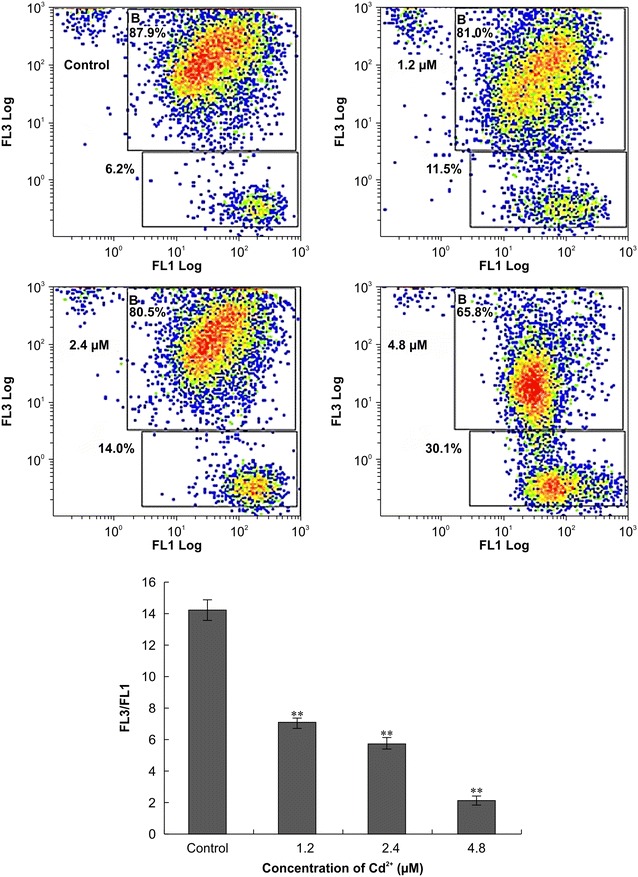
Mitochondrial membrane potential of Siberian tiger fibroblasts treated with cadmium for 24 h. Statistically significant differences compared with the control are denoted by a double asterisk (P < 0.01; n = 3)
Intracellular Ca2+ homeostasis
Our results show that increases in Cd2+ concentration progressively reduce the mitochondrial membrane potential in Siberian tiger fibroblasts (i.e., increase the green/red fluorescence ratio), which is indicative of apoptosis. Decreases in mitochondrial membrane potential are caused by increases in the free Ca2+ concentration [17]. The green fluorescence seen in cells treated with 2.4 or 4.8 μM Cd2+ was widely distributed, indicating that intracellular calcium homeostasis had been severely disrupted (Fig. 5).
Fig. 5.
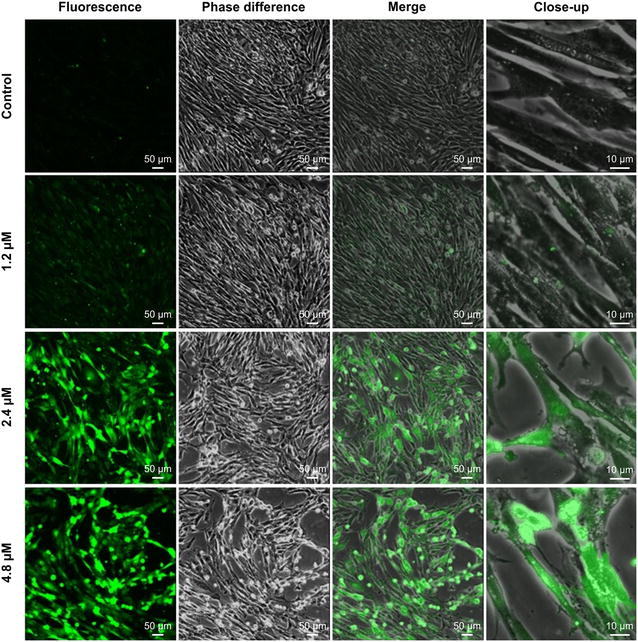
Effects of cadmium on intracellular calcium homoeostasis in Siberian tiger fibroblasts. Cells received Cd2+ for 24 h. The fluorescence, phase difference, and merged image scale bars are 50 μm. The close-up image scale bar is 10 μm
ROS analysis
ROS are subcellular messengers that play a role in several cellular processes, including apoptosis. We used ROS green fluorescence probes with 2′,7′- dichlorodihydrofluorescein-diacetate (DCFH-DA) detection to identify apoptotic cells via confocal microscopy. We found an increase in ROS levels, as indicated by a more intense green fluorescence signal, in cells receiving the higher Cd2+ concentrations (Fig. 6). Moreover, the green fluorescence that resulted from 4.8 μM Cd2+ treatment was distributed throughout the cell.
Fig. 6.
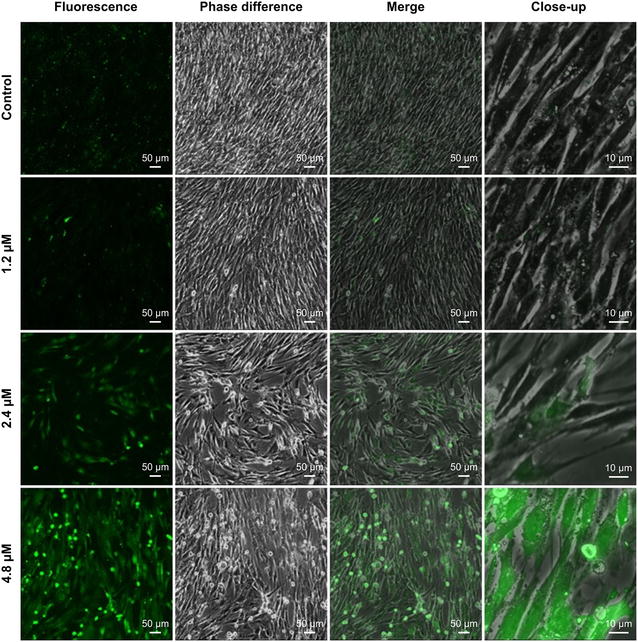
Effects of cadmium (Cd2+) on intracellular reactive oxygen species levels in Siberian tiger fibroblasts. Cells received Cd2+ for 24 h. The fluorescence, phase difference, and merge image scale bars are 50 μm. The close-up image scale bar is 10 μm
Extracellular Ca2+ and potassium (K+) flux measurement
Using the microelectrode ion flux estimation (MIFE) technique, we assessed the size and direction of Ca2+ and K+ flow (vertical axis) over time (horizontal axis) in control and Cd2+-treated Siberian tiger fibroblasts. The abscissa (positive) on the top curve represents Ca2+ and K+ outflow, while the abscissa on the lower curve represents Ca2+ and K+ inflow (Fig. 7a). Experimental results showed that Ca2+ influx mainly occurred after Cd2+ addition (0–200 s), whereas K+ influx was apparent before addition (0–200 s). Both Ca2+ and K+ efflux increased after Cd2+ addition (200–800 s), and the flow rate tended to increase over time. There were significant differences in Ca2+ and K+ flux before and after treatment.
Fig. 7.
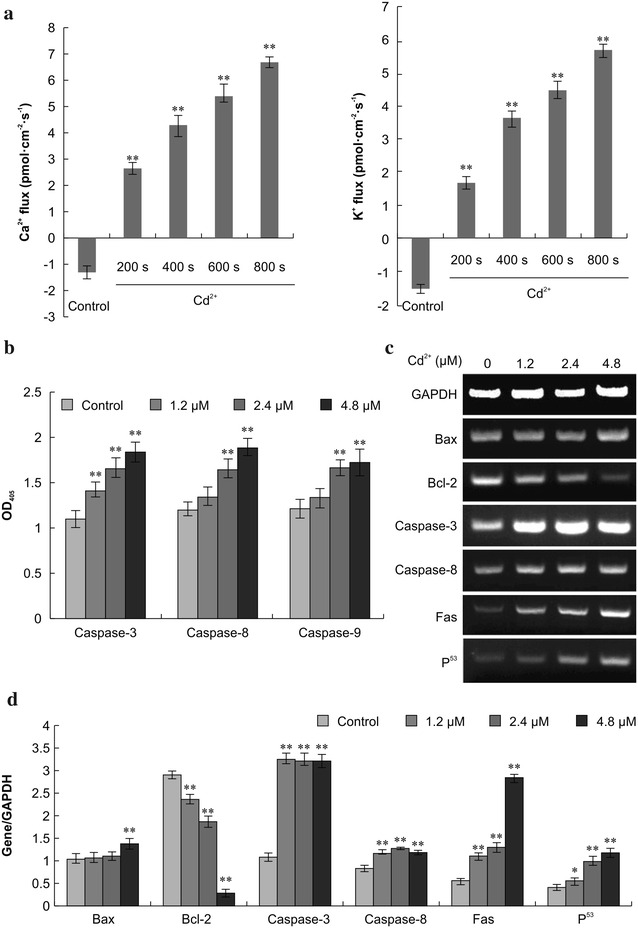
Calcium (Ca2+) and potassium (K+) flux, caspase activity, and gene expression. a Ca2+ and K+ flux was measured before and after treatment of Siberian tiger fibroblasts with 4.8 μM Cd2+ by using the ion flux estimate technique. Statistically significant differences compared to the corresponding controls are denoted by an asterisk (P < 0.05) and a double asterisk (P < 0.01; n = 3). b Activities of caspase-3, -8, and -9 were determined in cytosolic extracts of Siberian tiger fibroblasts. c, d Expression levels of the indicated mRNAs were determined via reverse transcription-polymerase chain reaction 24 h after exposure to Cd2+ and normalized to glyceraldehyde-3-phosphate dehydrogenase mRNA levels
Caspase-3, -8, and -9 activity
Caspase-3, -8, and -9 are reactive proteases that play important roles in the apoptotic process. We evaluated their activity by using a spectrophotometer to detect cleaved substrates; higher optical density values indicate greater caspase activity. Caspase-3 activity was more pronounced in cells in cells receiving 1.2, 2.4, or 4.8 μM Cd2+ than in control cells (P < 0.01, Fig. 7b). Cd2+ also markedly increased the activity of caspase-8 and -9 at 2.4 and 4.8 μM (P < 0.01), although not at 1.2 μM. Collectively, these results indicate that Cd2+ activates caspase-3, -8, and -9 in Siberian tiger fibroblasts.
Reverse transcription polymerase chain reaction (RT-PCR)
Bax, Bcl-2, caspase-3, caspase-8, Fas, and p53 mRNA expression levels were determined via RT-PCR. Bcl-2 and activated Bax reside in the outer mitochondrial membrane, and the Bax/Bcl-2 ratio determines whether apoptosis will be inhibited or promoted. RT-PCR analysis showed that Cd2+ significantly increased the expression of Bax mRNA, as well as that of caspase-3, caspase-8, Fas, and p53 mRNA (P < 0.05 in all cases). Cd2+ also significantly reduced Bcl-2 mRNA levels (P < 0.01; Fig. 7c, d). Thus, exposure to Cd2+ may increase the Bax/Bcl-2 protein ratio in Siberian tiger fibroblasts.
Discussion
Cd2+ is a ubiquitous toxic metal that exerts genotoxic effects and induces apoptosis in many cell types [18, 19]. In vitro studies have shown that low concentrations of Cd2+ trigger apoptosis, while higher concentrations induce necrosis [20]. Cd2+ exposure can also inhibit the generation of mitochondrial ATP, leading to oxidative stress, caspase activation, and inappropriate gene expression [21]. Long-term exposure to Cd2+ resulted in emphysema in rat lung in vivo models [22].
Our previous study suggested that Cd2+ induced apoptosis in Siberian tiger fibroblasts by inhibiting DNA synthesis, reducing mitochondrial membrane potential, and interfering with Ca2+ homeostasis [15]. In this study, we evaluated the impact of Cd2+ toxicity on Siberian tiger fibroblasts, specifically assessing how the metal affected cell function and how it induced changes in cell morphology. We evaluated Cd2+-induced damage to subcellular structures, cell atrophy, mitochondrial depolarization, and chromatin condensation. Cd2+-induced apoptosis led to phosphatidylserine translocation from the inner cell membrane to the surface of the cell, and this effect was dose- and time-dependent in the range of 0–4.8 μM Cd2+ over 12–48 h. High concentrations of Cd2+ did not further increase apoptosis, but instead increased necrosis.
Physiological and pathological apoptotic stimuli affect cell cycle progression [23], and cell cycle arrest can induce apoptosis. Thus, analysis of the cell cycle is one of the most important measurements of apoptotic activity [24]. Our data showed that increasing concentrations of Cd2+ increased the proportion of cells in G0/G1 and reduced the proportion cells in S phase. This finding indicates that exposure of Siberian fibroblasts to Cd2+ promotes G0/G1 arrest and consequently precludes S phase entry and cell proliferation. Therefore, we speculate that the destructive effects of Cd2+ on Siberian tiger fibroblasts are due to inhibition of DNA replication and cell cycle progression, resulting in Siberian tiger fibroblast apoptosis. This is an important finding that will contribute to future research aimed at understanding the mechanisms of Cd2+-induced apoptosis in tiger fibroblast cells.
Our findings suggest that Cd2+-induced apoptosis in Siberian tiger fibroblasts results from activation of caspase-3, -8, and -9 and thus via a caspase-dependent pathway. Both intrinsic (caspase-9-mediated) and extrinsic (caspase-8-mediated) apoptotic pathways have been shown to trigger caspase activation in cells undergoing apoptosis [25, 26].
Cd2+ exposure indirectly causes oxidative stress, namely by reducing the intracellular levels of antioxidants and by increasing the generation of ROS via mitochondrial dysfunction [27, 28]. Excess ROS can have serious impacts on mitochondria, leading to oxidative damage, which promotes steroidogenesis in the liver and kidney. We previously found that exposure to Cd2+ at low levels for 90 days disrupted the balance between ROS production and the antioxidant defense [29]. Here we show that, at certain concentrations, Cd2+ increases ROS levels, destroying the cell oxidant-antioxidant balance. Such an imbalance could result in oxidative damage, and we suggest that oxidative damage is one of the underlying mechanisms of Cd2+-induced apoptosis in Siberian tiger fibroblasts.
A drop in the mitochondrial membrane potential below a certain threshold is an early event in apoptosis. The current study showed decreases in the mitochondrial membrane potential of Siberian tiger fibroblasts with increasing concentrations of Cd2+. This finding suggests that mitochondria may be a critical target of Cd2+ cytotoxicity, since a disruption in the electrochemical gradient of the mitochondrial membrane may initiate the apoptotic pathway [30, 31]. However, the specific toxic effects of Cd2+ on mitochondria and the relative sensitivity of different mitochondrial sites to the processing of Cd2+ are not well understood.
Ca2+ as a second messenger is necessary for cell metabolism, and it is well accepted that a disruption in Ca2+ homeostasis can induce apoptosis in multiple ways. Our data showed that Cd2+ exposure increased free Ca2+ levels in the cytoplasm, allowing intracellular Ca2+ homeostasis to be disturbed. This homeostatic disruption likely led to the drop in mitochondrial membrane potential, which could have caused further release of Ca2+ from the endoplasmic reticulum. Previous studies identify the sources of free intracellular Ca2+ levels as Ca2+ released from intracellular stores and Ca2+ imported from outside the cell. Here, we found that Ca2+ flowed into the cell before Cd2+ treatment, but exited after treatment. This finding suggests that the observed increase in free intracellular Ca2+ levels was due to the release of endogenous Ca2+ stores, rather than the absorption of extracellular Ca2+. Further investigations of the role of Ca2+ in Cd2+-induced apoptosis will be important for a full understanding of the mechanisms of Cd2+ toxicity.
Similar to cell shrinkage, nuclear condensation, DNA breakage, and formation of apoptotic bodies, the loss of K+ is an early characteristic of apoptosis [32]. The loss of intracellular K+ results in an intracellular hypotonic state and accounts in part for shrinkage of the cell body [33]. Our results showed K+ influx before Cd2+ exposure and efflux after exposure. Further, we observed that the K+ flow rate exhibited an increasing trend with the extension of treatment time.
The Bcl-2 family of proteins consists of both pro-apoptotic members, such as Bax, and anti-apoptotic members, such as Bcl-2. The ratio of anti-apoptotic to apoptotic forms appears to dictate the response to a death stimulus, although both Bcl-2 and Bax can regulate apoptosis independently of one another. Bax and Bcl-2 expression has been reported in a variety of cell types, and it appears that Cd2+ treatment is associated with apoptosis [34]. Caspase-8 is considered to be an upstream (initiator) caspase because it interacts with adaptor proteins following activation of cell-surface death receptors [35]. The addition of cytochrome c to Jurkat cell-free extracts initiates a cascade of protease activation in vitro that involves caspase-3, -8, and -9 [36]. The death receptor Fas also plays a role in mediating apoptosis, with an up-regulation of this molecule enhancing signal transduction in the cell death cascade [37, 38]. Finally, p53 is known to execute mitochondria-mediated apoptosis via transcription-dependent and -independent pathways [39]. Activation of the p53 pathway is required for apoptosis induction by growth factor withdrawal, hypoxia, and DNA damage [40, 41].
While the specific association between the abovementioned molecules and Cd2+ in Siberian tiger fibroblasts is unknown, the present results show an upregulation of p53 mRNA following Cd2+ exposure. Further, we observed that Cd2+ reduced the mRNA expression of Bcl-2, but not of Bax, caspase-3, caspase-8, or Fas, in a dose-dependent manner. Thus, the exposure of Siberian tiger fibroblast to Cd2+ greatly increased the Bax/Bcl-2 mRNA ratio. It should be noted that a previous study showed that Cd2+-induced apoptosis involves mitochondrial stress due to the downregulation of anti-apoptotic factors [42]. However, suppression of Bcl-2 gene expression is a complex phenomenon, which involves inactivation of transcription factors or their inability to bind the Bcl-2 gene promoter.
Conclusion
In short, exposure of Siberian tiger fibroblasts to Cd2+ significantly increased cytotoxicity, apoptosis, and necrosis. These events were associated with inhibition of DNA synthesis, Ca2+ overload, oxidative stress, K+ outflow, gene expression, and mitochondrial dysfunction. Our study shows that Cd2+ treatment can induce apoptosis via the mitochondrial pathway and disrupt intracellular homeostasis in Siberian tiger fibroblasts. These results provide insight into the mechanisms of Cd2+-apoptosis, as well as the adverse effects of Cd2+ on the Siberian tiger. Although the results of our study offer useful information for conserving the Siberian tiger population, we note that in vitro experimental systems do not fully recapitulate the mechanisms of Cd2+-induced apoptosis in living organisms.
Methods
Materials
Siberian tiger fibroblasts were provided by the Institute of Animal Science at the Chinese Academy of Agricultural Sciences. They were authenticated by the supplier and tested for contamination, with negative results. PI and cadmium chloride (CdCl2) were purchased from Sigma-Aldrich (St. Louis, MO, USA). Dulbecco’s modified Eagle’s medium (DMEM) and fetal bovine serum (FBS) were purchased from Gibco/BRL (Grand Island, NY, USA). The annexin V-FITC Apoptosis Detection Kit I was purchased from Becton, Dickinson and Company (Franklin Lakes, NJ, USA).
Cell culture
Cells were cultured in DMEM supplemented with 10 % FBS at 37 °C under humidified conditions with 5 % CO2 and 95 % air in the atmosphere. The medium was refreshed every other day. Cells were detached from the flasks and split 1:1 when they reached 80–90 % confluence.
Growth dynamics
Suspended cells (1 ml) were seeded into 24-well microplates at a concentration of 2 × 10⁴ cells ml−1. The growth rate was determined by using a hemocytometer; the number of cells in three grids was determined each day for 8 days. A growth curve was drawn, and the PDT was calculated based on the curve.
Drug solution preparation and cell treatment
Cd2+ was supplied to cells as CdCl2, which was dissolved in DMEM and sterilized by filtration. Logarithmically growing cells were treated with a series of Cd2+ concentrations (0, 1.2, 2.4, or 4.8 μM) for predetermined times [43, 44].
Comet assay
Using ice-cold phosphate-buffered saline (PBS), cells were washed and suspended at a concentration of 1 × 10⁵ cells ml−1. The comet assay was performed by using the Alkaline Comet Assay kit (Trevigen Inc., Gaithersburg, MD, USA) as per the manufacturer’s instructions. Briefly, the cell suspension was mixed with low melting point-agarose, chilled, and stored in ice-cold lysis buffer (Trevigen Inc.) at 4 °C. The comet slides were immersed sequentially in alkaline electrophoresis buffer and 70 % ethanol. Comet cell DNA was then stained with SYBR Green (Sigma-Aldrich), and cells were imaged by using a confocal microscope (TE-2000-E; Nikon, Tokyo, Japan).
TEM
Cells were washed twice in PBS and fixed with 2.5 % (m v−1) glutaraldehyde followed by 1 % osmium tetroxide. They were then embedded in epoxy resin and acetone, and the samples were allowed to solidify after being dehydrated through a gradient of ethanol concentrations (30, 50, 70, 80, 90 and 100 %). Ultrathin Sects. (50 nm) were prepared with uranyl acetate and lead citrate for TEM (JEM-2000EX; JEOL Ltd., Tokyo, Japan).
Annexin V-FITC/PI double-labeling
The annexin V-FITC Apoptosis Detection Kit I was used in accordance with the manufacturer’s instructions. Cells (5 × 10⁵ ml−1 in 100 μl binding buffer) were incubated with 5 μl FITC and 5 μl PI for 15 min, and 400 μl binding buffer was added to each sample before analysis of the stained cells via flow cytometry (FC500; Beckman Coulter Corp., Brea, CA, USA). At least 10,000 cells per sample were analyzed. Experiments were performed in triplicate.
Cell cycle analysis
Cells were suspended in ice-cold 70 % ethanol and kept at 4 °C overnight. Cells were then incubated with RNase A (0.02 mg ml−1) and stained with PI (PI 0.05 mg ml−1) in a buffer containing 0.585 g ml−1 NaCl and 1 mg ml−1 sodium citrate, pH 7.2–7.6) at 4 °C for 30 min before being run through the flow cytometer (FC500). A total of 10,000 cells were recorded for each sample, and the percentages of cells in the G0/G1, S, and G2/M phases of the cell cycle were plotted as DNA histograms.
Mitochondrial membrane potential
Cells (1 × 10⁶ ml−1) were incubated with JC-1 (5 g ml−1, 0.5 ml sample−1) at 37 °C for 15 min and rinsed in JC-1 staining buffer. Each sample was resuspended in 0.5 ml of PBS and then immediately analyzed via flow cytometry (FC500). At least 10,000 cells were evaluated in each sample.
Intracellular Ca2+ homeostasis
Cells (1–2 × 10⁶ ml−1) were loaded with 1-[2-amino-5-(2,7-dichloro-6-acetoxymethoxy-3-oxo-9-xanthenyl)phenoxy]-2-(2-amino-5-methylphenoxy)ethane-N,N,N’,N’-tetraacetic acid, tetra(acetoxymethyl)ester (Fluo3-AM; Invitrogen, Carlsbad, CA, USA) (final concentration 5–10 µM in dimethyl sulfoxide) and incubated at 37 °C in 5 % CO2 for 30–60 min in the dark. They were gently shaken a few times during incubation and then washed twice with DMEM. A negative control was also prepared (not Fluo3-AM-loaded), and cells were observed and photographed by using a confocal microscope (TE-2000-E).
ROS analysis
Cells (1–2 × 10⁶ ml−1) were loaded with DCFH-DA (Molecular Probes, Eugene, OR, USA) at a final concentration of 10 μM. Cells were incubated at 37 °C in 5 % CO2 for 20 min, gently shaken a few times, and then washed twice with serum-free DMEM. Cells were observed and photographed via confocal microscopy (TE-2000-E).
Extracellular Ca2+ and K+ flux measurement
The MIFE technique, which noninvasively measures Ca2+ and K+ fluxes, was carried out by using selective microelectrodes according to the methodology previously described for the surface measurement of a net flow of ions in dense cell monolayers [33, 45]. Briefly, cells (1 ml, 1 × 10⁵ ml−1) were seeded in petri dishes and treated with Cd2+ during the logarithmic growth phase. Before and after testing with each electrode, Ca2+ and K+ levels were determined by using calibration standards. Ion flux between two microelectrode positions—one close to the cell monolayer (5 µm) and one further away (up to 20 μm)—was measured as the electrochemical potential of Ca2+ and K+ at the two offset points.
Caspase-3, -8, and -9 activity assay
The activities of caspase-3, -8, and -9 were evaluated by using the Colorimetric Assay kit (Pik-Day Biotechnology, Haimen, China). Protein concentrations of the supernatants of cell lysates (100 µl lysate obtained from 2 × 10⁶ cells) were determined using the Bradford Assay kit (Beyotime Biotechnology, Haimen, China). Protein-normalized supernatants (10 µl) were mixed with 10 µl of Ac-DEVD-pNA (2 mM) for caspase-3, Ac-IETD-pNA (2 mM) for caspase-8, or Ac-LEHD-pNA (2 mM) for caspase-9 in assay buffer. Activity was determined via spectrophotometric measurement of the reaction product (ND-1000; NanoDrop Technology, Wilmington, DE, USA).
Reverse transcription-polymerase chain reaction (RT-PCR)
Total RNA was extracted from cells, and synthesis of the first cDNA strand was performed by using a PrimerScript TM RT kit (Takara, Dalian, China). The primer pairs for the genes encoding Bax, Bcl-2, caspase-3, caspase-8, Fas, p53, and glyceraldehyde-3-phosphate dehydrogenase (a housekeeping protein) were designed by using Premier 5.0 software (Premier Biosoft, Palo Alto, CA, USA) and synthesized by Shanghai Biological Technology Co., Ltd. (Shanghai, China). The PCR conditions were as follows: denaturation at 94 °C for 5 min, 30 cycles of 30 s each at 94 °C, 30 s of annealing, 72 °C for 30 s and a 72 °C extension for 10 min. PCR products were identified via electrophoreses on 1.5 % agarose gels.
Statistical analysis
We repeated each experiment at least three times to confirm reproducibility. All values are expressed as mean ± standard deviation. Data were analyzed by using Statistical Analysis System software (SAS Institute Inc., Cary, NC, USA), and compared by using Duncan’s multiple comparison test. P < 0.05 was considered statistically significant.
Authors’ contributions
HW and ZL carried out most of the experiments and drafted the manuscript. WZ performed the remaining experiments with assistance from ZH. HY and XL analyzed the data, and CY designed the studies and wrote the final report. WG conceived and designed the studies, oversaw the experiments, and was responsible for the decision to submit the article for publication. All authors read and approved the final manuscript.
Acknowledgements
This work was supported by the Natural Science Foundation of Liaoning Province (2014022042), and the Agricultural Science and Technology Innovation Program (ASTIP; cxgc-ias-01).
Competing interests
The authors declare that they have no competing interests.
Availability of data and materials
All data generated or analyzed during this study are included in this published article.
Abbreviations
- Ca2+
calcium
- Cd2+
cadmium
- CdCl2
cadmium chloride
- DCFH-DA
2′, 7′-dichlorodihydrofluorescein-diacetate
- DMEM
Dulbecco’s modified Eagle’s medium
- FBS
fetal bovine serum
- FITC
fluorescein isothiocyanate
- JC-1
5,5′, 6,6′-tetrachloro-1,1′,3,3′-tetraethylbenzimidazolcarbocyanine iodide
- MIFE
microelectrode ion flux estimation
- PBS
phosphate-buffered saline
- PDT
population doubling time
- PI
propidium iodide
- ROS
reactive oxygen species
- RT-PCR
reverse transcription polymerase chain reaction
- TEM
transmission electron microscopy
Footnotes
Hui Wang and Zheng Liu contributed equally to this work
Contributor Information
Hui Wang, Email: wanghuily2013@hotmail.com.
Zheng Liu, Email: Liuzhengly2013@163.com.
Wenxiu Zhang, Email: Zhangwenxiu2015@163.com.
Ziao Yuan, Email: Yuanziao1@163.com.
Hongyi Yuan, Email: Yuanhongyi11@163.com.
Xueting Liu, Email: Liuxueting1234567@163.com.
Chunwen Yang, Email: Chunwen_yang@163.com.
Weijun Guan, Email: guanweijun@outlook.com.
References
- 1.Song J, Hua S, Song K, Zhang Y. Culture, characteristics and chromosome complement of Siberian tiger fibroblasts for nuclear transfer. In Vitro Cell Dev Biol Anim. 2007;43:203–209. doi: 10.1007/s11626-007-9043-3. [DOI] [PubMed] [Google Scholar]
- 2.Wei K, Zhang Z, Zhang W, Xu X, Liang X, He G, et al. PCR-CTPP: a rapid and reliable genotyping technique based on ZFX/ZFY alleles for sex identification of tiger (Panthera tigris) and four other endangered felids. Conserv Genet. 2008;9:225–228. doi: 10.1007/s10592-006-9279-6. [DOI] [Google Scholar]
- 3.Sugimoto T, Nagata J, Aramilev VV, Belozor A, Higashi S, McCullough DR. Species and sex identification from faecal samples of sympatric carnivores, Amur leopard and Siberian tiger, in the Russian Far East. Conserv Genet. 2006;7:799–802. doi: 10.1007/s10592-005-9071-z. [DOI] [Google Scholar]
- 4.Go YM, Roede JR, Orr M, Liang Y, Jones DP. Integrated redox proteomics and metabolomics of mitochondria to identify mechanisms of Cd toxicity. Toxicol Sci. 2014;139:59–73. doi: 10.1093/toxsci/kfu018. [DOI] [PMC free article] [PubMed] [Google Scholar]
- 5.Pappas RS, Fresquez MR, Watson CH. Cigarette smoke cadmium breakthrough from traditional filters: implications for exposure. J Anal Toxicol. 2015;39:45–51. doi: 10.1093/jat/bku115. [DOI] [PMC free article] [PubMed] [Google Scholar]
- 6.Xu C, Wang X, Zhu Y, Dong X, Liu C, Zhang H, et al. Rapamycin ameliorates cadmium-induced activation of MAPK pathway and neuronal apoptosis by preventing mitochondrial ROS inactivation of PP2A. Neuropharmacology. 2016;105:270–284. doi: 10.1016/j.neuropharm.2016.01.030. [DOI] [PMC free article] [PubMed] [Google Scholar]
- 7.Zhai Q, Wang G, Zhao J, Liu X, Narbad A, Chen YQ, et al. Protective effects of Lactobacillus plantarum CCFM8610 against chronic cadmium toxicity in mice indicate routes of protection besides intestinal sequestration. Appl Environ Microbiol. 2014;80:4063–4071. doi: 10.1128/AEM.00762-14. [DOI] [PMC free article] [PubMed] [Google Scholar]
- 8.Choe SY, Kim SJ, Kim HG, Lee JH, Choi Y, Lee H, et al. Evaluation of estrogenicity of major heavy metals. Sci Total Environ. 2003;312:15–21. doi: 10.1016/S0048-9697(03)00190-6. [DOI] [PubMed] [Google Scholar]
- 9.Siewit C, Gengler B, Vegas E, Puckett R, Louie MC. Cadmium promotes breast cancer cell proliferation by potentiating the interaction between ERα and c-Jun. Mol Endocrinol. 2010;24:981–992. doi: 10.1210/me.2009-0410. [DOI] [PMC free article] [PubMed] [Google Scholar]
- 10.Chen CY, Zhang SL, Liu ZY, Tian Y, Sun Q. Cadmium toxicity induces ER stress and apoptosis via impairing energy homoeostasis in cardiomyocytes. Biosci Rep. 2015 doi: 10.1042/BSR20140170. [DOI] [PMC free article] [PubMed] [Google Scholar]
- 11.Sokolova IM, Evans S, Hughes FM. Cadmium-induced apoptosis in oyster hemocytes involves disturbance of cellular energy balance but no mitochondrial permeability transition. J Exp Biol. 2004;207:3369–3380. doi: 10.1242/jeb.01152. [DOI] [PubMed] [Google Scholar]
- 12.Park CH, Lee BH, Ahn SG, Yoon JH, Oh SH. Serine 9 and tyrosine 216 phosphorylation of GSK-3β differentially regulates autophagy in acquired cadmium resistance. Toxicol Sci. 2013;135:380–389. doi: 10.1093/toxsci/kft158. [DOI] [PubMed] [Google Scholar]
- 13.Yin F, Huang JH. The status of the tiger and it’s induced risk factors. Chinese Wildlife. 1999;20:26–27. [Google Scholar]
- 14.Shih CM, Ko WC, Wu JS, Wei YH, Wang LF, Chang EE, et al. Mediating of caspase-independent apoptosis by cadmium through the mitochondria-ROS pathway in MRC-5 fibroblasts. J Cell Biochem. 2004;91:384–397. doi: 10.1002/jcb.10761. [DOI] [PubMed] [Google Scholar]
- 15.Wang H, Li X, Ma Y, Guan W, Liu D. Apoptotic effects of cadmium on Siberian tiger fibroblast cell. Asian J Anim Vet Adv. 2013;8:1–15. doi: 10.3923/ajava.2013.1.15. [DOI] [Google Scholar]
- 16.Jeong YT, Rossi M, Cermak L, Saraf A, Florens L, Washburn MP, et al. FBH1 promotes DNA double-strand breakage and apoptosis in response to DNA replication stress. J Cell Biol. 2013;200:141–149. doi: 10.1083/jcb.201209002. [DOI] [PMC free article] [PubMed] [Google Scholar]
- 17.Verma G, Himanshi BH, Datta D. JNK1/2 regulates ER–mitochondrial Ca2+ cross-talk during IL-1β–mediated cell death in RINm5F and human primary β-cells. Mol Biol Cell. 2013;24:2058–2071. doi: 10.1091/mbc.E12-12-0885. [DOI] [PMC free article] [PubMed] [Google Scholar]
- 18.Chargui A, Zekri S, Jacquillet G, Rubera I, Ilie M, Belaid A, et al. Cadmium-induced autophagy in rat kidney: an early biomarker of subtoxic exposure. Toxicol Sci. 2011;121:31–42. doi: 10.1093/toxsci/kfr031. [DOI] [PubMed] [Google Scholar]
- 19.Guo P, Pi H, Xu S, Zhang L, Li Y, Li M, et al. Melatonin improves mitochondrial function by promoting MT1/SIRT1/PGC-1 alpha-dependent mitochondrial biogenesis in cadmium-induced hepatotoxicity in vitro. Toxicol Sci. 2014;142:182–195. doi: 10.1093/toxsci/kfu164. [DOI] [PMC free article] [PubMed] [Google Scholar]
- 20.Messner B, Ploner C, Laufer G, Bernhard D. Cadmium activates a programmed, lysosomal membrane permeabilization-dependent necrosis pathway. Toxicol Lett. 2012;212:268–275. doi: 10.1016/j.toxlet.2012.05.026. [DOI] [PubMed] [Google Scholar]
- 21.Zhai Q, Wang G, Zhao J, Liu X, Tian F, Zhang H, et al. Protective effects of lactobacillus plantarum CCFM8610 against acute cadmium toxicity in mice. Appl Environ Microbiol. 2013;79:1508–1515. doi: 10.1128/AEM.03417-12. [DOI] [PMC free article] [PubMed] [Google Scholar]
- 22.Zhao Y, Chen L, Gao S, Toselli P, Stone P, Li W. The critical role of the cellular thiol homeostasis in cadmium perturbation of the lung extracellular matrix. Toxicology. 2010;267:60–69. doi: 10.1016/j.tox.2009.10.021. [DOI] [PMC free article] [PubMed] [Google Scholar]
- 23.Kurochkin IO, Etzkorn M, Buchwalter D, Leamy L, Sokolova IM. Top-down control analysis of the cadmium effects on molluscan mitochondria and the mechanisms of cadmium-induced mitochondrial dysfunction. Am J Physiol Regul Integr Comp Physiol. 2011;300:R21–R31. doi: 10.1152/ajpregu.00279.2010. [DOI] [PubMed] [Google Scholar]
- 24.Srivastava SK, Bhardwaj A, Singh S, Arora S, McClellan S, Grizzle WE, et al. Myb overexpression overrides androgen depletion-induced cell cycle arrest and apoptosis in prostate cancer cells, and confers aggressive malignant traits: potential role in castration resistance. Carcinogenesis. 2012;33:1149–1157. doi: 10.1093/carcin/bgs134. [DOI] [PMC free article] [PubMed] [Google Scholar]
- 25.Utz PJ, Anderson P. Life and death decisions: regulation of apoptosis by proteolysis of signaling molecules. Cell Death Differ. 2000;7:589–602. doi: 10.1038/sj.cdd.4400696. [DOI] [PubMed] [Google Scholar]
- 26.Al-Assaf AH, Alqahtani AM, Alshatwi AA, Syed SA, Shafi G, Hasan TN. Mechanism of cadmium induced apoptosis in human peripheral blood lymphocytes: the role of p53, Fas and Caspase-3. Environ Toxicol Pharmacol. 2013;36:1033–1039. doi: 10.1016/j.etap.2013.09.006. [DOI] [PubMed] [Google Scholar]
- 27.Joseph P. Mechanisms of cadmium carcinogenesis. Toxicol Appl Pharmacol. 2009;238:2772–2779. doi: 10.1016/j.taap.2009.01.011. [DOI] [PubMed] [Google Scholar]
- 28.Wang Y, Wu Y, Luo K, Liu Y, Zhou M, Yan S, et al. The protective effects of selenium on cadmium-induced oxidative stress and apoptosis via mitochondria pathway in mice kidney. Food Chem Toxicol. 2013;58:61–67. doi: 10.1016/j.fct.2013.04.013. [DOI] [PubMed] [Google Scholar]
- 29.Dai S, Yin Z, Yuan G, Lu H, Jia R, Xu J, et al. Quantification of metallothionein on the liver and kidney of rats by subchronic lead and cadmium in combination. Environ Toxicol Pharmacol. 2013;36:1207–1216. doi: 10.1016/j.etap.2013.10.003. [DOI] [PubMed] [Google Scholar]
- 30.Krzymińska S, Tańska A, Kaznowski A. Aeromonas spp. induce apoptosis of epithelial cells through an oxidant-dependent activation of the mitochondrial pathway. J Med Microbiol. 2011;60:889–898. doi: 10.1099/jmm.0.030833-0. [DOI] [PubMed] [Google Scholar]
- 31.Liu W, Zhao H, Wang Y, Jianga C, Xia P, Jianhong Gua J, et al. Calcium–calmodulin signaling elicits mitochondrial dysfunction and the release of cytochrome c during cadmium-induced apoptosis in primary osteoblasts. Toxicol Lett. 2014;224:1–6. doi: 10.1016/j.toxlet.2013.10.009. [DOI] [PubMed] [Google Scholar]
- 32.Hengartner MO. The biochemistry of apoptosis. Nature. 2000;407:770–776. doi: 10.1038/35037710. [DOI] [PubMed] [Google Scholar]
- 33.Valencia-Cruz G, Shabala L, Delgado-Enciso I, Shabala S, Bonales-Alatorre E, Pottosin II, et al. Kbg and Kv1.3 channels mediate potassium efflux in the early phase of apoptosis in Jurkat T lymphocytes. Am J Physiol Cell Physiol. 2009;297:C1544–C1553. doi: 10.1152/ajpcell.00064.2009. [DOI] [PubMed] [Google Scholar]
- 34.Yuan Y, Jiang C, Hu F, Wang Q, Zhang K, Wang Y, et al. The role of mitogen-activated protein kinase in cadmium-induced primary rat cerebral cortical neurons apoptosis via a mitochondrial apoptotic pathway. J Trace Elem Med Biol. 2015;29:275–283. doi: 10.1016/j.jtemb.2014.06.006. [DOI] [PubMed] [Google Scholar]
- 35.Young MM, Takahashi Y, Khan O, Park S, Hori T, Yun J, et al. Autophagosomal membrane serves as platform for intracellular death-inducing signaling complex (iDISC)-mediated caspase-8 activation and apoptosis. J Biol Chem. 2012;287:12455–12468. doi: 10.1074/jbc.M111.309104. [DOI] [PMC free article] [PubMed] [Google Scholar]
- 36.Manns J, Daubrawa M, Driessen S, Paasch F, Hoffmann L, Antje Löffler A, et al. Triggering of a novel intrinsic apoptosis pathway by the kinase inhibitor staurosporine: activation of caspase-9 in the absence of Apaf-1. FASEB J. 2011;25:3250–3261. doi: 10.1096/fj.10-177527. [DOI] [PubMed] [Google Scholar]
- 37.Lee SJ, Zhou T, Choi C, Wang Z, Benveniste EN. Differential regulation and function of Fas expression on glia cells. J Immunol. 2000;164:1277–1285. doi: 10.4049/jimmunol.164.3.1277. [DOI] [PubMed] [Google Scholar]
- 38.Radina D, Lippa A, Patel P, Leonardi D. Lifeguard inhibition of Fas-mediated apoptosis: a possible mechanism for explaining the cisplatin resistance of triple-negative breast cancer cells. Biomed Pharmacother. 2016;77:161–166. doi: 10.1016/j.biopha.2015.12.022. [DOI] [PubMed] [Google Scholar]
- 39.Polyak K, Xia Y, Zweier JL, Kinzler KW, Vogelstein B. A model for p53-induced apoptosis. Nature. 1997;389:300–305. doi: 10.1038/38525. [DOI] [PubMed] [Google Scholar]
- 40.Colman MS, Afshari CA, Barrett JC. Regulation of p53 stability and activity in response to genotoxic stress. Mutat Res. 2000;462:179. doi: 10.1016/S1383-5742(00)00035-1. [DOI] [PubMed] [Google Scholar]
- 41.Pratama E, Tian X, Lestari W, Iseki S, Ichwan SJ, Ikeda MA. Critical role of ARID3B in the expression of pro-apoptotic p53-target genes and apoptosis. Biochem Biophys Res Commun. 2015;468:248–254. doi: 10.1016/j.bbrc.2015.10.121. [DOI] [PubMed] [Google Scholar]
- 42.Galluzzi L, Zamzam N, Motte RT, Lemaire C, Brenner C, Kroemer G. Methods for the assessment of mitochondrial membrane permeabilization in apoptosis. Apoptosis. 2007;12:803–813. doi: 10.1007/s10495-007-0720-1. [DOI] [PubMed] [Google Scholar]
- 43.Dostál L, Kohler WM, Penner-Hahn JE, Miller RA, Fierke CA. Fibroblasts from long-lived rodent species exclude cadmium. J Gerontol A Biol Sci Med Sci. 2015;70:10–19. doi: 10.1093/gerona/glu001. [DOI] [PMC free article] [PubMed] [Google Scholar]
- 44.Xiao C, Liu Y, Xie C, Tu W, Xia Y, Costa M, et al. Cadmium induces histone H3 lysine methylation by inhibiting histone demethylase activity. Toxicol Sci. 2015;145:80–89. doi: 10.1093/toxsci/kfv019. [DOI] [PMC free article] [PubMed] [Google Scholar]
- 45.Alavian KN, Li HM, Collis L, Bonanni L, Zeng L, Sacchetti S, et al. Bcl-xL regulates metabolic efficiency of neurons through interaction with the mitochondrial F1FO ATP synthase. Nat Cell Biol. 2011;13:1224–1234. doi: 10.1038/ncb2330. [DOI] [PMC free article] [PubMed] [Google Scholar]
Associated Data
This section collects any data citations, data availability statements, or supplementary materials included in this article.
Data Availability Statement
All data generated or analyzed during this study are included in this published article.


