

Abstract
Background
The PCSK9 antibody alirocumab (75 mg every 2 weeks; Q2W) as monotherapy reduced low‐density lipoprotein‐cholesterol (LDL‐C) levels by 47%. Because the option of a monthly dosing regimen is convenient, ODYSSEY CHOICE II evaluated alirocumab 150 mg Q4W in patients with inadequately controlled hypercholesterolemia and not on statin (majority with statin‐associated muscle symptoms), receiving treatment with fenofibrate, ezetimibe, or diet alone.
Methods and Results
Patients were randomly assigned to placebo, alirocumab 150 mg Q4W or 75 mg Q2W (calibrator arm), with dose adjustment to 150 mg Q2W at week (W) 12 if W8 predefined LDL‐C target levels were not met. The primary efficacy endpoint was LDL‐C percentage change from baseline to W24. Mean baseline LDL‐C levels were 163.9 mg/dL (alirocumab 150 mg Q4W, n=59), 154.5 mg/dL (alirocumab 75 mg Q2W, n=116), and 158.5 mg/dL (placebo, n=58). In the alirocumab 150 mg Q4W and 75 mg Q2W groups (49.1% and 36.0% of patients received dose adjustment, respectively), least‐squares mean LDL‐C changes from baseline to W24 were −51.7% and −53.5%, respectively (placebo [+4.7%]; both groups P<0.0001 versus placebo). In total, 63.9% and 70.3% of alirocumab‐treated patients achieved their LDL‐C targets at W24. Treatment‐emergent adverse events occurred in 77.6% (alirocumab 150 mg Q4W), 73.0% (alirocumab 75 mg Q2W), and 63.8% (placebo) of patients, with injection‐site reactions among the most common treatment‐emergent adverse events.
Conclusions
Alirocumab 150 mg Q4W can be considered in patients not on statin with inadequately controlled hypercholesterolemia as a convenient option for lowering LDL‐C.
Clinical Trial Registration
URL: http://www.clinicaltrials.gov. Unique identifier: NCT02023879.
Keywords: alirocumab, cardiovascular risk, low‐density lipoprotein cholesterol, placebo‐controlled, proprotein convertase subtilisin/kexin type 9
Subject Categories: Clinical Studies, Lipids and Cholesterol, Pharmacology, Treatment
Introduction
Statins lower low‐density lipoprotein cholesterol (LDL‐C) by inhibiting 3‐hydroxy‐3‐methylglutaryl‐coenzyme A reductase and consistently reduce cardiovascular disease (CVD) risk by 30% to 40%.1, 2, 3 Therefore, statin therapy is currently the recommended standard‐of‐care treatment for lowering LDL‐C in patients at increased CVD risk.2, 3 In contrast to all major randomized controlled trials, which have found comparable rates of muscle adverse events (AEs) between statin and placebo arms,4, 5, 6 observational studies reported higher rates of statin‐associated muscle symptoms (SAMS) in 7% to 29% of patients.7 As a consequence, patients with SAMS often receive a suboptimal statin dose or no statin therapy.7 A substantial proportion of these, often high‐risk, patients have persistently elevated LDL‐C levels (>190 mg/dL),8, 9, 10 placing them at a correspondingly high CVD risk.3, 11
Proprotein convertase subtilisin/kexin type 9 (PCSK9), a key regulator of cholesterol homeostasis, is a novel and attractive therapeutic target for lowering LDL‐C levels via a 3‐hydroxy‐3‐methylglutaryl‐coenzyme A reductase‐independent pathway. Alirocumab, a fully human monoclonal antibody that specifically binds to PCSK9, has been shown to significantly lower LDL‐C levels across a range of dosing regimens, whether as monotherapy12 or on a background of statin±other lipid‐lowering therapies.13, 14, 15, 16 A monthly dosing regimen may be convenient and effective,17, 18 with different doses being appropriate when used as monotherapy compared with background statin therapy. This is because statins are known to increase PCSK9 levels,19 which reduce duration of alirocumab effect in the setting of every 4 weeks (Q4W) dosing.
Alirocumab 150 mg Q4W monotherapy demonstrated a 47.4% reduction in LDL‐C levels from baseline in a phase 1 study.17 However, in an early phase 2 study of patients with heterozygous familial hypercholesterolemia on statin, there was only an incremental LDL‐C reduction of 28.9% at week 12 with alirocumab 150 Q4W.18 The use of higher doses (200‐300 mg Q4W) resulted in greater incremental LDL‐C reductions (42.5‐47.7% at week 12) when added to stable statin therapy.18, 20
In this phase 3, placebo‐controlled study (ODYSSEY CHOICE II, NCT02023879), we evaluated the efficacy and safety of alirocumab 150 mg Q4W (with possible adjustment to 150 mg Q2W; referred to as “150Q4W”) as a therapeutic option for patients with hypercholesterolemia not receiving statin. This study also employed an alirocumab dosing regimen of 75 mg every 2 weeks (Q2W; with possible dose adjustment to 150 mg Q2W; referred to as “75Q2W”) as a calibrator arm, a dose that has been extensively investigated across the phase 3 ODYSSEY clinical trials program.12, 13, 14, 15, 16 CHOICE II followed a “treat‐to‐target” dosing strategy, based on the LDL‐C reduction needed to provide best achievement of target LDL‐C level at the lowest alirocumab dose.
Methods
ODYSSEY CHOICE II was a randomized, double‐blind, placebo‐controlled, phase 3 multinational study including 233 patients from 43 study sites from Australia (n=3), Belgium (n=3), Canada (n=6), Denmark (n=5), the Netherlands (n=9), New Zealand (n=2), Spain (n=7), and the United States (n=8). The study was initiated on December 16, 2013 (first patient screened) with the first patient randomized on January 2, 2014 and the last patient randomized on May 12, 2014. The study was conducted in accordance with the ethical principles in the Declaration of Helsinki and applicable amendments, and the International Conference on Harmonisation guidelines for Good Clinical Practice. The protocol was approved by the relevant institutional review boards or independent ethics committees. All participating patients provided written informed consent.
Patients
The study enrolled adult patients (≥18 years of age) with hypercholesterolemia receiving fenofibrate or ezetimibe or diet alone. Only patients not receiving a statin were eligible for the study, which corresponded to patients who (1) had SAMS (which was defined as statin intolerance in the protocol) with moderate, high, or very high cardiovascular risk or (2) were not receiving a statin but who did not fulfill the SAMS definition: only patients at moderate cardiovascular risk were included in this stratum. SAMS, as well as moderate, high, and very high cardiovascular risk, were defined as previously described.21
SAMS, defined as statin intolerance in the study protocol, was defined as the inability to tolerate at least 2 statins, consistent with other studies in the ODYSSEY clinical trial program21: 1 statin at the lowest daily starting dose (defined as rosuvastatin 5 mg, atorvastatin 10 mg, simvastatin 10 mg, lovastatin 20 mg, pravastatin 40 mg, fluvastatin 40 mg, or pitavastatin 2 mg), and another statin at any dose, due to SAMS, other than those due to strain or trauma, such as pain, aches, weakness, or cramping, that began or increased during statin therapy and stopped when statin therapy was discontinued.
The aim was for two‐thirds of randomized patients to be receiving fenofibrate/ezetimibe, and for ≥50% of patients to fulfill the SAMS definition. Patients were instructed to maintain a stable diet (National Cholesterol Education Program Adult Treatment Panel III Therapeutic Lifestyle Changes diet or equivalent) throughout the entire study duration, including the screening period.22 Use of fibrates (other than fenofibrate), niacin, bile acid‐binding sequestrants, or red yeast rice products was not allowed during the study. A list of exclusion criteria is given in Table S1.
Hypercholesterolemia was defined based on cardiovascular risk: LDL‐C ≥70 mg/dL if very high cardiovascular risk, or LDL‐C ≥100 mg/dL if high or moderate risk. In addition, for those patients not fulfilling the SAMS definition, or who were being treated with diet alone, LDL‐C also had to be ≥100 and <160 mg/dL.
Study Procedures
The study comprised a 3‐week screening period, followed by 24 weeks of double‐blind treatment and 8 weeks of follow‐up (off treatment) for those patients who did not enter the open‐label treatment period (Figure 1). After screening, the planned randomization was to follow a 2:1:1 treatment ratio for alirocumab 150Q4W, alirocumab 75Q2W (calibrator arm), and placebo Q2W, respectively. Randomization was stratified by SAMS status and by either ezetimibe/fenofibrate therapy or diet alone. However, owing to a systematic error in the algorithm managing treatment allocation at the study setup (where alirocumab 75Q2W was allocated to patients randomized to alirocumab 150Q4W during the entire double‐blind period and vice versa), patients were actually randomized in a 1:2:1 ratio to receive alirocumab 150Q4W, 75Q2W, or placebo in a blinded manner. The blinding was maintained for patients randomized to alirocumab 150Q4W by alternating active and placebo injections; each patient received 12 injections during the study period. Each treatment was administered subcutaneously by 1‐mL prefilled pen.
Figure 1.
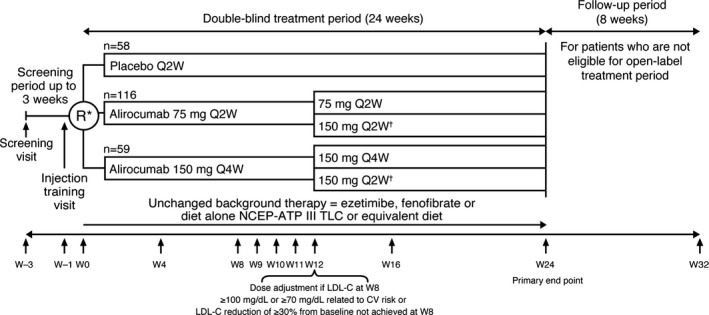
CHOICE II study design. *Patients were to be randomized to 2:1:1 alirocumab 150Q4W: alirocumab 75Q2W: placebo. However, a systematic randomization error occurred in alirocumab treatment allocation. †Blind was maintained in all patients, including those receiving dose adjustments, by giving the study treatment as a single 1‐mL subcutaneous injection Q2W in all groups. 75Q2W indicates 75 mg every 2 weeks (with possible dose adjustment to 150 mg every 2 weeks); 150Q4W, 150 mg every 4 weeks (with possible dose adjustment to 150 mg every 2 weeks); LDL‐C, low‐density lipoprotein cholesterol; NCEP ATP III TLC, National Cholesterol Education Program Adult Treatment Panel III Therapeutic Lifestyle Changes; Q2W, every 2 weeks; Q4W, every 4 weeks; R, randomization; W, week.
On‐site visits took place during the double‐blind period at weeks 0 (baseline, ie, the randomization visit), 4, 8, 9, 10, 11, 12, 16, and 24.
Patients in the alirocumab 150 mg Q4W or 75 mg Q2W treatment groups who did not achieve their target LDL‐C levels (<70 or <100 mg/dL, depending on CVD risk), or who did not achieve a reduction of ≥30% in LDL‐C level from baseline at week 8, had their alirocumab regimen changed to 150 mg Q2W at week 12 in a blinded fashion.
Patients also had the option of entering an open‐label treatment period after completion of the double‐blind treatment period. In this treatment period all patients received alirocumab 150Q4W at week 36 based on the investigator's judgment.
Endpoints
The primary efficacy endpoint was the percentage change in LDL‐C (calculated using the Friedewald equation) from baseline to week 24 in the intent‐to‐treat (ITT) population, using all LDL‐C values within 1 of the analysis windows up to week 24 regardless of adherence to treatment (ie, ITT approach). Efficacy endpoints were also assessed using an on‐treatment approach, using all LDL‐C values during the efficacy treatment period.
A hierarchical procedure was used to control type I error and handle multiple key secondary endpoints. Those endpoints included the percentage change in calculated LDL‐C from baseline to week 24 using the on‐treatment approach, the percentage change in calculated LDL‐C from baseline to week 12 (also averaged for weeks 9‐12), the proportion of patients achieving predefined LDL‐C targets of <70 or <100 mg/dL, depending on cardiovascular risk, at weeks 12 and 24, and the percentage change in other lipid parameters such as apolipoprotein B, non‐high‐density lipoprotein cholesterol, total cholesterol, lipoprotein(a) (Lp[a]), fasting triglycerides, high‐density lipoprotein cholesterol, and apolipoprotein A1 from baseline to weeks 12 and 24. All comparisons with the alirocumab 75 mg Q2W treatment arm were classed as other secondary endpoints.
Analyses of lipid samples were conducted by a central laboratory. Lp(a) was analyzed using an immunoturbidimetric assay on a Siemens BNII analyzer (Siemens, Erlangen, Germany), with a reference range of 1 to 30 mg/dL. If triglyceride values exceeded 400 mg/dL (4.52 mmol/L), LDL‐C was measured via β‐quantification rather than by calculation. (LDL‐C ultracentrifugation was performed using a Beckman Ultracentrifuge with an ultracentrifuge rotor, Type 50.4; LDL‐C concentration was assessed using a Beckman Coulter chemistry analyzer.) LDL‐C was also measured via the β‐quantification method at weeks 0 and 24 in all patients.
Safety was assessed primarily from the reporting of treatment‐emergent AEs (TEAEs), defined as those occurring during the period from first to last study drug injection plus 70 days or up to the first open‐label injection, whichever came first.
Certain events were classed as safety events of interest, requiring completion of a special electronic case report form (e‐CRF), including general allergic reactions, cardiovascular events, injection‐site reactions, hemolytic anemia, neurologic events, ophthalmologic events, and increased alanine aminotransferase (ALT) levels. See Appendix S1 for further details on safety events of interest and preferred terms for the adverse events categories.
To assess development of antidrug antibodies to alirocumab, blood samples were collected before study drug administration at baseline and scheduled clinic visits at weeks 4, 8, 12, 16, 24, and at the follow‐up visit. These samples were analyzed using a validated nonquantitative, titer‐based bridging immunoassay by Regeneron Pharmaceuticals, Inc (Tarrytown, NY), using a tiered approach involving 3 potential steps: initial screen, confirmation, and a titer measurement. Assay sensitivity was ~5.6 ng/mL based on the positive control monoclonal antibody, and the drug tolerance limit was 191 μg/mL of alirocumab for 500 ng/mL of monoclonal antibody positive control. Positive samples were tested for the presence of antidrug antibody using a validated, nonquantitative, competitive ligand‐binding assay with sensitivity based on a monoclonal positive control neutralizing antibody of 470 ng/mL. Drug tolerance limit was 547 ng/mL of alirocumab in neat serum for 500 ng/mL of monoclonal antibody positive control. Free PCSK9 levels were determined using a specific validated enzyme‐linked immunosorbent assay (Regeneron Pharmaceuticals, Tarrytown, NY). The lower limits of detection were 31.2 ng/mL.
Statistical Analysis
A sample size of 39 patients (26 in alirocumab 150Q4W and 13 in placebo arms, respectively) was estimated to have 90% power to detect a between‐treatment‐group difference in mean percentage change in LDL‐C of 30%, with a 5% 2‐sided significance level and assuming a common standard deviation of 25%, and a 5% nonevaluable primary endpoint. To obtain additional safety data on the administration of a 150Q4W regimen in non‐statin‐treated patients, the total planned sample size was increased and rounded to 200 (100 for alirocumab 150Q4W, 50 for alirocumab 75Q2W, and 50 for placebo). Thus, the systematic allocation error was not anticipated to have an impact on the power of the study.
The primary efficacy analysis was conducted in the ITT population, which included all randomized patients with an evaluable primary endpoint. Analysis utilized a mixed‐effect model with repeated measures to account for missing data as used in previous alirocumab studies.23
Secondary lipid endpoints were analyzed as for the primary endpoint, except Lp(a) and triglycerides (analyzed by multiple imputation followed by a robust regression model) and LDL‐C goal achievement (analyzed by multiple imputation followed by logistic regression). The modified ITT population used for on‐treatment analyses included all randomized patients with an evaluable primary endpoint during the treatment period who had received at least 1 dose or part of a dose of study treatment.
The safety population included all randomized patients who had received at least 1 dose or part of a dose of study drug. Safety data were analyzed by descriptive statistics.
Device‐Handling Questionnaire
At weeks 0 and 12, an optional device‐handling questionnaire assessed experience of participants performing self‐injection using the alirocumab prefilled pen.
Participants rated 7 manipulations/steps to inject alirocumab/placebo (7‐point scale from “not easy at all” [1] to “extremely easy” [7]), how many clicks they heard during injection, satisfaction with duration of injection (7‐point scale from “extremely unsatisfied” [1] to “extremely satisfied” [7]), and the overall experience performing self‐injection (7‐point scale from “extremely unsatisfied” [1] to “extremely satisfied” [7]).
Results
Patients
A total of 233 patients were randomly assigned to alirocumab 150Q4W (n=59), 75Q2W (n=116), and placebo (n=58) (Figure 1, Figure S1). The ITT, modified ITT, and safety populations comprised 230, 228, and 231 patients, respectively. A total of 158 (90.3%) randomized patients receiving alirocumab completed the 24‐week treatment period. Reasons for study discontinuation are given in Table S2.
Baseline characteristics and lipid parameters were generally balanced between groups (Table 1). A total of 90.1% of patients fulfilled the criteria for SAMS as the reason for statin discontinuation. The majority of patients with additional lipid‐lowering therapy received ezetimibe (60.1%) and/or fenofibrate (8.6%). Across the different treatment groups, 32.2% of patients received treatment with diet alone and 3.4% received nutraceuticals (Table 1).
Table 1.
Baseline Characteristics (Randomized Population)
| Placebo (n=58) | Alirocumab | ||
|---|---|---|---|
| 75Q2W (n=116) | 150Q4W (n=59) | ||
| Baseline demographics | |||
| Age, y, mean (SD) | 63.1 (10.7) | 62.5 (9.9) | 64.2 (10.0) |
| Male, n (%) | 31 (53.4) | 69 (59.5) | 30 (50.8) |
| Race, white, n (%) | 56 (96.6) | 108 (93.1) | 55 (93.2) |
| Race, black or African American, n (%) | 1 (1.7) | 3 (2.6) | 1 (1.7) |
| Ethnicity, Hispanic/Latino, n (%) | 1 (1.7) | 7 (6.0) | 4 (6.8) |
| BMI, kg/m2, mean (SD) | 28.5 (4.6) | 29.4 (5.6) | 28.2 (5.2) |
| HeFH, n (%) | 5 (8.6) | 15 (12.9) | 9 (15.3) |
| Diagnosis of HeFH, n | 5 | 15 | 9 |
| By genotyping, n (%) | 4 (80.0) | 8 (53.3) | 6 (66.7) |
| By WHO/Simon Broome criteria, n (%) | 1 (20.0) | 7 (46.7) | 3 (33.3) |
| SAMS status, n (%) | |||
| SAMS | 51 (87.9) | 106 (91.4) | 53 (89.8) |
| Non‐SAMS | 7 (12.1) | 10 (8.6) | 6 (10.2) |
| CHD history, n (%) | 27 (46.6) | 57 (49.1) | 32 (54.2) |
| CHD risk equivalenta, n (%) | 10 (17.2) | 23 (19.8) | 11 (18.6) |
| Hypertension, n (%) | 37 (63.8) | 69 (59.5) | 36 (61.0) |
| Type 2 diabetes, n (%) | 9 (15.5) | 22 (19.0) | 7 (11.9) |
| Categorization of cardiovascular risk, n (%) | |||
| Very‐high cardiovascular risk | 31 (53.4) | 66 (56.9) | 36 (61.0) |
| High cardiovascular risk | 13 (22.4) | 23 (19.8) | 10 (16.9) |
| Moderate cardiovascular risk | 14 (24.1) | 27 (23.3) | 13 (22.0) |
| Lipid medication, n (%) | |||
| Any LLT other than statins | 41 (70.7) | 82 (70.7) | 42 (71.2) |
| Ezetimibe | 35 (60.3) | 70 (60.3) | 35 (59.3) |
| Fenofibrate | 3 (5.2) | 12 (10.3) | 5 (8.5) |
| Nutraceuticals | 1 (1.7) | 3 (2.6) | 4 (6.8) |
| Diet aloneb | 20 (34.5) | 35 (30.2) | 20 (33.9) |
| Baseline lipid parameters, mg/dL, mean (SD) | |||
| LDL‐C (calculated) | 158.5 (47.3) | 154.5 (44.6) | 163.9 (69.1) |
| LDL‐C (calculated), median (Q1:Q3) | 148.5 (136.0:166.0) | 146.0 (124.5:173.5) | 148.0 (127.0:179.0) |
| LDL‐C (measured) | 156.6 (46.6) | 154.1 (42.4) | 167.5 (69.0) |
| Non‐HDL‐C | 191.9 (51.0) | 188.0 (49.9) | 195.9 (76.4) |
| Total cholesterol | 244.7 (50.8) | 239.1 (50.2) | 250.8 (75.7) |
| Apo B | 120.3 (27.6) | 120.2 (27.1) | 126.5 (44.8) |
| Lp(a), median (Q1:Q3) | 10.5 (4.0:31.0) | 16.0 (5.0:46.0) | 19.0 (5.0:41.0) |
| HDL‐C | 52.8 (16.6) | 51.1 (15.1) | 54.9 (13.4) |
| Fasting triglycerides, median (Q1:Q3) | 154.5 (105.0:218.0) | 147.5 (107.0:225.0) | 145.0 (102.0:211.0) |
| Apo A1 | 151.0 (27.7) | 150.5 (27.3) | 154.8 (25.8) |
75Q2W indicates 75 mg every 2 weeks (with possible dose adjustment to 150 mg every 2 weeks); 150Q4W, 150 mg every 4 weeks (with possible dose adjustment to 150 mg every 2 weeks); Apo, apolipoprotein; BMI, body mass index; CHD, coronary heart disease; HDL‐C, high‐density lipoprotein cholesterol; HeFH, heterozygous familial hypercholesterolemia; LDL‐C, low‐density lipoprotein cholesterol; LLT, lipid‐lowering therapy; Lp(a), lipoprotein(a); SAMS, statin‐associated muscle symptoms; SD, standard deviation; WHO, World Health Organization.
CHD risk equivalents were defined as abdominal aortic aneurysm, carotid artery occlusions >50% without symptoms, peripheral arterial disease, carotid endarterectomy or carotid artery stent procedure, type 1 or 2 diabetes mellitus, with target organ damage, ischemic stroke, renal artery stenosis, and transient ischemic attack.
Patients not taking fenofibrate or ezetimibe.
Efficacy Analyses
Alirocumab (both dose regimens) maintained LDL‐C reductions from week 4 (first sampling point) until week 24 (Figure 2; Table 2).
Figure 2.

Calculated LDL‐C mean (SE) absolute values from baseline (ITT analysis) (A) and free PCSK9 levels (B) over time (PK analysis). ΔW 9 to 12 defined as percentage change in calculated LDL‐C from baseline to averaged values from weeks 9 to 12 vs placebo in the ITT analysis; ΔW 24 defined as percentage change in calculated LDL‐C from baseline to week 24 vs placebo in the ITT analysis. 75Q2W indicates 75 mg every 2 weeks (with possible dose adjustment to 150 mg every 2 weeks); 150Q4W indicates150 mg every 4 weeks (with possible dose adjustment to 150 mg every 2 weeks); ITT, intent‐to‐treat; LDL‐C, low‐density lipoprotein cholesterol; LS, least‐squares; PCSK9, proprotein convertase subtilisin/kexin type 9; SE, standard error.
Table 2.
Change From Baseline in Lipid End Points and Achievement of LDL‐C Goals (ITT Analysis)
| Placebo (n=57) | Alirocumab | ||
|---|---|---|---|
| 75Q2W (n=115) | 150Q4W (n=58) | ||
| Baseline, LS mean (SD) | 156.7 (45.7) | 155.1 (44.4) | 164.4 (69.6) |
| Calculated LDL‐C, LS mean (SE), mg/dL | |||
| Week 24 absolute LDL‐C value | 162.9 (3.7) | 75.0 (2.6) | 75.8 (3.7) |
| Absolute change from baseline to week 24 | 5.1 (3.7) | −82.9 (2.6) | −82.1 (3.7) |
| Percentage change from baseline to week 24 (primary end point) | 4.7 (2.3)% | −53.5 (1.6)% | −51.7 (2.3)% |
| Percenaget difference vs placebo; P‐valuea | −58.2 (2.8)%; <0.0001 | −56.4 (3.3)%; <0.0001b | |
| Percentage change from baseline to week 12 | 3.2 (2.5)% | −50.8 (1.7)% | −41.7 (2.4)% |
| Percentage difference vs placebo; P‐valuea | −54.0 (3.0)%; <0.0001 | −44.9 (3.5)%; <0.0001b | |
| Percentage change from baseline to averaged weeks 9 to 12 | 3.2 (2.0)% | −53.6 (1.4)% | −52.3 (2.0)% |
| Percentage difference vs placebo; P‐valuea | −56.7 (2.5)%; <0.0001 | −55.5 (2.9)%; <0.0001b | |
| Percentage of patients achieving LDL‐C goals <70 mg/dL or <100 g/dL at week 24; P‐value vs placebo | 1.8% | 70.3%; <0.0001 | 63.9%; <0.0001b |
| Percentage of patients achieving LDL‐C <70 mg/dL at week 24 (LOCF); P‐value vs placebo | 0 | 60.0%; <0.0001 | 50.0%; <0.0001 |
| Percentage change from baseline to week 24 in other lipid parameters, LS mean (SE) | |||
| Apo B | 7.5 (2.1)% | −39.7 (1.5)% | −38.9 (2.2)% |
| Percentage difference vs placebo; P‐valuea | −47.2 (2.6)%; <0.0001 | −46.4 (3.0)%; <0.0001b | |
| Non‐HDL‐C | 4.8 (2.1)% | −45.3 (1.5)% | −44.2 (2.1)% |
| Percentage difference vs placebo; P‐valuea | −50.1 (2.6)%; <0.0001 | −49.0 (3.0)%; <0.0001b | |
| Total cholesterol | 3.0 (1.6)% | −34.0 (1.1)% | −32.3 (1.6)% |
| Percentage difference vs placebo; P‐valuea | −37.0 (2.0)%; <0.0001 | −35.3 (2.3)%; <0.0001b | |
| Lp(a)c | 4.1 (3.7)% | −21.8 (2.6)% | −15.5 (3.7)% |
| Percentage difference vs placebo; P‐valuea | −25.9 (4.5)%; <0.0001 | −19.6 (5.2)%; 0.0002b | |
| Fasting triglyceridesc | 1.1 (3.8)% | −10.6 (2.7)% | −9.2 (3.9)% |
| Percentage difference vs placebo; P‐valuea | −11.8 (4.6)%; 0.0109 | −10.4 (5.4)%; 0.0556 | |
| HDL‐C | −2.4 (1.9)% | 7.4 (1.4)% | 7.7 (2.0)% |
| Percentage difference vs placebo; P‐valuea | 9.8 (2.4)%; <0.0001 | 10.1 (2.8)%; 0.0003 | |
| Apo A1 | 3.4 (1.5)% | 8.2 (1.1)% | 10.0 (1.5)% |
| Percentage difference vs placebo; P‐valuea | 4.8 (1.8)%; 0.0104 | 6.6 (2.1)%; 0.0025 | |
75Q2W indicates 75 mg every 2 weeks (with possible dose adjustment to 150 mg every 2 weeks); 150Q4W, 150 mg every 4 weeks (with possible dose adjustment to 150 mg every 2 weeks); Apo, apolipoprotein; HDL‐C, high‐density lipoprotein cholesterol; LDL‐C, low‐density lipoprotein cholesterol; LOCF, last observation carried forward; Lp(a), lipoprotein(a); LS, least squares; SD, standard deviation; SE, standard error.
P‐values are for the comparison with placebo.
P‐value is statistically significant according to the fixed hierarchical approach used to ensure a strong control of the overall type‐I error rate at the 0.05 level (only applicable to comparison of alirocumab 150Q4W arm vs placebo).
Combined estimate for adjusted mean (SE).
Week 12
Before any dose adjustment (ie, up to week 12), the mean percentage change in LDL‐C from baseline to averaged weeks 9 to 12 was −52.3% in the alirocumab 150Q4W group and 3.2% in the placebo group. However, in the alirocumab 150Q4W group the mean percentage reduction in LDL‐C from baseline to weeks 9 to 11 was greater (54.5% to 57.2%) compared with that observed at week 12 (41.7%; Table 2). Absolute LDL‐C levels over time are shown in Figure 2. In the alirocumab 75Q2W calibrator arm, percentage reduction in LDL‐C from baseline to averaged weeks 9 to 12 was 53.6% (Table 2), whereas percentage reduction in LDL‐C from baseline to weeks 9 to 11 (51.6% to 56.3%) was comparable to that at week 12 (50.8%).
At week 12, 26 patients (49.1%) received a dose adjustment from alirocumab 150 mg Q4W to 150 mg Q2W because these patients did not achieve their predefined LDL‐C target levels at week 8 (with 36.0% of patients in the 75 mg Q2W group also increasing to 150 mg Q2W). In general, subjects in both groups with dose adjustment were characterized by higher LDL‐C levels at baseline (197.5 mg/dL in the 150Q4W group and 188.6 mg/dL in the 75Q2W group) compared with those who did not require dose adjustment (130.3 and 137.3 mg/dL, respectively) (Figure 3, Table S3). Mean LDL‐C levels in patients who received dose adjustment from 150 mg Q4W to 150 mg Q2W were reduced further from 120.5 mg/dL at week 12 to 79.0 mg/dL at week 24, a decrease from week 12 of 34.4%, corresponding to an incremental benefit of ~19% compared with baseline (Figure 3). Of patients allocated to alirocumab 150Q4W, 50.9% did not need dose adjustment and were maintained on this dose until the end of the study. In the calibrator arm, 64.0% of patients remained on the 75 mg Q2W dose. For patients who received dose adjustment from 75 mg Q2W to 150 mg Q2W, an LDL‐C reduction from week 12 to week 24 of 15.8% was observed, corresponding to an incremental benefit of ~11% compared with baseline (week 12, 106.6 mg/dL; week 24, 89.8 mg/dL) (Figure S2).
Figure 3.

Impact of dosing regimen adjustment on LDL‐C levels (ITT analysis*) (A) and free PCSK9 levels (B) in patients in the 150 mg Q4W alirocumab cohort: time profile from baseline to Week 24 (PK analysis*). *Patients who received dose adjustment at Week 12 and had at least 1 subsequent injection. LDL‐C indicates low‐density lipoprotein cholesterol; PCSK9, proprotein convertase subtilisin/kexin type 9; Q2W, every 2 weeks; Q4W, every 4 weeks; SE, standard error.
Week 24
At week 24 (primary endpoint), the mean (standard error) percentage change in LDL‐C from baseline to week 24 was greater in the alirocumab 150Q4W group (−51.7%) versus placebo (+4.7%) in the ITT analysis, with a statistically significant mean difference of −56.4% (P<0.0001; Table 2). The on‐treatment analysis demonstrated consistent results (alirocumab 150Q4W −54.6%; placebo +5.1%; P<0.0001) (Table S4). Data were comparable when either measured or calculated LDL‐C was used (Table S5).
At week 24, 63.9% of patients allocated to alirocumab 150Q4W achieved their LDL‐C target levels versus 1.8% of patients allocated to placebo (70.3% in the alirocumab 75Q2W group) (Table 2).
Across various patient subgroups the reductions in LDL‐C were similar to the primary endpoint data at week 24 (Figure S3), although patients with baseline free PCSK9 levels above the median tended to see a greater reduction in LDL‐C compared with those with baseline levels below the median (Figure S3). Considering concomitant therapies (ezetimibe and/or fenofibrate or diet alone), LDL‐C reductions were consistent in the alirocumab 150Q4W group at week 24 (Figure S3).
At week 24, significant (P<0.05) improvements in secondary efficacy endpoints including apolipoprotein B, non‐high‐density lipoprotein cholesterol, and Lp(a) were observed following treatment with alirocumab 150Q4W (Table 2).
Free PCSK9
In general, predictable dynamics were observed following alirocumab administration, with free PCSK9 levels decreasing concomitantly with LDL‐C level reduction in the alirocumab 150Q4W group (or 75Q2W group) (Figure 2). Despite similar baseline free PCSK9 levels, alirocumab‐treated patients receiving dose adjustment to 150 mg Q2W at week 12 had a less pronounced decrease in mean free PCSK9 levels during the first 12 weeks than those remaining on the initial alirocumab dose (Figure 3; Figure S2). Following dose adjustment, an additional reduction in mean free PCSK9 levels was observed with mean values close to 0, ranging from 1.6 to 3.6 ng/mL (Figure 3; Figure S2).
Device‐Handling Questionnaire
At Weeks 0 and 12, 135 and 117 of all study participants completed the device‐handling questionnaire, respectively. Overall, the provided ratings at each time point were similar. The overall experience in performing home self‐injection was rated as 6 or 7 (7=extremely satisfied) by 93% of the patients. In addition, 92% of patients (n=125) were very satisfied with the duration of injection (rating 6 or 7).
Safety
As described below and compared with placebo, alirocumab was generally well tolerated at any dose regimen. The number of patients with at least 1 TEAE was 45 (77.6%) in the alirocumab 150Q4W group, 37 (63.8%) in the placebo group, and 84 (73.0%) in the alirocumab 75Q2W group (Table 3). Permanent discontinuations due to TEAEs occurred in 6.9% and 3.4% of patients treated with alirocumab 150Q4W and placebo, respectively (1.7% in the alirocumab 75Q2W group). No deaths were reported during this study (Table 3). Serious TEAEs were reported by 7 (12.1%) patients in the alirocumab 150Q4W group and 4 (6.9%) in the placebo group (6 [5.2%] in the alirocumab 75Q2W group).
Table 3.
Adverse Events and Safety Laboratory Values (Safety Population)
| Placebo (n=58) | Alirocumab | ||
|---|---|---|---|
| 75Q2W (n=115) | 150Q4W (n=58) | ||
| TEAEs, n (%) | 37 (63.8) | 84 (73.0) | 45 (77.6) |
| Treatment‐emergent SAEs, n (%) | 4 (6.9) | 6 (5.2) | 7 (12.1) |
| TEAEs leading to death, n (%) | 0 | 0 | 0 |
| TEAEs leading to discontinuation, n (%) | 2 (3.4) | 2 (1.7) | 4 (6.9) |
| Safety terms of interest, n (%) | |||
| Adjudicated cardiovascular eventsa | 0 | 1 (0.9) | 1 (1.7) |
| General allergic reactions | 4 (6.9) | 5 (4.3) | 6 (10.3) |
| General allergic serious TEAE (CMQ) | 0 | 0 | 0 |
| Neurological TEAE | 2 (3.4) | 5 (4.3) | 4 (6.9) |
| Neurocognitive disorders | 0 | 1 (0.9%) | 1 (1.7%) |
| Laboratory parametersb, n (%) | |||
| Alanine aminotransferase >3 times ULN | 0/58 | 1/115 (0.9) | 0/58 |
| Aspartate aminotransferase >3 times ULN | 0/58 | 0/115 | 0/58 |
| Creatine kinase >3 times ULN | 1/57 (1.8) | 8/115 (7.0) | 4/57 (7.0) |
75Q2W indicates 75 mg every 2 weeks (with possible dose adjustment to 150 mg every 2 weeks); 150Q4W, 150 mg every 4 weeks (with possible dose adjustment to 150 mg every 2 weeks); CHD, coronary heart disease; CMQ, Custom Medical Dictionary of Regulatory Activities Query; SAE, serious adverse event; TEAE, treatment‐emergent adverse events; ULN, upper limit of normal.
Includes CHD death, nonfatal myocardial infarction, fatal and nonfatal ischemic stroke, unstable angina requiring hospitalization, congestive heart failure requiring hospitalization, and ischemia‐driven coronary revascularization procedure.
Regardless of baseline status.
A list of TEAEs by preferred term occurring in ≥2% of patients in either group is given in Table S6.
In regard to TEAEs of special interest, injection‐site reactions were experienced by 8 (13.8%) alirocumab 150Q4W‐treated patients (vs 4 [3.5%] in alirocumab 75Q2W‐treated patients and 0 [0%] in the placebo group). The intensity of all injection‐site reactions was mild, except for 1 of moderate intensity in the alirocumab 75 mg Q2W group (Table S6). Injection‐site reactions occurred earlier and were of longer duration in the alirocumab 150Q4W group; however, none of the injection‐site reactions led to treatment discontinuation. No particular safety findings were detected for neurological events. Neurocognitive events were reported by 1 patient in the alirocumab 150Q4W group (1.7%; aphasia) and 1 patient in the alirocumab 75Q2W group (0.9%; amnesia). These neurocognitive events were not serious and did not lead to treatment discontinuation. A positively adjudicated case of nonfatal myocardial infarction and of ischemia‐driven coronary revascularization were observed in 1 (1.7%) patient receiving alirocumab 150Q4W and in 1 (0.9%) patient receiving alirocumab 75Q2W.
Three (2.7%) patients in the alirocumab 75Q2W group had calculated LDL‐C levels of <25 mg/dL on ≥2 consecutive occasions (0 in the alirocumab 150Q4W group). No specific safety concern was identified in these patients.
Antidrug Antibodies
The presence of antidrug antibodies had no observed effect on LDL‐C‐lowering efficacy (Figure S4). A total of 1/109 (0.9%) patient in the alirocumab 75Q2W group developed a low‐titer, treatment‐emergent persistent positive response for the antialirocumab antibody assay (0 in the alirocumab 150Q4W group). Five patients in this study had positive alirocumab‐neutralizing activity: 1 patient (1/56; 1.8%) from the alirocumab 150Q4W group and 4 patients (4/109; 3.7%) from the alirocumab 75Q2W group.
Discussion
In ODYSSEY CHOICE II, patients with hypercholesterolemia not on statin therapy were treated with alirocumab 150Q4W, resulting in LDL‐C reductions of 51.7% at week 24 (placebo +4.7%). ODYSSEY CHOICE II was the first phase 3 study to use this alirocumab dose, with results suggesting that 150Q4W may be convenient for patients with hypercholesterolemia not on statin therapy. The dose adjustment strategy would allow the physician to modify the dose to Q2W if LDL‐C targets were not met.
The current study included weekly sample collection from weeks 8 to 12, thereby allowing detailed assessment of LDL‐C levels as well as PCSK9 levels. In line with previous studies,17, 18 alirocumab 150Q4W (and 75Q2W) led to a rapid and robust reduction in mean free PCSK9 levels, which persisted for at least 3 weeks (as shown between weeks 9 and 11) following alirocumab 150Q4W administration. With administration of alirocumab 75Q2W, mean free PCSK9 levels remained below 25% of baseline levels throughout the 4‐week period. However, in the 150Q4W group, there was a modest increase of free PCSK9 levels between weeks 11 and 12 that coincided with a small tailing off of LDL‐C efficacy.
At week 12, before possible dose modification, when patients remained on either alirocumab 150 mg Q4W or 75 mg Q2W, 45.9% and 60.7% of patients, respectively, achieved their predefined LDL‐C target levels despite none of them being on a statin.
The dose adjustment at week 12 (based on LDL‐C values at week 8) resulted in an additional reduction in LDL‐C of 34.4% (alirocumab 150Q4W) and 15.8% (alirocumab 75Q2W) from weeks 12 to 24, corresponding to an incremental benefit of ~19% and ~11% compared with baseline, respectively. At week 24, after possible dose modification, 63.9% of patients in the alirocumab 150Q4W group had achieved their predefined LDL‐C targets (alirocumab 75Q2W group 70.3%). Higher LDL‐C levels at baseline were associated with dose adjustment at week 12, with duration of effect across the dosing interval also being a contributory factor toward some patients receiving a dose adjustment.
At week 24, LDL‐C reductions were 51.7% in the alirocumab 150Q4W arm and 53.5% in the 75Q2W arm. Importantly, alirocumab 75Q2W used as a calibrator arm demonstrated results that are consistent with LDL‐C‐lowering efficacy and with safety data of alirocumab used as add‐on or monotherapy in previously published studies from the ODYSSEY clinical trials program.12, 13, 14 Significant reductions in LDL‐C levels have also been seen with Q4W dosing of another PCSK9 inhibitor, evolocumab, in statin‐intolerant patients.8 In that study, mean percentage reductions from baseline in LDL‐C at week 12 were 56.1% with evolocumab 140 mg Q2W and 52.6% with evolocumab 420 mg Q4W. The effectiveness of alirocumab 300 mg Q4W has also been investigated in patients receiving concomitant statin therapy in the ODYSSEY CHOICE I study. The changes in LDL‐C from baseline to week 24 were −58.8% (placebo −0.1%) with alirocumab 300 mg Q4W (with possible dose adjustment to 150 mg Q2W at week 12) in patients on statin, and at week 12, only 19.3% of those patients required dose adjustment.24
Despite the fact that 90.1% of patients included in this study had a history of experiencing intolerable SAMS on multiple statins, we observed a low rate of muscle‐related symptoms with alirocumab treatment. These data support the concept that LDL‐C lowering per se is not a pivotal factor in SAMS and/or causation of myopathy.7 It should be noted that patients with perceived SAMS not utilizing statin therapy are unlikely to experience the degree of LDL‐C lowering needed to reduce cardiovascular risk with other traditional lipid‐lowering therapies.7 Causality of SAMS is debated, with randomized, blinded, and placebo‐controlled trials often reporting similar rates of muscle AEs between statin and placebo arms and with lower rates of muscle symptoms compared with observational studies.25 These findings imply that perceived SAMS, besides potential pharmacological and pharmacogenetic factors, are also likely to include a behavioral component from the expectation that statins can cause muscle symptoms.7, 25 In support, many patients who discontinue statins due to SAMS can be successfully rechallenged.7, 10, 26
Injection‐site reactions were reported at a higher rate in patients receiving 150Q4W alirocumab versus comparator arms. Here, it should be emphasized that the number of patients was relatively small in this treatment arm. Furthermore, all injection‐site reactions in the 150Q4W arm were of mild intensity and of limited duration. Because of the sample size per group in this study, small percentage differences between treatment groups may not be clinically meaningful, as similar trends were not observed in previously published larger alirocumab studies.13, 14, 27
Conclusions
Overall, these data suggest that alirocumab 150Q4W may provide an additional option to further optimize the treatment of patients with SAMS not receiving statin treatment. However, this dosing strategy may not provide adequate LDL‐C reduction in all patients, for example, those receiving concomitant statin or those with higher baseline LDL‐C levels. In these patients, either a higher dose of alirocumab 300Q4W or alirocumab 75 mg Q2W (with possible dose adjustment to 150 mg Q2W) is likely to be preferred.
Sources of Funding
The ODYSSEY CHOICE II study was supported by Sanofi and Regeneron Pharmaceuticals, Inc.
Disclosures
Stroes reports speaker fees/research grants from Amgen, Merck, Novartis, Sanofi, and Regeneron Pharmaceuticals Inc. Guyton reports consulting/honoraria fees from Amgen Inc, ARMCO, Novella, and Regeneron Pharmaceuticals Inc; and research grants from Amarin, Amgen Inc, Regeneron Pharmaceuticals Inc, and Sanofi‐Aventis. Lepor reports consultant fees/honaria from Gilead, Sanofi, ZX Pharmaceuticals, and Relypsa; a role in US Medical Innovations; research grants from Amarin, Amgen, Gilead, Janssen, Norvatis, Pfizer, Regeneron Pharmaceuticals Inc, and Sanofi; and is a member of speaker's bureau for Amgen, Arbor, Astellas Pharma US, Boehringer‐Ingelheim, Bristol Myers Squibb, Eli Lilly/Daiichi Sankyo, Gilead, Novartis, Pfizer, Regeneron/Sanofi, and Relypsa. Civeira reports grants, consulting fees, and/or honoraria from Amgen, Merck, Pfizer, and Sanofi‐Aventis. Gaudet reports grants, consulting fees, and/or honoraria from Amgen, Merck, and Sanofi. Watts has nothing to disclose. Baccara‐Dinet and Lecorps are employees of and stockholders in Sanofi. Manvelian is an employee of and stockholder in Regeneron Pharmaceuticals Inc. Farnier reports research support from Amgen, Merck, and Sanofi; speaker's bureau fees from Amgen, Sanofi/Regeneron Pharmaceuticals Inc, and Merck; honoraria from Abbott/Mylan, Eli Lilly, and Pfizer; and consultant/advisory board fees from Abbot/Mylan, Amgen, AstraZeneca, Eli Lilly, Kowa, Merck, Pfizer, Roche, Sanofi/Regeneron Pharmaceuticals Inc, and Servier.
Supporting information
Table S1. Exclusion Criteria
Table S2. Reasons for Not Completing the Study Treatment Period (Randomized Population)
Table S3. Baseline Characteristics According to Dose Adjustment Status (Safety Population*)
Table S4. Percentage Change From Baseline in Calculated LDL‐C at Week 24: Mixed‐Effect Model With Repeated Measures (On‐Treatment Analysis—Modified ITT Population)
Table S5. Percentage Change From Baseline in Measured LDL‐C at Week 24: Analysis of Covariance—Complete Case Analysis (ITT Analysis—ITT Population)
Table S6. Adverse Events by Preferred Term Occurring in ≥2% of Patients in Either Group (Safety Population)
Figure S1. Patient disposition for CHOICE II study.
Figure S2. Impact of dosing regimen adjustment on LDL‐C levels (A) and free PCSK9 levels (B) in patients in the 75 mg Q2W alirocumab cohort: time profile from baseline to week 24 (ITT analysis).
Figure S3. The difference in percentage change from baseline to week 24 in LDL‐C (alirocumab 150Q4W vs placebo) according to baseline subgroup: demographics (A), medical history and PCSK9 levels (B), lipids (C), and medication (D) (ITT analysis).
Figure S4. Percentage reduction in LDL‐C at last value up to week 24 by anti‐alirocumab antibody status in the alirocumab 150Q4W group (A) and 75Q2W group (B) (on‐treatment analysis—modified ITT population).
Acknowledgments
The authors would like to thank the study patients and investigators and the following persons from the sponsors for their contributions to data collection and analysis, assistance with statistical analysis, or critical review of the manuscript: Regeneron Pharmaceuticals Inc: Carol Hudson, Michael Louie, Jaman Maroni, Robert Pordy, Bill Sasiela, and Neil Stahl; Sanofi: Laurence Bessac, Aurélie Brunet, Jay Edelberg, L. Veronica Lee, Solenn Le‐Guennec, and Michael Howard. Medical writing support was provided by Susanne Ulm of Prime Medica Ltd, Knutsford, Cheshire, UK, supported by Sanofi and Regeneron Pharmaceuticals Inc. Responsibility for all opinions, conclusions, and interpretation of data lies with the authors.
(J Am Heart Assoc. 2016;5:e003421 doi: 10.1161/JAHA.116.003421)
References
- 1. Brugts JJ, Yetgin T, Hoeks SE, Gotto AM, Shepherd J, Westendorp RG, de Craen AJ, Knopp RH, Nakamura H, Ridker P, van Domburg R, Deckers JW. The benefits of statins in people without established cardiovascular disease but with cardiovascular risk factors: meta‐analysis of randomised controlled trials. BMJ. 2009;338:b2376. [DOI] [PMC free article] [PubMed] [Google Scholar]
- 2. Reiner Z, Catapano AL, De Backer G, Graham I, Taskinen MR, Wiklund O, Agewall S, Alegria E, Chapman MJ, Durrington P, Erdine S, Halcox J, Hobbs R, Kjekshus J, Filardi PP, Riccardi G, Storey RF, Wood D. ESC/EAS guidelines for the management of dyslipidaemias: the Task Force for the Management of Dyslipidaemias of the European Society of Cardiology (ESC) and the European Atherosclerosis Society (EAS). Eur Heart J. 2011;32:1769–1818. [DOI] [PubMed] [Google Scholar]
- 3. Stone NJ, Robinson JG, Lichtenstein AH, Bairey Merz CN, Blum CB, Eckel RH, Goldberg AC, Gordon D, Levy D, Lloyd‐Jones DM, McBride P, Schwartz JS, Shero ST, Smith SC Jr, Watson K, Wilson PW. 2013 ACC/AHA guideline on the treatment of blood cholesterol to reduce atherosclerotic cardiovascular risk in adults: a report of the American College of Cardiology/American Heart Association Task Force on Practice Guidelines. J Am Coll Cardiol. 2014;63:2889–2934. [DOI] [PubMed] [Google Scholar]
- 4. Kashani A, Phillips CO, Foody JM, Wang Y, Mangalmurti S, Ko DT, Krumholz HM. Risks associated with statin therapy: a systematic overview of randomized clinical trials. Circulation. 2006;114:2788–2797. [DOI] [PubMed] [Google Scholar]
- 5. Ridker PM, Danielson E, Fonseca FA, Genest J, Gotto AM Jr, Kastelein JJ, Koenig W, Libby P, Lorenzatti AJ, MacFadyen JG, Nordestgaard BG, Shepherd J, Willerson JT, Glynn RJ. Rosuvastatin to prevent vascular events in men and women with elevated C‐reactive protein. N Engl J Med. 2008;359:2195–2207. [DOI] [PubMed] [Google Scholar]
- 6. Group HPSC . MRC/BHF Heart Protection Study of cholesterol lowering with simvastatin in 20,536 high‐risk individuals: a randomised placebo‐controlled trial. Lancet. 2002;360:7–22. [DOI] [PubMed] [Google Scholar]
- 7. Stroes ES, Thompson PD, Corsini A, Vladutiu GD, Raal FJ, Ray KK, Roden M, Stein E, Tokgozoglu L, Nordestgaard BG, Bruckert E, De BG, Krauss RM, Laufs U, Santos RD, Hegele RA, Hovingh GK, Leiter LA, Mach F, Marz W, Newman CB, Wiklund O, Jacobson TA, Catapano AL, Chapman MJ, Ginsberg HN. Statin‐associated muscle symptoms: impact on statin therapy‐European Atherosclerosis Society Consensus Panel Statement on Assessment, Aetiology and Management. Eur Heart J. 2015;36:1012–1022. [DOI] [PMC free article] [PubMed] [Google Scholar]
- 8. Stroes E, Colquhoun D, Sullivan D, Civeira F, Rosenson RS, Watts GF, Bruckert E, Cho L, Dent R, Knusel B, Xue A, Scott R, Wasserman SM, Rocco M. Anti‐PCSK9 antibody effectively lowers cholesterol in patients with statin intolerance: the GAUSS‐2 randomized, placebo‐controlled phase 3 clinical trial of evolocumab. J Am Coll Cardiol. 2014;63:2541–2548. [DOI] [PubMed] [Google Scholar]
- 9. Visser ME, Wagener G, Baker BF, Geary RS, Donovan JM, Beuers UH, Nederveen AJ, Verheij J, Trip MD, Basart DC, Kastelein JJ, Stroes ES. Mipomersen, an apolipoprotein B synthesis inhibitor, lowers low‐density lipoprotein cholesterol in high‐risk statin‐intolerant patients: a randomized, double‐blind, placebo‐controlled trial. Eur Heart J. 2012;33:1142–1149. [DOI] [PMC free article] [PubMed] [Google Scholar]
- 10. Moriarty PM, Thompson PD, Cannon CP, Guyton JR, Bergeron J, Zieve FJ, Bruckert E, Jacobson TA, Kopecky SL, Baccara‐Dinet MT, Du Y, Pordy R, Gipe DA. Efficacy and safety of alirocumab versus ezetimibe in statin‐intolerant patients, with a statin‐re‐challenge arm: the ODYSSEY ALTERNATIVE randomized trial. J Clin Lipidol. 2015;9:758–769. [DOI] [PubMed] [Google Scholar]
- 11. Phan K, Gomez YH, Elbaz L, Daskalopoulou SS. Statin treatment non‐adherence and discontinuation: clinical implications and potential solutions. Curr Pharm Des. 2014;20:6314–6324. [DOI] [PubMed] [Google Scholar]
- 12. Roth EM, Taskinen MR, Ginsberg HN, Kastelein JJ, Colhoun HM, Robinson JG, Merlet L, Pordy R, Baccara‐Dinet MT. Monotherapy with the PCSK9 inhibitor alirocumab versus ezetimibe in patients with hypercholesterolemia: results of a 24 week, double‐blind, randomized phase 3 trial. Int J Cardiol. 2014;176:55–61. [DOI] [PubMed] [Google Scholar]
- 13. Cannon CP, Cariou B, Blom D, McKenney JM, Lorenzato C, Pordy R, Chaudhari U, Colhoun HM. Efficacy and safety of alirocumab in high cardiovascular risk patients with inadequately controlled hypercholesterolaemia on maximally tolerated doses of statins: the ODYSSEY COMBO II randomized controlled trial. Eur Heart J. 2015;36:1186–1194. [DOI] [PMC free article] [PubMed] [Google Scholar]
- 14. Kereiakes DJ, Robinson JG, Cannon CP, Lorenzato C, Pordy R, Chaudhari U, Colhoun HM. Efficacy and safety of the proprotein convertase subtilisin/kexin type 9 inhibitor alirocumab among high cardiovascular risk patients on maximally tolerated statin therapy: the ODYSSEY COMBO I study. Am Heart J. 2015;169:906–915. [DOI] [PubMed] [Google Scholar]
- 15. Bays H, Gaudet D, Weiss R, Ruiz JL, Watts GF, Gouni‐Berthold I, Robinson J, Zhao J, Hanotin C, Donahue S. Alirocumab as add‐on to atorvastatin versus other lipid treatment strategies: ODYSSEY OPTIONS I randomized trial. J Clin Endocrinol Metab. 2015;100:3140–3148. [DOI] [PMC free article] [PubMed] [Google Scholar]
- 16. Kastelein JJ, Ginsberg HN, Langslet G, Hovingh GK, Ceska R, Dufour R, Blom D, Civeira F, Krempf M, Lorenzato C, Zhao J, Pordy R, Baccara‐Dinet MT, Gipe DA, Geiger MJ, Farnier M. ODYSSEY FH I and FH II: 78 week results with alirocumab treatment in 735 patients with heterozygous familial hypercholesterolaemia. Eur Heart J. 2015;36:2996–3003. [DOI] [PMC free article] [PubMed] [Google Scholar]
- 17. Rey J, Poitiers F, Paehler T, Brunet A, DiCioccio AT, Cannon CP, Surks HK, Pinquier J‐L, Hanotin C, Sasiela WJ. Relationship between LDL‐C, free PCSK9, and alirocumab levels after different lipid‐lowering strategies. J Am Heart Assoc. 2016;5:e003323 doi: 10.1161/JAHA.116.003323. [DOI] [PMC free article] [PubMed] [Google Scholar]
- 18. Stein EA, Gipe D, Bergeron J, Gaudet D, Weiss R, Dufour R, Wu R, Pordy R. Effect of a monoclonal antibody to PCSK9, REGN727/SAR236553, to reduce low‐density lipoprotein cholesterol in patients with heterozygous familial hypercholesterolaemia on stable statin dose with or without ezetimibe therapy: a phase 2 randomised controlled trial. Lancet. 2012;380:29–36. [DOI] [PubMed] [Google Scholar]
- 19. Seidah NG, Awan Z, Chretien M, Mbikay M. PCSK9: a key modulator of cardiovascular health. Circ Res. 2014;114:1022–1036. [DOI] [PubMed] [Google Scholar]
- 20. McKenney JM, Koren MJ, Kereiakes DJ, Hanotin C, Ferrand AC, Stein EA. Safety and efficacy of a monoclonal antibody to proprotein convertase subtilisin/kexin type 9 serine protease, SAR236553/REGN727, in patients with primary hypercholesterolemia receiving ongoing stable atorvastatin therapy. J Am Coll Cardiol. 2012;59:2344–2353. [DOI] [PubMed] [Google Scholar]
- 21. Moriarty PM, Jacobson TA, Bruckert E, Thompson PD, Guyton JR, Baccara‐Dinet MT, Gipe D. Efficacy and safety of alirocumab, a monoclonal antibody to PCSK9, in statin‐intolerant patients: design and rationale of ODYSSEY ALTERNATIVE, a randomized phase 3 trial. J Clin Lipidol. 2014;8:554–561. [DOI] [PubMed] [Google Scholar]
- 22. Grundy SM, Cleeman JI, Merz CN, Brewer HB Jr, Clark LT, Hunninghake DB, Pasternak RC, Smith SC Jr, Stone NJ. Implications of recent clinical trials for the National Cholesterol Education Program Adult Treatment Panel III guidelines. Circulation. 2004;110:227–239. [DOI] [PubMed] [Google Scholar]
- 23. Kastelein JJ, Robinson JG, Farnier M, Krempf M, Langslet G, Lorenzato C, Gipe DA, Baccara‐Dinet MT. Efficacy and safety of alirocumab in patients with heterozygous familial hypercholesterolemia not adequately controlled with current lipid‐lowering therapy: design and rationale of the ODYSSEY FH studies. Cardiovasc Drugs Ther. 2014;28:281–289. [DOI] [PMC free article] [PubMed] [Google Scholar]
- 24. Roth EM, Moriarty P, Bergeron J, Langslet G, Manvelian G, Zhao J, Baccara‐Dinet M, Rader D. A phase 3 randomized trial evaluating alirocumab 300 mg every 4 weeks (Q4W) as monotherapy or add‐on to statin: ODYSSEY CHOICE I. J Clin Lipidol. 2016;10:716–717. [DOI] [PubMed] [Google Scholar]
- 25. Newman CB, Tobert JA. Statin intolerance: reconciling clinical trials and clinical experience. JAMA. 2015;313:1011–1012. [DOI] [PubMed] [Google Scholar]
- 26. Zhang H, Plutzky J, Skentzos S, Morrison F, Mar P, Shubina M, Turchin A. Discontinuation of statins in routine care settings: a cohort study. Ann Intern Med. 2013;158:526–534. [DOI] [PMC free article] [PubMed] [Google Scholar]
- 27. Robinson JG, Farnier M, Krempf M, Bergeron J, Luc G, Averna M, Stroes ES, Langslet G, Raal FJ, El SM, Koren MJ, Lepor NE, Lorenzato C, Pordy R, Chaudhari U, Kastelein JJ. Efficacy and safety of alirocumab in reducing lipids and cardiovascular events. N Engl J Med. 2015;372:1489–1499. [DOI] [PubMed] [Google Scholar]
Associated Data
This section collects any data citations, data availability statements, or supplementary materials included in this article.
Supplementary Materials
Table S1. Exclusion Criteria
Table S2. Reasons for Not Completing the Study Treatment Period (Randomized Population)
Table S3. Baseline Characteristics According to Dose Adjustment Status (Safety Population*)
Table S4. Percentage Change From Baseline in Calculated LDL‐C at Week 24: Mixed‐Effect Model With Repeated Measures (On‐Treatment Analysis—Modified ITT Population)
Table S5. Percentage Change From Baseline in Measured LDL‐C at Week 24: Analysis of Covariance—Complete Case Analysis (ITT Analysis—ITT Population)
Table S6. Adverse Events by Preferred Term Occurring in ≥2% of Patients in Either Group (Safety Population)
Figure S1. Patient disposition for CHOICE II study.
Figure S2. Impact of dosing regimen adjustment on LDL‐C levels (A) and free PCSK9 levels (B) in patients in the 75 mg Q2W alirocumab cohort: time profile from baseline to week 24 (ITT analysis).
Figure S3. The difference in percentage change from baseline to week 24 in LDL‐C (alirocumab 150Q4W vs placebo) according to baseline subgroup: demographics (A), medical history and PCSK9 levels (B), lipids (C), and medication (D) (ITT analysis).
Figure S4. Percentage reduction in LDL‐C at last value up to week 24 by anti‐alirocumab antibody status in the alirocumab 150Q4W group (A) and 75Q2W group (B) (on‐treatment analysis—modified ITT population).