

Abstract
Background
Budding uninhibited by benzimidazole‐related 1 (BubR1), a cell cycle–related protein, is an essential component of the spindle checkpoint that regulates cell division. BubR1 insufficiency causes early aging‐associated vascular phenotypes. We generated low‐BubR1‐expressing mutant (BubR1 L/L) and apolipoprotein E‐deficient (ApoE −/−) mice (BubR1 L/L ‐ApoE −/− mice) to investigate the effects of BubR1 on atherosclerosis.
Methods and Results
Eight‐week‐old male BubR1 L/L ‐ApoE −/− mice and age‐matched ApoE −/− mice were used in this study. Atherosclerotic lesion development after being fed a high‐cholesterol diet for 12 weeks was inhibited in BubR1 L/L ‐ApoE −/− mice compared with ApoE −/− mice, and was accompanied by decreased accumulation of macrophages. To address the relative contribution of BubR1 on bone marrow–derived cells compared with non‐bone marrow–derived cells, we performed bone marrow transplantation in ApoE −/− and BubR1 L/L ‐ApoE −/− mice. Decreased BubR1 in bone marrow cells and non‐bone marrow–derived cells decreased the atherosclerotic burden. In vitro assays indicated that decreased BubR1 expression impaired proliferation, but not migration, of bone marrow–derived macrophages.
Conclusions
BubR1 may represent a promising new target for regulating atherosclerosis.
Keywords: atherosclerosis, cell cycle, macrophage, proliferation
Subject Categories: Atherosclerosis, Vascular Disease, Genetically Altered and Transgenic Models
Introduction
Atherosclerosis is the major cause of cardiovascular disease, and is characterized by chronic inflammation and lipid accumulation in the vasculature.1, 2, 3, 4, 5 Macrophages accumulating in atherosclerotic lesions play important roles in the pathobiology of atherosclerosis from the initial lesion development to acute thrombotic complications occurring as a result of vulnerable plaque rupture or superficial erosion.6 Recently, it was demonstrated that local macrophage proliferation is the dominant cause of macrophage accumulation compared with the recruitment of circulating monocytes in established atherosclerotic lesions.7
Budding uninhibited by benzimidazole‐related 1 (BubR1) is a key molecule in the spindle assembly checkpoint. Checkpoint protein complexes containing BubR1 (Mad3 in yeast), Bub3, Mad2, and Cdc20 inactivate the anaphase‐promoting complex/cyclosome (APC/C) until all kinetochores are attached with microtubules in an appropriate manner.8 When all the kinetochores establish bipolar attachment, APC/CCdc20 degrades securin and cyclin B, and promotes metaphase–anaphase transition.9 BubR1 dysfunction causes an unequal segregation of chromosomes that results in chromosomal instability.
Baker10 and Matsumoto11 et al demonstrated that mice with 10% of normal BubR1 expression developed progressive aneuploidy, cataracts, lordokyphosis, loss of subcutaneous fat, impaired wound healing, a severely shortened lifespan together with early aging‐associated vascular phenotypes including a reduced number of vascular smooth muscle cells, and impaired endothelial‐dependent relaxation. We previously generated low‐BubR1‐expressing mutant mice (BubR1 L/L mice) in which BubR1 expression was reduced to 20% of the normal level and reported that low BubR1 expression almost completely inhibited intimal hyperplasia after carotid ligation by suppressing vascular smooth muscle cell proliferation, which may contribute in part to lesion formation in the early stages of atherosclerosis.12 However, the proliferative capacity of vascular smooth muscle cells declines with increasing age, ultimately contributing to plaque destabilization and subsequent vessel occlusion.13, 14, 15 The physiological relevance of BubR1 in atherosclerosis is unknown. This study investigated the functional role of BubR1 in atherosclerosis using apolipoprotein E‐deficient mice (ApoE −/− mice), a well‐known model of atherosclerosis,16, 17 as well as newly generated BubR1 L/L and ApoE −/− mice (BubR1 L/L ‐ApoE −/− mice).
Materials and Methods
Experimental Animals
All animal experiments were conducted in accordance with experimental protocols approved by the University Committee on Kyushu University Health Science Center (approval No. A25‐229‐0, No. A27‐151‐0). Low‐BubR1‐expressing mutant mice (BubR1 L/L mice) were generated in our laboratory, as previously described.12 Apolipoprotein E‐deficient mice (ApoE −/− mice) on a C57BL/6J background were obtained from The Jackson Laboratory (Genetics Research, Bar Harbor, ME).
BubR1 L/L ‐ApoE −/− mice were then generated by intercrossing BubR1 L/L mice with ApoE −/− mice 7 times. Littermate BubR1 L/L ‐ApoE −/− mice and ApoE −/− mice were used for the experiments. All mice were genotyped using tail clip samples and the polymerase chain reaction (PCR). Animals were housed under a 12‐hour light and 12‐hour dark regimen. Accelerated atherosclerosis was induced by feeding mice a high‐cholesterol diet (HCD) containing 1.25% cholesterol (D12108C; Research Diets, New Brunswick, NJ) for 12 weeks. For plasma lipid measurements, blood samples were obtained by right ventricle puncture. The blood was immediately transferred to a tube containing heparin and centrifuged at 4°C for 10 minutes. Plasma was separated immediately at 4°C and kept at −80°C until assayed. Lipid analysis was performed by CRC Inc. (Fukuoka, Japan).
Genomic PCR
Pieces of mouse tail were digested for 30 minutes at 95°C with 0.05 mol/L NaOH (500 μL). Tris‐EDTA buffer (1 mol/L Tris‐HCl [pH 8.0], 10 mmol/L EDTA) was added and the mixture was vortexed. After centrifugation (20 000g for 5 minutes), the supernatant containing genomic BubR1 DNA was used for genotyping and amplified using the following primers: mutant forward primer, 5′‐CCTTCCCGCTTCAGTGACAAC‐3′; common reverse primer, 5′‐AGAATCCTGCCGCATCTACCC‐3′; and wild‐type forward primer, 5′‐AGTTCTGGCCCTCGGAATACC‐3′. The amplification protocol involved initial denaturation at 94°C for 30 s; 35 cycles of 94°C for 1 minute, 60°C for 1 minute, 72°C for 1 minute, and a final extension at 72°C for 5 minutes. The PCR products were fractionated by electrophoresis on 1.5% agarose gels and detected by GelRed (Biotium Inc., San Francisco, CA) staining. The PCR products from BubR1 +/+ and BubR1 L/L were 475 and 938 bp, respectively.12 ApoE DNA was used for genotyping and amplified using the following primers: common forward primer, 5′‐GCCTAGCCGAGGGAGAGCCG‐3′; wild‐type reverse primer, 5′‐TGTGACTTGGGAGCTCTGCAGC‐3′; and mutant reverse primer, 5′‐AGTTCTGGCCCTCGGAATACC‐3′. The amplification protocol involved initial denaturation at 94°C for 30 s; 35 cycles of 94°C for 1 minute, 55°C for 1 minute, 72°C for 1 minute, and a final extension at 72°C for 5 minutes. The PCR products were fractionated by electrophoresis on 1.5% agarose gels and detected by ethidium bromide staining. The PCR products from ApoE +/+ and ApoE −/− were 155 and 245 bp, respectively.18
RNA Extraction and Quantitative Real‐Time PCR
Total RNA was extracted using the ISOGEN reagent (Nippon Gene, Tokyo, Japan), according to the manufacturer's protocol. Total RNA was reverse‐transcribed to cDNA using SuperScript III First‐strand Super Mix (Invitrogen, Carlsbad, CA). After cDNA was synthesized, BubR1 expression was analyzed by quantitative real‐time PCR using the TaqMan fluorogenic probe method with TaqMan Fast Universal PCR Master Mix (2×) (Thermo Fisher Scientific Inc., Waltham, MA). PCR involved initial denaturation at 95°C for 5 minutes; 45 cycles of 95°C for 10 s, 60°C for 20 s, and 72°C for 10 s with StepOne Plus Real‐Time PCR System Upgrade system (Thermo Fisher Scientific Inc.). BubR1 expression was detected using the BubR1 TaqMan probe mix (Mm00437811_m1). BubR1 expression was normalized to GAPDH expression, which was detected with the GAPDH TaqMan probe mix (Mm99999915_g1). Copy numbers of the target cDNA were estimated using a standard curve.
Western Blotting
Cell lysates were dissolved by boiling in Laemmli sample buffer (C3228; Sigma‐Aldrich Ireland Limited, Arklow, Ireland) and proteins were separated using SDS‐PAGE on 7.5% (w/v) polyacrylamide gels. The proteins were transferred onto nitrocellulose membranes, and probed with the specified primary antibodies diluted in 4% (w/v) Block Ace (UKB80; DS Pharma Biomedical Co., Ltd, Osaka, Japan) in TBS 0.1% Tween20. Alpha tubulin was used as a loading control. Primary antibodies used were anti‐BubR1 (dilution 1:1000) (NBP1‐19555; Novus Biological, Minneapolis, MN) and mouse anti‐α‐tubulin (1 μg/mL) (ab4074; Abcam, Cambridge, UK). Bound antibody was detected using horseradish peroxidase‐linked anti‐rabbit IgG (dilution 1:5000) (NA934V; GE Healthcare UK Ltd, Little Chalfont, UK). Antibody‐labeled proteins were visualized using enhanced chemiluminescence, ECL prime (RPN2232; GE Healthcare). Exposed films were digitally photographed and subjected to densitometric analysis using Image J (Synoptics Ltd, Cambridge, UK).
Morphometric Analysis and Histopathology
To quantify the extent of the atherosclerotic lesions in the whole aorta, the aortic arch and thoracic aorta were opened longitudinally, stained with Zudan III, and pinned on a black wax surface. The percentage of the plaque area stained by Zudan III compared with the total luminal surface area was quantified. To quantify the extent of the atherosclerotic lesions in the aortic root, approximately 3 serial cross sections (5‐μm thick) of the aortic root were prepared, as previously described by Paigen et al,19 with a slight modification. Briefly, atherosclerotic lesions in the aortic sinus region were examined at 3 locations, each separated by 100 μm, with the most proximal site starting after the appearance of at least 2 aortic valve leaflets.20 Serial sections were stained with elastic van Gieson. The largest plaque of the 3 valve leaflets was used for morphological analysis. The necrotic core area was defined as the areas within a lesion that were negative for hematoxylin‐positive nuclei (ie, acellular).21
Immunohistochemistry
Serial aortic root sections adjacent to sections stained with elastic van Gieson were deparaffinized, and endogenous peroxidase was blocked by incubation with 0.3% H2O2 in methanol for 5 minutes. For antigen retrieval, sections were boiled for 20 minutes in citrate buffer (pH 6.0). After blocking with 3% skim milk, sections were incubated overnight at 4°C with anti‐mouse macrophage antibody (sc‐19991; dilution 1:100; Santa Cruz Biotechnology Inc., Santa Cruz, CA), followed by incubation with biotin‐conjugated secondary antibodies (414311; Nichirei Biosciences Inc., Tokyo, Japan). The sections were then washed and treated with avidin‐peroxidase, developed using the diamino benzidine substrate kit (Wako Pure Chemical Industries, Osaka, Japan), and nuclei were counterstained with hematoxylin. Multiple observers blinded to the experiment protocol performed quantitative analysis. All images were captured using a microscope, BZ‐X700 (Keyence, Osaka, Japan) and analyzed using Image J software (freeware; National Institutes of Health, Bethesda, MD).20
Double Immunohistochemical Staining
Cell proliferation in atheromatous lesions from aortic valves was assessed using anti‐proliferating cell nuclear antigen (PCNA) antibody (rabbit polyclonal) (ab18197, Abcam). For double immunohistochemical staining, the sections were autoclaved in citrate buffer to restore antigenicity. A monoclonal anti‐macrophage MAC3 antibody (550292; BD Pharmingen, San Diego, CA) and polyclonal anti‐PCNA form antibodies (ab18197, anti‐PCNA antibody [rabbit polyclonal]; Abcam) were used as primary antibodies. Normal rabbit IgG (sc‐2027, Santa Cruz) was used for MAC3 antibody negative control. Goat anti‐rabbit IgG (H+L) (highly cross‐adsorbed; Alexa Fluor 488, A11034; Thermo Fisher Scientific Inc.) was used as a secondary antibody for anti‐PCNA. Normal rabbit IgG (sc‐2027, Santa Cruz) was used as the PCNA antibody‐negative control. Goat anti‐rat IgG (H+L) (Alexa Fluor 555, A21434; Thermo Fisher Scientific Inc.) was used as a secondary antibody for anti‐PCNA.
Irradiation and Bone Marrow Transplantation
Six‐week‐old male ApoE −/− and BubR1 L/L –ApoE −/− mice underwent whole‐body lethal irradiation (10 Gy) and 2×10⁶ freshly prepared sterile bone marrow cells obtained from ApoE −/− mice and BubR1 L/L ‐ApoE −/− mice were injected (via the tail vein), as previously described.12 Three weeks after bone marrow transplantation, the mice were fed a HCD. The mice were euthanized 12 weeks later and the aortas were obtained and processed, as described above.
Isolation and Culture of Bone Marrow–Derived Macrophages
Murine bone marrow–derived macrophages (BMMs) were obtained from ApoE −/− mice or from BubR1 L/L ‐ApoE −/− mice using standard procedures.22, 23 Mice were euthanized by cervical dislocation. Hind legs were sterilized with 70% ethanol, then clipped outward to expose the hind legs. Muscle tissue was removed from bones, which were then cut at both ends and crushed in a mortar with 5 mL of lymphocyte medium supplemented with 20 mmol/L 4‐(2‐hydroxyethyl)‐1‐piperazine ethane sulfonic acid (HEPES; 17557‐94; Nacalai Tesquet, Inc., Kyoto, Japan). Bone marrow cells were pipetted up and down to form a single‐cell suspension. Mouse monocyte lineage cells were further purified from bone marrow cells using the Purple easySep magnet (StemCell Technologies, Vancouver, Canada) and were then cultured in RPMI1640 Gibco (Thermo Fisher Scientific Inc.) supplemented with 10% heat‐inactivated fetal bovine serum (Sigma‐Aldrich Corp, St. Louis, MO), 50 IU/mL penicillin G, 50 μg/mL streptomycin (Thermo Fisher Scientific Inc.), and 40 ng/mL macrophage–colony‐stimulating factor (PeproTech Inc., Hartford, CT) for 7 days before being used for experiments, with the culture media changed on days 3, 5, 6, and 7.
Isolation and Culture of Peritoneal Macrophages
Mouse peritoneal macrophages derived from BubR1 L/L ‐ApoE −/− and ApoE −/− mice were prepared and grown in RPMI1640 Gibco medium (Thermo Fisher Scientific Inc.) supplemented with 10% fetal bovine serum (Sigma‐Aldrich Corp.), as previously described.24 After culture for 3 days, nonadherent cells were removed and the adherent cells were used for experiments.
Cell Proliferation Assay
Cell proliferation assays were performed using a Cell Proliferation ELISA, bromodeoxyuridine (colorimetric) kit (1 647 229; Roche Applied Science, Mannheim, Germany), according to the manufacturer's instructions and previously published studies.25, 26, 27 Methodological details are summarized in Data S1.
Scratch Assay
Macrophages were analyzed as previously described,28 with a slight modification. Briefly, BMMs were incubated at 37°C for 1 hour. Then, macrophages were plated in a 24‐well tissue culture–treated plate in complete growth medium to attain ≈80% confluency. Cells were allowed to adhere for 2 hours, then scraped with a P‐200 micropipette tip. Nonadherent cells were aspirated, and complete growth media was replaced. Macrophages were then incubated at 37°C, and serial images were captured at designated time points at ×100 magnification. A standardized grid was placed over the images across the breadth of the denuded zone, and cells migrating into this zone were counted in a blinded fashion using Image J software (freeware; National Institutes of Health, Bethesda, MD). Each quantified sample represented counts from 4 different wells with 2 serial images taken per well.29
Chemotaxis Assay
The chemotactic activity of peritoneal macrophages (4.0×10⁶/mL) in response to 10 ng/mL of the chemokine monocyte chemotactic protein‐1 (M6667‐10UG, Sigma‐Aldrich Inc.) was measured in a 96‐well microchemotaxis Boyden chamber (Chemo‐Tx 101‐5; Neuro Probe Inc., Gaithersburg, MD), as described elsewhere.20, 30 Macrophages that had transmigrated through the micropore were stained with trypan blue. The number of macrophages that migrated in response to monocyte chemotactic protein‐1 was counted.
Colony‐forming Units Assay
Colony‐forming units (CFU) assays of fresh bone marrow cells derived from BubR1 L/L ‐ApoE −/− and ApoE −/− mice were performed by culturing the cells on methylcellulose medium with recombinant cytokines (Methocult GF M3434; StemCell Technologies). Methocult GF M3434 (1 mL) containing 100 bone marrow cells was plated in a 35‐mm dish (27100; StemCell Technologies). The cells were cultured for 7 days at 37°C in an atmosphere of 5% CO2. Colonies containing 50 or more cells were then enumerated. The total number of colonies, CFU‐granulocyte/erythrocyte/macrophage/megakaryocyte (CFU‐GEMM), CFU‐granulocyte/macrophage (CFU‐GM), CFU‐granulocyte (CFU‐G), CFU‐macrophage (CFU‐M), and burst‐forming unit‐erythroid (BFU‐E), was specified based on morphology.31
Flow Cytometry
All steps were performed at 4°C in the dark. BMMs (5×10⁵) were resuspended in 200 μL of lymphocyte medium supplemented with 20 mmol/L HEPES, then incubated for 10 minutes. Fluorescein isothiocyanate–conjugated anti‐CD11b (11‐0112; eBioscience, San Diego, CA) (diluted 1:500) and Phycoerythrin‐conjugated anti‐F4/80 antibodies (123109; BioLegend, San Diego, CA) (diluted 1:200) were added to the cells and incubated for 30 minutes in the dark. Cells were centrifuged at 300g for 5 minutes, washed by centrifugation with 200 μL fresh lymphocyte medium, and resuspended in 300 μL of fresh lymphocyte medium. Cells were analyzed by FACScalibur (Becton Dickinson Biosciences, San Jose, CA).23 Macrophages were double‐positive for CD11b and F4/80.
Statistical Analysis
All data are expressed as the mean±SEM. For comparison of 2 groups, the statistical significance of differences was determined using an unpaired t test. For comparison of 3 or more groups, a 1‐way ANOVA was used. Statistical significance was evaluated using JMP Pro (Ver.11.0.0; SAS Institute Inc., Cary, NC). Values of P<0.05 were considered statistically significant.
Results
Generation of BubR1 L/L ‐ApoE −/− Mice
The BubR1 wild‐type (BubR1 +/+) allele and BubR1 low allele yielded a 475‐ and a 938‐bp fragment, respectively, as previous study demonstrated12 (Figure S1A and S1B). The ApoE wild‐type (ApoE +/+) DNA allele and ApoE−/− DNA allele yielded a 155‐ and a 245‐bp fragment, respectively, as previously demonstrated18 (Figure S1B and S1C).
We then performed quantitative reverse transcription–PCR to determine the relative expression of BubR1 in the thymus, and confirmed its expression in BubR1 L/L ‐ApoE −/− mice as being 19.9±3.0% of that in ApoE −/− mice (P<0.05; Figure 1A). Relative BubR1 expression in other organs of BubR1 L/L ‐ApoE −/− mice compared with ApoE −/− mice was as follows: aorta 24.7±9.7% (P<0.05; Figure 1A); white blood cells 15.7±4.6% (P<0.05; Figure 1A); and heart 20.3±3.9% (P<0.05; Figure 1A). BubR1 L/L ‐ApoE −/− mice had a normal appearance and size at birth.
Figure 1.
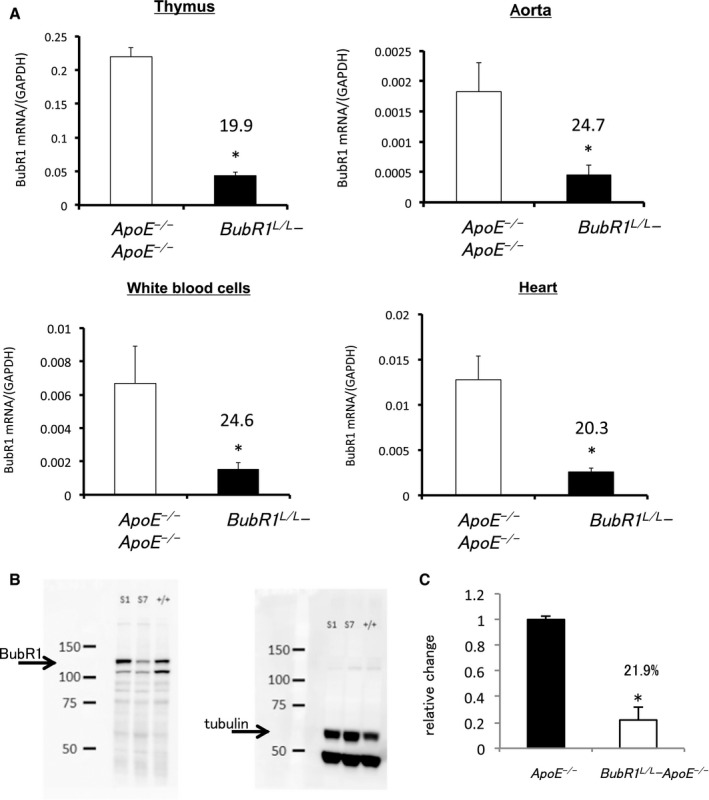
Generation of BubR1 L/L ‐ApoE −/− mice. A, BubR1 expression in the thymus of ApoE −/− and BubR1 L/L ‐ApoE −/− mice. Data are presented as the mean±SE; *P<0.01 vs ApoE −/− mice, Student t test. n=5, 6 per group, respectively. BubR1 expression in the aorta of ApoE −/− and BubR1 L/L ‐ApoE −/−mice, n=5 in each group. BubR1 expression in white blood cells of ApoE −/− and BubR1 L/L ‐ApoE −/− mice, n=5 in each group. BubR1 expression in the heart of ApoE −/− and BubR1 L/L ‐ApoE −/− mice, n=5 in each group. B and C, Western blotting for BubR1 protein in the testis. S1; ApoE −/− S7; BubR1 L/L ‐ApoE −/−; n=3 in each group. *P<0.05, vs ApoE −/−, Student t test. ApoE−/− indicates apolipoprotein E‐deficient; BubR1, Budding uninhibited by benzimidazole‐related 1.
We performed Western blotting to determine the BubR1 protein level in the testis. Relative changes in BubR1 protein expression in the BubR1 L/L ‐ApoE −/− mouse testis was 21.9±3.3% that in ApoE −/− (Figure 1B and 1C).
Reduced Expression of BubR1 Has No Significant Effect on Serum Lipid Profile
We evaluated serum lipoprotein levels that might affect atherosclerosis development and progression. There were no differences in the blood count of leukocyte subsets, platelets, and erythrocytes between ApoE −/− mice and BubR1 L/L ‐ApoE −/− mice (Table 1). ApoE −/− and BubR1 L/L ‐ApoE −/− mice had significantly increased serum cholesterol levels after being fed a HCD (Table 2). Comparing ApoE −/− and BubR1 L/L ‐ApoE −/− mice, there were no significant differences in levels of serum total cholesterol (1031.8±36.5 mg/dL versus 1078.3±83.8 mg/dL, P=0.95), low‐density lipoprotein cholesterol (833.0±21.1 mg/dL versus 916.1±76.5 mg/dL, P=0.32), high‐density lipoprotein cholesterol (65.7±12.1 mg/dL versus 55.9±4.4 mg/dL, P=0.46), and triglycerides (56.6±9.3 mg/dL versus 53.7±7.8 mg/dL, P=0.82) after being fed a HCD for 12 weeks (Table 2). After bone marrow transplantation (BMT), a HCD for 12 weeks similarly increased the serum total cholesterol and low‐density lipoprotein levels in all groups (Table 3). There were no significant differences in the lipid profile between all the groups. In addition, the main phenotypic characteristics of BubR1 L/L ‐ApoE −/− mice were not different from those of ApoE −/− mice for development and breeding efficiency.
Table 1.
Complete Blood Counts of ApoE −/− and BubR1 L/L ‐ApoE −/− Mice
| Measurement | ApoE −/− | BubR1 L/L ‐ApoE −/− | P‐Valuea |
|---|---|---|---|
| Red blood cells, ×104/μL | 992±19 | 946±20 | 0.10 |
| White blood cells, /μL | 4322±220 | 4111±278 | 0.54 |
| Neutrophils, % | 20.6±2.1 | 19.2±2.1 | 0.59 |
| Lymphocytes, % | 68.7±1.8 | 68.3±2.1 | 0.89 |
| Monocytes, % | 6.6±0.6 | 7.8±0.7 | 0.21 |
| Eosinophils, % | 3.7±1.3 | 2.9±0.7 | 0.63 |
| Platelets, ×104/μL | 138±6.0 | 127±14.0 | 0.47 |
ApoE−/− indicates apolipoprotein E‐deficient; BubR1, Budding uninhibited by benzimidazole‐related 1.
The data are expressed as the mean±SE, n=9 in each group.
Student t test.
Table 2.
Lipid Profiles of ApoE −/− and BubR1 L/L ‐ApoE −/− Mice
| Measurement | ApoE −/− | BubR1 L/L ‐ApoE −/− | ||
|---|---|---|---|---|
| Pre | Posta | Pre | Posta | |
| Total cholesterol, mg/dL | 449.0±23.7 | 1031.8±36.5 | 431.6±32.2 | 1078.3±83.8 |
| LDL cholesterol, mg/dL | 282.6±18.1 | 833.0±21.1 | 306.1±14.6 | 916.1±76.5 |
| HDL cholesterol, mg/dL | 50.6±4.9 | 65.7±12.1 | 41.6±4.9 | 55.9±4.4 |
| Triglycerides, mg/dL | 82.3±17.2 | 56.6±9.3 | 93.5±33.9 | 53.7±7.8 |
The data are expressed as the mean±SE, n=7 in each group. Post indicates after 12 weeks of HCD treatment. Pre indicates at the beginning of 12 weeks of HCD treatment. ApoE−/− indicates apolipoprotein E‐deficient; BubR1, Budding uninhibited by benzimidazole‐related 1; HCD, high‐cholesterol diet; HDL, high‐density lipoprotein; LDL, low‐density lipoprotein.
P<0.05, pre vs post, Student t test.
Table 3.
Lipid Profiles of Bone Marrow–Transplanted Model Mice After 12 Weeks of HCD Treatment
| Measurement | ApoE −/− →ApoE −/− | BubR1 L/L ‐ApoE −/− →ApoE −/− | ApoE −/− →BubR1 L/L ‐ApoE −/− | BubR1 L/L ‐ApoE −/− →BubR1 L/L ‐ApoE −/− | P‐Valuea |
|---|---|---|---|---|---|
| Total cholesterol, mg/dL | 1045.5±82.0 | 1057.1±60.7 | 1019.1±52.1 | 1046.0±50.1 | 0.94 |
| LDL cholesterol, mg/dL | 888.4±77.6 | 909.4±49.6 | 871.8±52.7 | 879.6±52.9 | 0.99 |
| HDL cholesterol, mg/dL | 74.5±7.4 | 76.8±12.4 | 80.8±7.8 | 77.3±7.2 | 0.94 |
| Triglycerides, mg/dL | 69.8±13.2 | 66.4±8.9 | 62.0±10.4 | 66.3±8.3 | 0.94 |
The data are expressed as the mean±SE, n=6 in each group. ApoE−/− indicates apolipoprotein E‐deficient; BubR1, Budding uninhibited by benzimidazole‐related 1; HCD, high‐cholesterol diet; HDL, high‐density lipoprotein; LDL, low‐density lipoprotein.
ANOVA 1‐way method.
Repression of BubR1 Gene Expression Decreases Atherosclerotic Burden in ApoE −/− Mice
To visualize lipid‐rich atherosclerotic plaques, aortas were stained with Zudan III. As shown in Figure 2A, BubR1 L/L ‐ApoE −/− mice exhibited significantly less atherosclerosis compared with ApoE −/− mice: total aortic coverage, 30.2±3.0% in ApoE −/− mice versus 8.6±1.1% in BubR1 L/L ‐ApoE −/− mice (P<0.05); aortic arch coverage, 48.7±5.0% in ApoE −/− mice versus 19.4±7.7% in BubR1 L/L ‐ApoE −/− mice (P<0.05); and descending aorta coverage, 24.7±7.7% in ApoE −/− mice versus 6.3±2.2% in BubR1 L/L ‐ApoE −/− mice (P<0.05).
Figure 2.
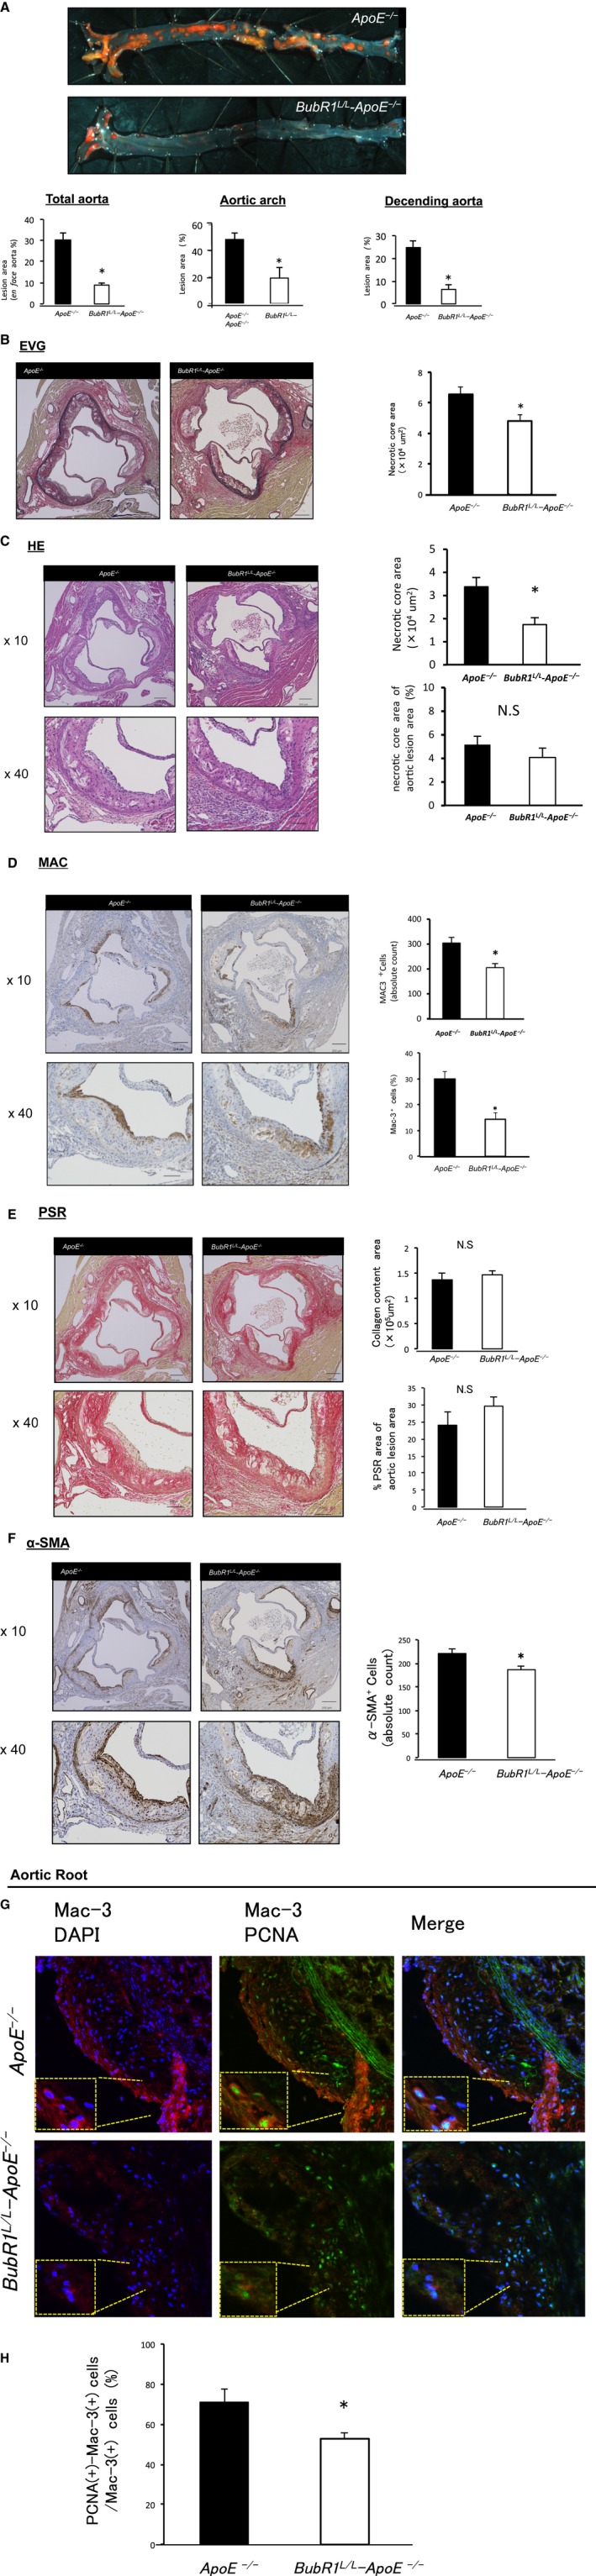
A, Photomicrograph evaluation of en face aortas, stained with Zudan III and quantitative analysis of atherosclerosis in the total aorta, aortic arch, and descending aorta after 12 weeks of a HCD. Data are presented as the mean±SE; *P<0.05 vs ApoE −/− mice, Student t test. n=7, 9 per group, respectively. B through F, Photomicrographs of atherosclerotic plaques in the aortic root stained with HE, EVG, MAC‐3, PSR and α‐SMA. Data are presented as the mean±SE; *P<0.05 vs ApoE −/− mice, Student t test (n=7 of BubR1 L/L ‐ApoE −/− mice and n=9 of ApoE −/− mice). Scale bar, 200 μm. G and H, Immunofluorescence experiments identified PCNA(+)‐Mac3(+) macrophages within the lesion area of the aortic root. PCNA(+)‐Mac3(+) cells/Mac3(+) cells (%) in the aortic root of BubR1 L/L ‐ApoE −/− mice was significantly reduced compared with those of ApoE −/− mice. Data are presented as the mean±SE; *P<0.05 vs ApoE −/− mice, Student t test. n=5, 6 per group. ApoE‐/‐ indicates apolipoprotein E‐deficient; BubR1, Budding uninhibited by benzimidazole‐related 1; DAPI, diamidino‐2‐phenylindole; EVG, elastic van Gieson; HCD, high‐cholesterol diet; HE, Hematoxylin‐Eosin; PCNA, proliferating cell nuclear antigen; PSR, Picro‐Sirius Red; SMA, smooth muscle actin.
In another cohort of mice, we quantified the plaque area in elastic van Gieson– stained cross sections of the aortic root lesions. The lesion area was significantly decreased in BubR1 L/L ‐ApoE −/− mice compared with ApoE −/− mice ([6.5±0.5]×105 μm2 versus [4.7±0.4]×105 μm2, P<0.05; Figure 2B). The necrotic core area of aortic root lesions was significantly decreased in BubR1 L/L ‐ApoE −/− mice compared with ApoE −/− mice ([1.7±0.4]×104 μm2 versus [3.3±0.3]×104 μm2, P<0.05; Figure 2C). There were no differences in the percent area of the necrotic core area in aortic lesions (ApoE −/−: 5.1±0.7, BubR1 L/L ‐ApoE −/−: 4.0±0.8 (%); Figure 2C). Percent area of Mac‐3‐positive macrophages in the aortic root lesions was lower in BubR1 L/L ‐ApoE −/− mice compared with ApoE −/− mice (30.0±2.7% versus 14.3±2.5%, P<0.05, Figure 2D). Absolute counts of Mac‐3‐positive macrophages was also lower in BubR1 L/L ‐ApoE −/− mice (205.1±16.3 versus 304.1±22.4, P<0.05, Figure 2D).
There were no differences in collagen content and percent area of collagen in the aortic root lesions between ApoE −/− mice and BubR1 L/L ‐ApoE −/− mice (Figure 2E). The α‐SMA‐stained cells in BubR1 L/L ‐ApoE −/− mice were significantly reduced compared with those of ApoE −/− mice (186.4±8.4 versus 220.6±9.5, P<0.05; Figure 2F). PCNA(+)‐Mac3(+) cells/Mac3(+) cells (%) in the aortic root of BubR1 L/L ‐ApoE −/− mice were significantly reduced compared with those of ApoE −/− mice (71.0±6.8% versus 52.8±2.7%, P<0.05 Figure 2G and 2H).
BubR1 Insufficiency in Bone Marrow–Derived Cells Results in Attenuated Atherogenesis
To determine whether BubR1 in leukocytes contributed to atherosclerosis, we performed a BMT experiment.
We performed BMT from BubR1 L/L‐ApoE −/− as a donor to ApoE −/− as a recipient (BubR1 L/L‐ApoE −/−→ApoE −/−) and BMT from ApoE −/− as a donor to ApoE −/− as a recipient (ApoE −/−→ApoE −/−); from ApoE −/− as a donor to BubR1 L/L‐ApoE −/− as a recipient (ApoE −/−→BubR1 L/L‐ApoE −/−); and from BubR1 L/L‐ApoE −/− as a donor to BubR1 L/L‐ApoE −/− as a recipient (BubR1 L/L‐ApoE −/−→BubR1 L/L‐ApoE −/−). Figure 3A shows results of Zudan III‐stained atherosclerotic plaques after BMT. A significant reduction was observed in the atherosclerotic lesion area between ApoE −/−→ApoE −/− and BubR1 L/L ‐ApoE −/−→ApoE −/− mice (6.6±1.7% versus 3.5±0.7%; P<0.05) and between ApoE −/−→BubR1 L/L‐ApoE −/− and BubR1 L/L‐ApoE −/−→BubR1 L/L‐ApoE −/− mice (2.4±0.3% versus 1.3±0.2%; P<0.05).
Figure 3.
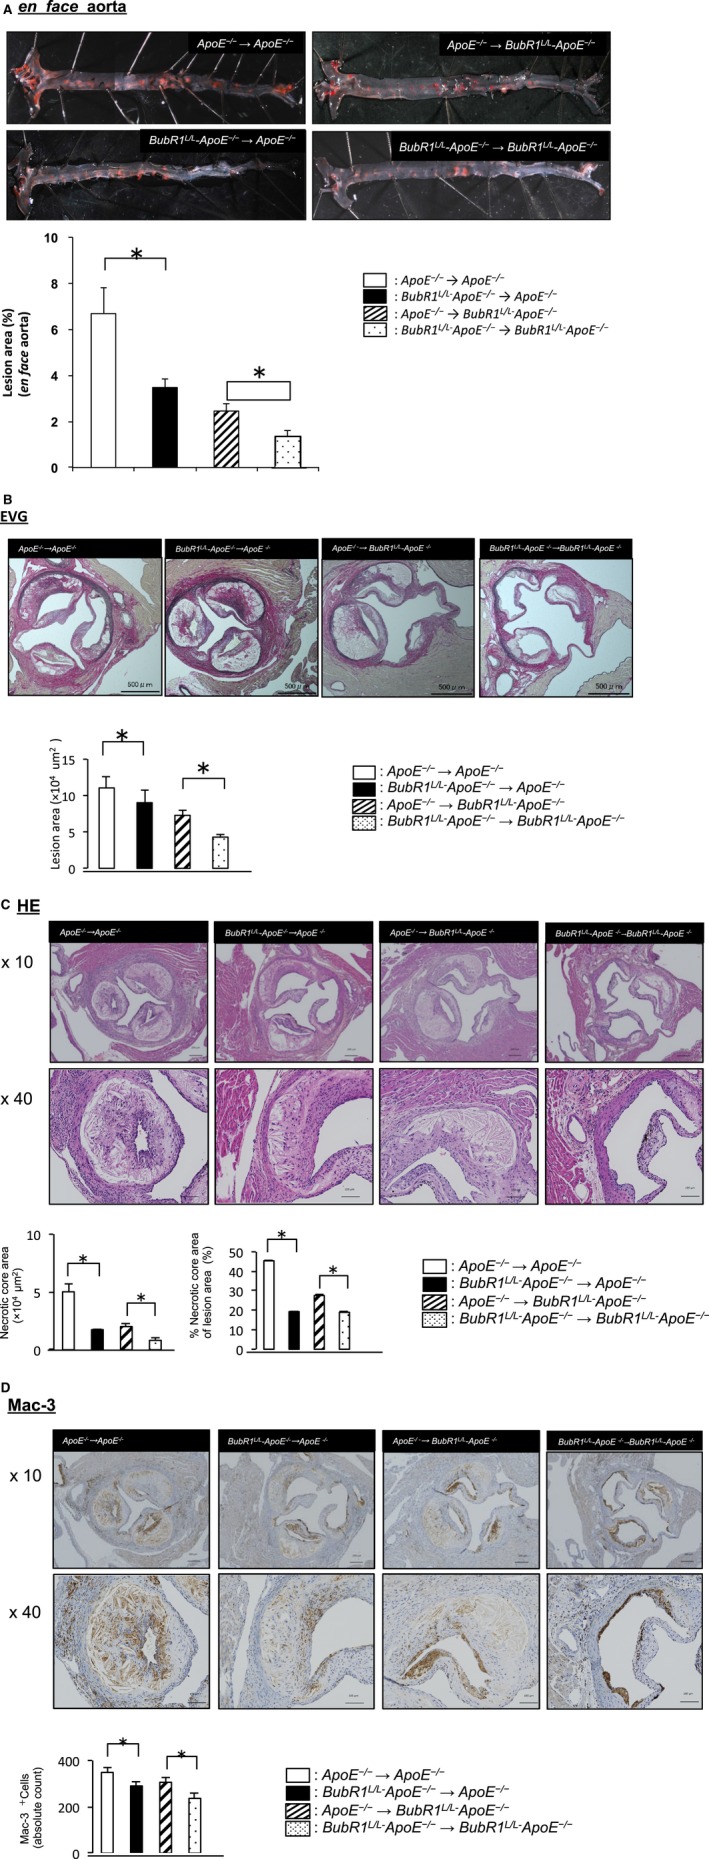
Effect of bone marrow transplantation on the atherosclerosis lesion area in ApoE −/− and BubR1 L/L‐ApoE −/− mice. A, Photomicrographs of the en face evaluation of ApoE −/−→ApoE −/−, BubR1 L/L‐ApoE −/−→ApoE −/−, ApoE −/−→BubR1 L/L‐ApoE −/− and BubR1 L/L‐ApoE −/−→BubR1 L/L‐ApoE −/− mouse aortas stained with Zudan III, and quantitative analysis of atherosclerosis of the total aorta after 12 weeks of a HCD. Data are presented as the mean±SE; *P<0.05, Student t test, n=6 in each group. B, Atherosclerosis lesion area of mice in the aortic root lesion, stained with EVG. Data are presented as the mean±SE; *P<0.05, Student t test; n=6 in each group. C, Necrotic core lesion area of mice in the aortic root lesion stained with HE. Data are presented as the mean±SE; *P<0.05, Student t test; n=6 in each group. D, Mac3‐positive absolute cell count in the aortic root lesion area of mice. Data are presented as the mean±SE; *P<0.05, Student t test; n=6 in each group. ApoE−/− indicates apolipoprotein E‐deficient; BubR1, Budding uninhibited by benzimidazole‐related 1; EVG, elastic van Gieson; HCD, high‐cholesterol diet; HE, Hematoxylin‐Eosin.
Figure 3B shows elastic van Gieson staining of the aortic root in these BMT mice. Lesion area was significantly decreased in BubR1 L/L ‐ApoE −/−→ApoE −/− mice compared with ApoE −/−→ApoE −/− mice ([7.3±0.8]×105 μm2 versus [11.0±1.5]×105 μm2, P<0.05). Figure 3C shows HE staining of the aortic root in these BMT mice. The necrotic core area, defined as those areas within a lesion that were negative for hematoxylin‐positive nuclei (ie, acellular), of BubR1 L/L‐ApoE −/−→ApoE −/− mice, was significantly reduced compared with ApoE −/−→ApoE −/− mice ([1.7±0.1]×104 μm2 versus [5.0±0.7]×104 μm2, P<0.05). Absolute counts of Mac‐3‐positive macrophages were also lower BubR1 L/L‐ApoE −/−→ApoE −/− compared with ApoE −/−→ApoE −/− (290±19 versus 348±22, P<0.05, Figure 3D).
Evaluation of the bone marrow replacement rate using C57BL/6J (recipient) and green fluorescent protein (donor) mice revealed that recipient mice had 98.6±0.2% of their total monocyte cells derived from the donor mice (n=5; Figure S2).
Repression of Macrophage BubR1 Expression Impairs Proliferation, but Not Migration, of Macrophages
Peritoneal macrophages and BMMs were used to evaluate the proliferative capacity of macrophages. Bone marrow cells were cultured ex vivo, as described above. We confirmed induction of the differentiation to macrophages by flow cytometry using anti‐CD11b and anti‐F4/80 antibodies. There were no differences in the serum macrophage–colony‐stimulating factor levels in ApoE−/− mice (5.8±0.2 ng/mL) and BubR1L/L‐ApoE−/− mice (6.4±0.4 ng/mL; P=0.27). Repression of BubR1 expression in both peritoneal macrophages and BMMs inhibited the macrophage–colony‐stimulating factor‐induced proliferation (P<0.05; Figure 4A).
Figure 4.
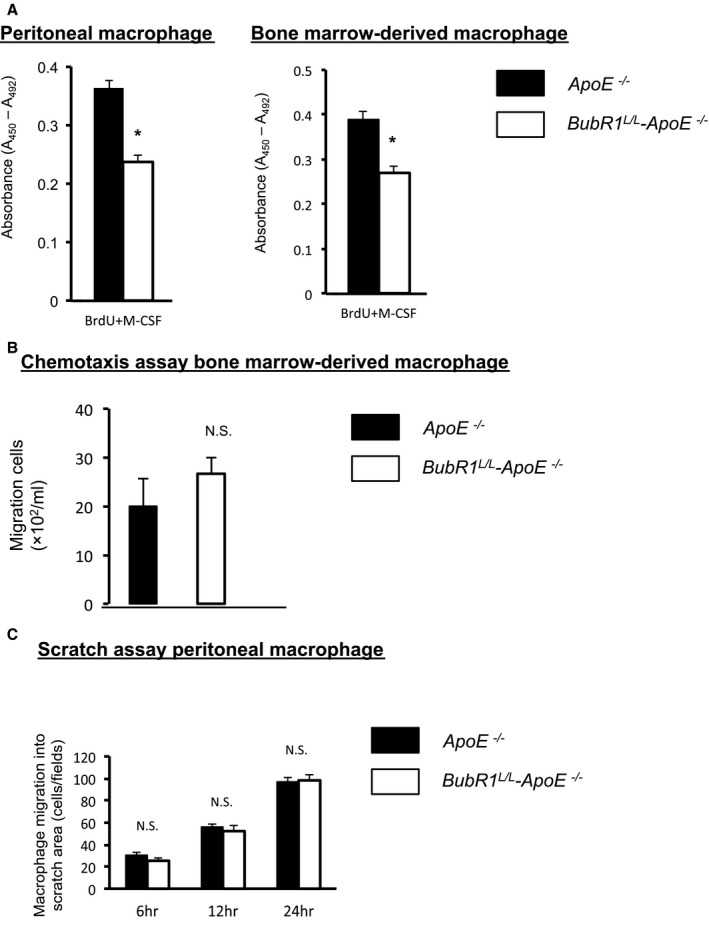
In vitro macrophage assay. A, Cell proliferation was slower in BubR1 L/L‐ApoE −/− peritoneal macrophages (white bar) than in ApoE −/− macrophages (black bar; n=6 in each group); *P<0.05, Student t test. B, Cell proliferation was slower in BubR1 L/L‐ApoE −/− macrophage‐derived bone marrow cells (white bar) than in ApoE −/− macrophages (black bar; n=5 in each group). MCP‐1 concentration was 10 ng/mL; P<0.05 Student t test. C, Migration capacity was not significantly different between ApoE −/− macrophages (black bar) and BubR1 L/L ‐ApoE −/− macrophages (white bar; n=4 in each group). Student t test, NS, not significant. ApoE−/− indicates apolipoprotein E‐deficient; BrdU, bromodeoxyuridine; BubR1, Budding uninhibited by benzimidazole‐related 1; MCP‐1, monocyte chemotactic protein‐1; M‐CSF, macrophage colony‐stimulating factor.
We assessed the macrophage migration using a classic chemotaxis assay. Migration capacity of macrophages was not significantly different between ApoE −/− mice and BubR1 L/L‐ApoE −/− mice (P=0.374; Figure 4B).
Finally, we assessed the migration capacity of macrophages using a scratch assay. Migration capacity of macrophages was not significantly different between macrophages from ApoE −/− mice and BubR1 L/L ‐ApoE −/− mice (P=0.70; Figure 4C).
We performed CFU assays to clarify whether normally developed and functionally indifferent macrophage progenitors exist in both groups. We counted CFU‐GEMM, CFU‐GM, CFU‐G, CFU‐M, and BFU‐E colonies. Colony counts for BFU‐E, CFU‐GM, CFU‐G, CFU‐M, CFU‐GEMM, and the overall number were (ApoE −/− and BubR1 L/L ‐ApoE −/−, respectively): 6.0±0.79 and 4.8±0.54; 21.8±3.2 and 21.6±2.0; 24±1.9 and 21±1.4; 12.4±1.8 and 10.6±1.3; 1.6±0.44 and 1.0±0.22; and 65.8±4.5 and 59.0±4.4, respectively. There were no significant functional development differences between the groups (P=0.40, 0.954, 0.21, 0.40, 0.26; Figure 5).
Figure 5.
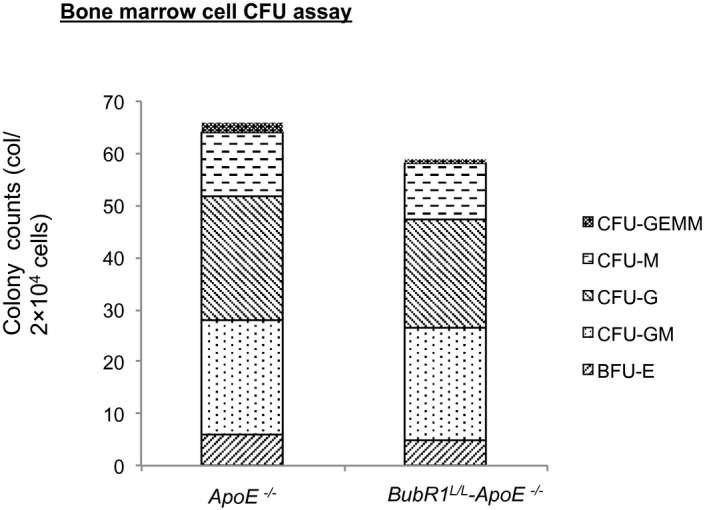
CFU assay of whole bone marrow cells from ApoE −/− and BubR1 L/L ‐ApoE −/− mice. Colony counts represent total number from 2 plates. Data are presented as the mean±SE; *P<0.05, Student t test. n=5 in each group. ApoE−/− indicates apolipoprotein E‐deficient; BFU, burst‐forming unit; BubR1, Budding uninhibited by benzimidazole‐related 1; CFU, colony‐forming units; CFU‐G, CFU‐granulocyte; CFU‐GEMM, CFU‐granulocyte/erythrocyte/macrophage/megakaryocyte; CFU‐GM, CFU‐granulocyte/macrophage; CFU‐M, CFU‐macrophage.
Discussion
We generated novel apolipoprotein E‐deficient (ApoE −/−) and low‐BubR1‐expressing mutant (BubR1 L/L) mice (BubR1 L/L ‐ApoE −/− mice) to investigate the functional role of BubR1 in atherosclerosis These mice showed no increase in serum cholesterol levels when the mice were fed a HCD.
Our novel findings in this study are summarized as follows: (1) repression of the BubR1 gene expression decreased the atherosclerotic burden in ApoE −/− mice; and (2) repression of macrophage BubR1 expression impaired proliferation, but not migration, of macrophages.
BubR1, a cell cycle–related protein, is a key molecule in the spindle assembly checkpoint.8 Previous studies demonstrated that BubR1 insufficiency in mice caused phenotypic changes reminiscent of vascular aging.11, 12 We tested the hypothesis that BubR1 insufficiency in hyperlipidemic ApoE −/− mice would exacerbate atherosclerosis as a result of vascular cell senescence. Contrary to our hypothesis, we found that arterial lesions were significantly reduced in BubR1 L/L ‐ApoE −/− mice fed a HCD, and that this was accompanied by a reduction in macrophage accumulation in atherosclerotic plaques. Reduced BubR1 expression did not affect serum cholesterol levels, ruling out the possibility that hypercholesterolemia contributes to alterations of atherogenesis in BubR1 L/L ‐ApoE −/− mice.
As described in (1), we found that suppression of BubR1 impaired atherosclerosis, as shown using Zudan III stain (Figure 2A). Macrophages play a key role by mediating inflammation, and accelerating atherosclerosis.21, 22 Previous studies suggested that recruitment/infiltration of circulating monocytes into the vascular wall causes the accumulation of macrophages in atherosclerotic plaques.23, 24, 25, 26, 27, 28, 29, 30 However, recent research has indicated that macrophage accumulation does not only depend on the recruitment/infiltration of circulating monocytes, and in some inflammatory contexts, local macrophage proliferation is dominant.7 These results suggest that macrophage self‐renewal is a novel therapeutic target to treat cardiovascular diseases.7, 31
To determine whether insufficiency of BubR1 contributes to macrophage accumulation, we investigated the relationship between BubR1 and macrophages. We performed immunohistochemistry of Mac‐3 in atherosclerotic lesions at the aortic root of BubR1 L/L ‐ApoE −/− mice and ApoE −/− mice fed HCD for 12 weeks. BubR1 insufficiency reduced Mac‐3‐positive macrophage numbers in BubR1 L/L ‐ApoE −/− mice (Figure 2D).
We showed that the number of macrophages that were proliferating in the heart was decreased in vivo (Figure 2G and 2H). Areas of arteriosclerosis were found to be reduced in BubR1 L/L ‐ApoE −/− mice because of a decrease in the number of proliferating macrophages. These results suggest that insufficiency of BubR1 suppresses local proliferation of macrophages or the recruitment of circulating monocytes.
To confirm that macrophage BubR1 regulates atherosclerosis, we performed a BMT study. As shown in Figure 3A, we suppressed atherosclerosis induced by BubR1 insufficiency in bone marrow––derived cells including monocytes.
To clarify the effect of BubR1 insufficiency on macrophage function, we differentiated macrophages from bone marrow cells. There was an experimental limitation in harvesting macrophages from aortic plaques because it was difficult to harvest and culture pure macrophage cells. Therefore, we performed bone marrow and peritoneal macrophage assays instead of using aortic macrophages. Figure 4A and 4B shows that the proliferation of BubR1‐insufficient macrophages was markedly suppressed compared with control macrophages, but that this did not contribute to macrophage migration (Figure 4C), as described in (2). This result is consistent with tight control of cell proliferation by cell cycle regulators including BubR1.8, 10
Host cells, such as macrophages, smooth muscle cells, and T cells, seem to play major roles in inducing arteriosclerosis, because the percentage of atherosclerotic plaques decreased when host cell BubR1 expression was reduced, as shown in Figure 3A. However, we also demonstrated that bone marrow macrophages have a role in inducing arteriosclerosis. We discovered, for the first time, that smooth muscle cells and also macrophages are involved in the reduction of arteriosclerosis in BubR1 L/L ‐ApoE −/− mice.
In summary, we generated BubR1 L/L ‐ApoE −/− mice, in which BubR1 expression was ≈20% of that in ApoE −/− mice. We used these mice to examine the role of BubR1 in atherosclerotic lesion development. We found that reduced BubR1 expression in ApoE −/− mice inhibits macrophage accumulation and atherosclerotic lesion development in metabolically challenged ApoE −/− mice. In vivo and in vitro data suggested that decreased macrophage proliferation may be a mechanism of reducing macrophage accumulation in BubR1 L/L ‐ApoE −/− mice. Our data suggest that BubR1 is a promising therapeutic target to prevent atherosclerotic lesion development and devastating life‐threatening complications including acute myocardial infarction. Further studies are needed to clarify the effect of BubR1 insufficiency on bone marrow transfer into mice with established lesions or pharmaceutical interference during late‐stage atherosclerosis.
Sources of Funding
This work was supported in part by the Japan Society for the Promotion of Science (JSPS) Grant‐in‐Aid for Scientific Research (C) Grant Number 25462164 and Scientific Research (S) Grant Number 15H05792 (to T. Matsumoto, Y. Maehara, and Y. Yonemitsu).
Disclosures
None.
Supporting information
Data S1. Supplemental material and methods.
Figure S1. Mechanism involved in the reduction of protein expression by low‐expression alleles generated by cryptic splicing. A, Schematic diagram of BubR1L/L mice gene. B, PCR of BubR1 L/L ‐ApoE −/− mice genomic DNA confirms the presence of mutant (938‐bp fragment) BubR1 genomic DNA and the presence of mutant (245‐bp fragment) ApoE genomic DNA. C, Schematic diagram of ApoE−/− mice gene.
Figure S2. We evaluated the bone marrow replacement rate using C57BL/6J (recipient) and green fluorescent protein (donor) mice by FACS. Dot plots show side scatter vs eGFP. The recipient mice had 98.6±0.2% of total monocytes derived from donor mice (n=5 in each group).
Acknowledgments
We thank Hiroshi Fujii, Kaku Nakano, Ryoko Nakamura, Natsumi Maeda, and Saori Tsurumaru for their technical assistance with the experiments, and Rie Nishikuma for help in preparing the manuscript.
(J Am Heart Assoc. 2016;5:e004081 doi: 10.1161/JAHA.116.004081)
References
- 1. Hansson GK. Inflammation, atherosclerosis, and coronary artery disease. N Engl J Med. 2005;352:1685–1695. [DOI] [PubMed] [Google Scholar]
- 2. Ross R. Atherosclerosis—an inflammatory disease. N Engl J Med. 1999;340:115–126. [DOI] [PubMed] [Google Scholar]
- 3. Lusis AJ. Atherosclerosis. Nature. 2000;407:233–241. [DOI] [PMC free article] [PubMed] [Google Scholar]
- 4. Libby P. Inflammation in atherosclerosis. Nature. 2002;420:868–874. [DOI] [PubMed] [Google Scholar]
- 5. Weber C, Noels H. Atherosclerosis: current pathogenesis and therapeutic options. Nat Med. 2011;17:1410–1422. [DOI] [PubMed] [Google Scholar]
- 6. Libby P, Lichtman AH, Hansson GK. Immune effector mechanisms implicated in atherosclerosis: from mice to humans. Immunity. 2013;38:1092–1104. [DOI] [PMC free article] [PubMed] [Google Scholar]
- 7. Robbins CS, Hilgendorf I, Weber GF, Theurl I, Iwamoto Y, Figueiredo JL, Gorbatov R, Sukhova GK, Gerhardt LM, Smyth D, Zavitz CC, Shikatani EA, Parsons M, van Rooijen N, Lin HY, Husain M, Libby P, Nahrendorf M, Weissleder R, Swirski FK. Local proliferation dominates lesional macrophage accumulation in atherosclerosis. Nat Med. 2013;19:1166–1172. [DOI] [PMC free article] [PubMed] [Google Scholar]
- 8. Yu H. Regulation of APC‐Cdc20 by the spindle checkpoint. Curr Opin Cell Biol. 2002;14:706–714. [DOI] [PubMed] [Google Scholar]
- 9. King RW, Deshaies RJ, Peters JM, Kirschner MW. How proteolysis drives the cell cycle. Science. 1996;274:1652–1659. [DOI] [PubMed] [Google Scholar]
- 10. Baker DJ, Jeganathan KB, Cameron JD, Thompson M, Juneja S, Kopecka A, Kumar R, Jenkins RB, de Groen PC, Roche P, van Deursen JM. BubR1 insufficiency causes early onset of aging‐associated phenotypes and infertility in mice. Nat Genet. 2004;36:744–749. [DOI] [PubMed] [Google Scholar]
- 11. Matsumoto T, Baker DJ, d'Uscio LV, Mozammel G, Katusic ZS, van Deursen JM. Aging‐associated vascular phenotype in mutant mice with low levels of BubR1. Stroke. 2007;38:1050–1056. [DOI] [PubMed] [Google Scholar]
- 12. Kyuragi R, Matsumoto T, Harada Y, Saito S, Onimaru M, Nakatsu Y, Tsuzuki T, Nomura M, Yonemitsu Y, Maehara Y. BubR1 insufficiency inhibits neointimal hyperplasia through impaired vascular smooth muscle cell proliferation in mice. Arterioscler Thromb Vasc Biol. 2015;35:341–347. [DOI] [PubMed] [Google Scholar]
- 13. Clowes AW, Reidy MA, Clowes MM. Kinetics of cellular proliferation after arterial injury. I. Smooth muscle growth in the absence of endothelium. Lab Invest. 1983;49:327–333. [PubMed] [Google Scholar]
- 14. Schwartz SM, Reidy MR, Clowes A. Kinetics of atherosclerosis: a stem cell model. Ann N Y Acad Sci. 1985;454:292–304. [DOI] [PubMed] [Google Scholar]
- 15. Newby AC, Zaltsman AB. Fibrous cap formation or destruction—the critical importance of vascular smooth muscle cell proliferation, migration and matrix formation. Cardiovasc Res. 1999;41:345–360. [PubMed] [Google Scholar]
- 16. Nakashima Y, Plump AS, Raines EW, Breslow JL, Ross R. ApoE‐deficient mice develop lesions of all phases of atherosclerosis throughout the arterial tree. Arterioscler Thromb. 1994;14:133–140. [DOI] [PubMed] [Google Scholar]
- 17. Nakashima Y, Raines EW, Plump AS, Breslow JL, Ross R. Upregulation of VCAM‐1 and ICAM‐1 at atherosclerosis‐prone sites on the endothelium in the ApoE‐deficient mouse. Arterioscler Thromb Vasc Biol. 1998;18:842–851. [DOI] [PubMed] [Google Scholar]
- 18. Sui Y, Park SH, Helsley RN, Sunkara M, Gonzalez FJ, Morris AJ, Zhou C. Bisphenol A increases atherosclerosis in pregnant X receptor‐humanized ApoE deficient mice. J Am Heart Assoc. 2014;3:e000492 doi: 10.1161/JAHA.113.000492. [DOI] [PMC free article] [PubMed] [Google Scholar]
- 19. Paigen B, Morrow A, Holmes PA, Mitchell D, Williams RA. Quantitative assessment of atherosclerosis lesions in mice. Atherosclerosis. 1987;68:231–240. [DOI] [PubMed] [Google Scholar]
- 20. Katsuki S, Matoba T, Nakashiro S, Sato K, Koga J, Nakano K, Nakano Y, Egusa S, Sunagawa K, Egashira K. Nanoparticle‐mediated delivery of pitavastatin inhibits atherosclerotic plaque destabilization/rupture in mice by regulating the recruitment of inflammatory monocytes. Circulation. 2014;129:896–906. [DOI] [PubMed] [Google Scholar]
- 21. Seimon TA, Wang Y, Han S, Senokuchi T, Schrijivers DM, Kuriakose G, Tall AR, Tabas IA. Macrophage deficiency of p38 MAPK promotes apoptosis and plaque necrosis in advanced atherosclerotic lesions in mice. J Clin Invest. 2009;119:886–898. [DOI] [PMC free article] [PubMed] [Google Scholar]
- 22. Hirsch S, Austyn JM, Gordon S. Expression of the macrophage‐specific antigen F4/80 during differentiation of mouse bone marrow cells in culture. J Exp Med. 1981;154:713–725. [DOI] [PMC free article] [PubMed] [Google Scholar]
- 23. Weischenfeldt J, Porse B. Bone marrow‐derived macrophages (BMM): isolation and applications. CSH Protoc. 2008;3: doi: 10.1101/pdb.prot5080. [DOI] [PubMed] [Google Scholar]
- 24. Gotoh T, Oyadomari S, Mori K, Mori M. Nitric oxide‐induced apoptosis in RAW 264.7 macrophages is mediated by endoplasmic reticulum stress pathway involving ATF6 and CHOP. J Biol Chem. 2002;277:12343–12350. [DOI] [PubMed] [Google Scholar]
- 25. Mogi M, Ozeki N, Nakamura H, Togari A. Dual roles for NF‐kappaB activation in osteoblastic cells by serum deprivation: osteoblastic apoptosis and cell‐cycle arrest. Bone. 2004;35:507–516. [DOI] [PubMed] [Google Scholar]
- 26. Mogi M, Togari A. Activation of caspases is required for osteoblastic differentiation. J Biol Chem. 2003;278:47477–47482. [DOI] [PubMed] [Google Scholar]
- 27. Ozeki N, Mogi M, Nakamura H, Togari A. Differential expression of the Fas‐Fas ligand system on cytokine‐induced apoptotic cell death in mouse osteoblastic cells. Arch Oral Biol. 2002;47:511–517. [DOI] [PubMed] [Google Scholar]
- 28. Suen PW, Ilic D, Caveggion E, Berton G, Damsky CH, Lowell CA. Impaired integrin‐mediated signal transduction, altered cytoskeletal structure and reduced motility in Hck/Fgr deficient macrophages. J Cell Sci. 1999;112:4067–4078. [DOI] [PubMed] [Google Scholar]
- 29. Koth LL, Cambier CJ, Ellwanger A, Solon M, Hou L, Lanier LL, Abram CL, Hamerman JA, Woodruff PG. DAP12 is required for macrophage recruitment to the lung in response to cigarette smoke and chemotaxis toward CCL2. J Immunol. 2010;184:6522–6528. [DOI] [PMC free article] [PubMed] [Google Scholar]
- 30. Han KH, Ryu J, Hong KH, Ko J, Pak YK, Kim JB, Park SW, Kim JJ. HMG‐CoA reductase inhibition reduces monocyte CC chemokine receptor 2 expression and monocyte chemoattractant protein‐1‐mediated monocyte recruitment in vivo. Circulation. 2005;111:1439–1447. [DOI] [PubMed] [Google Scholar]
- 31. Zhang P, Nelson S, Bagby GJ, Siggins R II, Shellito JE, Welsh DA. The lineage‐c‐kit+Sca‐1+ cell response to Escherichia coli bacteremia in Balb/c mice. Stem Cells. 2008;26:1778–1786. [DOI] [PMC free article] [PubMed] [Google Scholar]
Associated Data
This section collects any data citations, data availability statements, or supplementary materials included in this article.
Supplementary Materials
Data S1. Supplemental material and methods.
Figure S1. Mechanism involved in the reduction of protein expression by low‐expression alleles generated by cryptic splicing. A, Schematic diagram of BubR1L/L mice gene. B, PCR of BubR1 L/L ‐ApoE −/− mice genomic DNA confirms the presence of mutant (938‐bp fragment) BubR1 genomic DNA and the presence of mutant (245‐bp fragment) ApoE genomic DNA. C, Schematic diagram of ApoE−/− mice gene.
Figure S2. We evaluated the bone marrow replacement rate using C57BL/6J (recipient) and green fluorescent protein (donor) mice by FACS. Dot plots show side scatter vs eGFP. The recipient mice had 98.6±0.2% of total monocytes derived from donor mice (n=5 in each group).