Abstract
Background. Human immunodeficiency virus type 1 (HIV)–infected persons are more susceptible to tuberculosis than HIV–uninfected persons. Low peripheral CD4+ T-cell count is not the sole cause of higher susceptibility, because HIV–infected persons with a high peripheral CD4+ T-cell count and those prescribed successful antiretroviral therapy (ART) remain more prone to active tuberculosis than HIV–uninfected persons. We hypothesized that the increase in susceptibility is caused by the ability of HIV to manipulate Mycobacterium tuberculosis–associated granulomas.
Methods. We examined 71 excised cervical lymph nodes (LNs) from persons with HIV and M. tuberculosis coinfection, those with HIV monoinfection, and those with M. tuberculosis monoinfection with a spectrum of peripheral CD4+ T-cell counts and ART statuses. We quantified differences in M. tuberculosis levels, HIV p24 levels, cellular response, and cytokine presence within granulomas.
Results. HIV increased M. tuberculosis numbers and reduced CD4+ T-cell counts within granulomas. Peripheral CD4+ T-cell depletion correlated with granulomas that contained fewer CD4+ and CD8+ T cells, less interferon γ, more neutrophils, more interleukin 10 (IL-10), and increased M. tuberculosis numbers. M. tuberculosis numbers correlated positively with IL-10 and interferon α levels and fewer CD4+ and CD8+ T cells. ART reduced IL-10 production.
Conclusions. Peripheral CD4+ T-cell depletion correlated with increased M. tuberculosis presence, increased IL-10 production, and other phenotypic changes within granulomas, demonstrating the HIV infection progressively changes these granulomas.
Keywords: HIV, tuberculosis, granuloma, mycobacterium, coinfection, histology, lymph node, antiretroviral therapy, IL-10
(See the editorial commentary by Canaday and Toossi on pages 1292–3.)
Human immunodeficiency virus type 1 (HIV) infection increases tuberculosis susceptibility [1] to such a great extent that tuberculosis is the leading cause of death of HIV–infected persons [2]. In 2013, an estimated 1.1 million new cases of tuberculosis and more than half (360 000) of all tuberculosis-associated deaths (500 000) occurred in coinfected persons [1]. These HIV-associated deaths and high incidence rates of tuberculosis occur despite the availability of antiretroviral therapy (ART) and tuberculosis preventive therapy. This demonstrates a need to understand better how HIV exacerbates tuberculosis immunopathology.
The reduction of the number of peripheral CD4+ T cells associated with HIV progression correlates with increased tuberculosis susceptibility. However a considerable increase in susceptibility occurs even prior to substantial peripheral CD4+ T-cell depletion and remains high in persons receiving antiretroviral therapy (ART) with no detectable viremia [3], suggesting that depletion of peripheral CD4+ T-cell counts and high viral load are not the only factors involved in increasing tuberculosis susceptibility. HIV–mediated destruction of CD4+ T cells is important to tuberculosis pathology because these cells are necessary for the appropriate response to M. tuberculosis [4, 5]. HIV also leads to a reduction in ex vivo peripheral [6, 7] and airway [8, 9] T-cell cytokine production following M. tuberculosis antigen stimulation. HIV infection has also been shown in vitro to increase the growth of M. tuberculosis in coinfected macrophages [10, 11], but such responses are highly variable [12]. Although these studies demonstrate that HIV causes specific reductions in the immunological responses to M. tuberculosis, very few studies have clearly demonstrated how HIV changes these responses within granulomas [13], the archetypal microscopic hallmark of tuberculosis-diseased tissue. The immunological function and cellular composition of granulomas significantly varies between granulomas [14] and blood or airways [15], demonstrating the need to examine granulomas directly [16].
M. tuberculosis granulomas function as organized immunological barriers that can prevent M. tuberculosis dissemination and growth or act as a reservoir for M. tuberculosis growth [14, 17]. M. tuberculosis granulomas are highly dynamic and organized and are active immunological responses to M. tuberculosis, with a homeostatic balance of necessary and equally important proinflammatory and antiinflammatory responses [14, 18]. Immunological disruptions within this delicate balance, such as CD4+ T-cell [5] and tumor necrosis factor (TNF) neutralization [19], can lead to increased tuberculosis pathology.
Granulomas can form in any tissue but are predominately found in the lungs and lymph nodes (LNs) of coinfected persons [1]. LNs are the primary site for the development of adaptive immunity, and they facilitate the dissemination of extrapulmonary tuberculosis [20], a form of disease that is more frequent in HIV–infected persons [1]. LNs are also primary sites for HIV infection, and their chronic infection by HIV results in significant CD4+ T-cell death, LN dysregulation, and T-cell exhaustion [21]. Understanding the interaction between HIV and M. tuberculosis at this diseased site may help elucidate how HIV increases M. tuberculosis dissemination and tuberculosis susceptibility.
Studies that have examined granulomas in persons with HIV and M. tuberculosis coinfection (hereafter, “coninfected persons”) and those with M. tuberculosis monoinfection are highly variable, and it is difficult to draw firm conclusions about how HIV changes granuloma organization, formation, cellular composition, and M. tuberculosis abundance [13]. The inconsistency of these data partially results from the highly variable and heterogeneous nature of granulomas, a limited number of studies, a low number of persons in the studies, and highly variable and qualitative methods, which make comparisons among multiple studies difficult. Moreover, determining whether HIV causes a disruption in the delicate immunological balance within a granuloma is important in understanding the mechanistic cause of the ability of HIV to increase tuberculosis susceptibility [22].
To address the limited data available focusing on M. tuberculosis granulomas within coinfected persons, we used an unbiased blinded technique to analyze granulomas from excised cervical LNs from both coinfected persons (with a spectrum of peripheral CD4+ T-cell counts and ART statuses) and M. tuberculosis–monoinfected persons. Whole-slide imaging of hematoxylin and eosin, acid-fast bacilli (AFB), and chromogenic staining for HIV p24, CD3, CD4, CD8, CD15, CD68, interferon γ (IFN-γ), IFN-α, TNF, and IL-10 were used to visualize phenotypic differences within all granulomas and the entire LN section. We determined quantitatively and qualitatively how granulomas not only differ between coinfected persons and M. tuberculosis–monoinfected persons, but also how HIV disease progression (characterized by a reduction in the peripheral CD4+ T-cell count) and ART phenotypically changed the site of tuberculosis diseased lymph nodes.
METHODS
Study Approval
This study was performed using excised cervical LN tissue stored within the Department of Anatomical Pathology at Groote Schuur Hospital (Cape Town, South Africa). All biopsy specimens were collected for clinical indications. Residual paraffin-embedded blocks of these specimens were stored for further processing. This study complied with the declaration of Helsinki (2008), and ethics approval was obtained from the University of Cape Town Human Research Ethics Committee (REC187/2013). Informed consent was waived, as this was a retrospective study of FFPE tissue samples collected during the course of routine clinical practice. Patient identifiers were unavailable to investigators.
Patient Selection
The study group comprised persons who had undergone cervical LN biopsy between 2008 and 2013 and subsequently received a diagnosis of tuberculous lymphadenitis or an HIV diagnosis (for the HIV-mono-infected control group). Clinical case notes and pathology results were reviewed for demographic, clinical, pathologic, and microbiologic details for each individual identified. Patients were included if they had a diagnosis of tuberculosis lymphadenitis either via microbiological confirmation or if histologic findings and clinical picture were both consistent with the diagnosis. M. tuberculosis was directly identified within LNs by culture (based on detection of colony-forming units [CFU]), acid-fast bacilli (AFB) staining, or polymerase chain reaction (PCR) in 14 of 15 M. tuberculosis–monoinfected patients, 28 of 29 coinfected patients who were not receiving ART, and 8 of 11 coinfected patients receiving ART. The MGIT-BACTEC system was used to determine colony-forming unit positivity and approximate bacterial load by identifying how many days were needed for positivity [23]. For the 5 patients in this study without microbiological confirmation, the tuberculosis diagnosis was inferred from a positive sputum culture (for 1 patient) or on the basis of histologic findings consistent with tuberculosis (necrotizing and caseous granulomas; for 4 patients). These patients also had other factors supportive of their tuberculosis diagnosis: infiltrate observed on radiography, a mass enlarging over multiple months, ongoing lymphadenopathy and pleural effusion, and successful response to tuberculosis treatment after biopsy.
Patients also had known HIV status; for those with positive test result, a known peripheral CD4+ T-cell count was necessary. Of the HIV-positive patients without tuberculosis, the indication for biopsy was cervical lymphadenopathy; histologic analysis demonstrated reactive change only or no abnormality in 14 of 16 cases, and in 2 cases the LN was collected incidentally as part of surgery for trauma or other indication, with no pathology reported on histologic analysis.
LN Processing
Cervical LN biopsy specimens were fixed in formalin within 1–2 hours after collection. They were then processed and embedded in paraffin wax, using typical protocols (formalin-fixed paraffin-embedded [FFPE] blocks). FFPE tissue blocks were serially sectioned at 4–6-mm thickness.
Immunohistochemistry
The first section from each patient was stained with hematoxylin and eosin (CS701, CS700; Dako, Carpinteria, California), using product instructions. AFB were identified using Ziehl-Neelsen stain (; TB Color modified 100 497; Merck-Millipore, Darmstadt, Germany). The following antibodies were used to stain cells and cytokines: polyclonal rabbit anti-human CD3 (Dako; 1:300 dilution), monoclonal rabbit anti-human CD4 (SP35 clone, dilution 1:50; Cell Marque, Rocklin, California), monoclonal rabbit anti-human CD8 (SP16, 1:50; Cell Marque), mouse monoclonal anti-human CD68 (KP1, 1:1000; Dako), monoclonal mouse anti-human CD15 (LeuM1, 1:50; Abcam), monoclonal mouse anti-human HIVp24 (Kal-1, 1:20; Dako), polyclonal rabbit anti-human IFN-γ (1:150; Abcam, Cambridge, Massachusetts), monoclonal mouse anti-human TNF (52B83, 1:125; Abcam), polyclonal rabbit anti-human IL-10 (1:2000; Abcam), and polyclonal rabbit anti-human IFN-α (1:100; antibodies-online, Atlanta, GA). Appropriate isotypes were used to confirm staining specificity.
Immunohistochemistry followed standard protocols. Sections were deparaffinized in xylene and hydrated in graded EtOH and water. Two antigen-retrieval methods were used for appropriate antibodies: (1) CD3-, CD4-, CD8-, CD68-, and TNF-stained slides used ethylenediaminetetraacetic acid (EDTA) buffer (1 mM EDTA, 0.05% Tween 20, pH 8.0) at 100°C in a pressure cooker for 1.5 minutes; and (2) CD15-, IFN-α–, IL-10–, and IFN-γ–stained slides used citrate-EDTA buffer (10 mM citric acid, 2 mM EDTA, 0.05% Tween 20, pH 6.2) at 95°C–100°C for 20 minutes. After slides cooled, endogenous peroxidases were blocked with 2% H202 in phosphate-buffered saline (PBS; 20 minutes). Antigen sites were blocked using a 1:20 dilution of goat serum in PBS for 2 hours at room temperature. Slides were stained for 12 hours at 4°C. Either horseradish peroxidase–conjugated polyclonal goat anti-mouse or anti-rabbit (Dako) secondary antibodies were used for 20 minutes at room temperature. Chromogenic DAB staining followed for 3 minutes (Liquid DAB+; Dako), followed by incubation with copper sulfate for 5 minutes (Sigma-Aldrich, St Louis, MO) and a hematoxylin counterstain. Slides were then dehydrated and mounted. Olympus VS120 Scanning Microscope (Olympus, Tokyo, Japan) with a 20× objective semiautomatically captured the entire slide area.
Analysis
LN area, granuloma counts, granuloma size(s), granuloma type (caseous, unorganized inflammation, and solid cellular), LN architecture, AFB positivity, and HIV p24 positivity were all manually quantified over the entire tissue section, using Cellsens visualization software (Olympus, Tokyo, Japan). To quantify cellular and cytokine stains, the entire LN image was converted into a series of consecutive 100-MB TIFF images. To reduce bias, each TIFF image was analyzed with unique Cell Profiler (Broad Institute) pipelines to automatically quantify DAB-positive staining by quantifying cell counts (for CD3+, CD4+, and CD8+ T cells) that colocalized with nuclei or the total area stained (for CD15, CD68, TNF, IL-10, IFN-γ, and IFN-α) divided by the total LN section area. The total DAB area stained was quantified because necrotic areas that contained CD15 and CD68 staining were more diffuse and antibodies often stained areas without nuclei.
Individual CellProfiler pipelines were created for each antibody used with DAB staining. Each TIFF image was resized by a factor 0.5 to conserve processing power. Individual colors (DAB and hematoxylin) were then unmixed. Identification of primary objects (DAB or hematoxylin) was determined by pixel units, global threshold strategy, and Otsu thresholding methods. DAB coverage was determined for all markers, and colocalization of nuclei and DAB staining in CD3+, CD4+, and CD8+ T cells was quantified. The accuracy of each pipeline was confirmed with manual quantification.
Statistical Analysis
Nonparametric Kruskal–Wallis, Mann–Whitney, or χ2 tests (with significance set at P < .05) were used to compare multiple groups or just 2 groups, respectively. Linear regression analysis was used to determine correlations in staining coverage. All statistics were conducted in GraphPad Prism v6.0 (La Jolla, California).
RESULTS
Patient Groups
Patients were organized into 4 groups: HIV monoinfected (n = 16; median age, 34 years [range, 23–70 years]; 56% female), M. tuberculosis monoinfected (n = 15; median age, 30 years [range, 18–68 years]; 53% female), coinfected without ART (n = 29; median age, 30 years [range, 16–48 years]; 68% female), and coinfected with ART (n = 11; 29 years [age, 25–48 years]; 62% female). Median peripheral CD4+ T-cell counts were obtained for all HIV infected persons, with values of 331 cells/μL of blood (range, 84–647 cells/μL of blood) in the HIV–monoinfected group, 145 cells/μL of blood (range, 11–591 cells/μL of blood) in the coinfected group without ART, and 204 cells/μL of blood (range, 29–347 cells/μL of blood) in the coinfected group with ART.
Gross Pathology of Granulomas
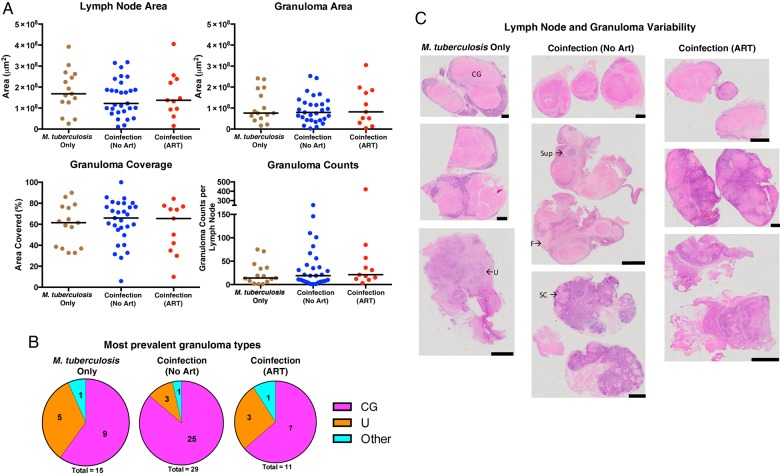
Biopsied LNs from persons with M. tuberculosis or HIV monoinfection or with coinfection, with or without ART, were analyzed for differences in pathology. Excised LNs from coinfected persons were not significantly different in cross-sectional area and did not contain differences in granuloma area, coverage, or counts (Figure 1A). When the type of granuloma was analyzed (necrotic, nonnecrotic, or unorganized inflammation), there were no significant differences between groups (P = .327 by χ2 analysis; Figure 1B). The extensive infiltration of these LNs with granulomas (Figure 1C) resulted in distortion of the normal LN architecture in most sections; as a result, it was not possible to determine whether HIV coinfection changes the normal features of LNs (such as germinal centers, interstitial space, and capsule).
Figure 1.
Persons coinfected with Mycobacterium tuberculosis and human immunodeficiency virus type 1 (HIV) do not have differences in lymph node size or granuloma area, counts, and type, compared with M. tuberculosis–monoinfected persons. A, No significant differences were observed in total cross-sectional areas of the excised lymph nodes and granulomas, percentage of lymph nodes covered in granulomas, or granuloma counts between M. tuberculosis–monoinfected persons and individuals coinfected with M. tuberculosis and HIV (who were or were not receiving antiretroviral therapy [ART]). B, The percentage of lymph nodes that contained the largest granulomas or unorganized inflammation within each infection group are displayed in each pie chart. C, Hematoxylin-eosin–stained slides demonstrating the heterogeneous nature of excised lymph nodes and their granulomas (black scale bar, 2 mm). A few granulomas and inflamed areas are labeled to demonstrate the high variability in granuloma types within individual lymph nodes. “Other” denotes suppurative (Sup), solid cellular (SC), and fibrotic (F) granulomas. CG, caseous granuloma; U, unorganized inflammation.
Coinfection Increases Bacterial Load Within LNs
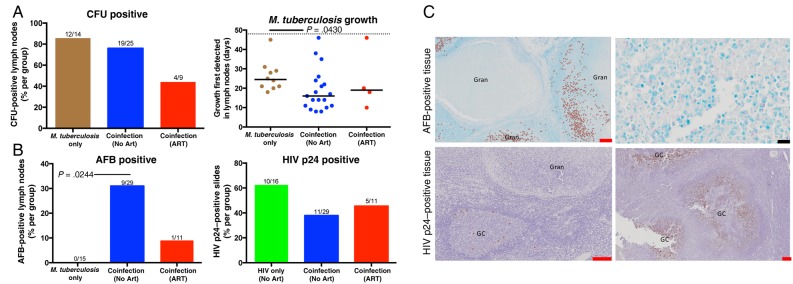
When excised LNs were cultured for M. tuberculosis, no difference was observed between the groups in the rate of CFU positivity (Figure 2A). However, M. tuberculosis growth was observed after fewer days of culture in LNs from coinfected persons without ART, suggesting that those tissues had a higher bacterial burden than their counterparts [23]. Ziehl-Neelsen staining, which appeared to require a higher threshold of bacilli to be observed than CFUs, was also performed to identify M. tuberculosis presence. If at least 1 bacillus was located within the entire LN section, the sample was considered AFB positive. A greater proportion of LNs from coinfected persons without ART contained AFB (30% [9 of 29]), compared with LNs excised from M. tuberculosis–monoinfected persons (0% [0 of 15]) and coinfected persons receiving ART (9% [1 of 11]; Figure 2B). LNs from coinfected persons were just as likely to contain HIV p24 (11 of 29), irrespective of ART status (5 of 11; Figure 2A). One person receiving ART had an HIV p24–positive LN, despite having suppressed plasma viral loads. These data suggest that HIV increases the bacterial load within granulomas.
Figure 2.
Lymph nodes from persons coinfected with Mycobacterium tuberculosis and human immunodeficiency virus type 1 (HIV) were more likely to contain higher bacterial loads, compared with M. tuberculosis–monoinfected persons. A, No difference in lymph node M. tuberculosis culture findings (ie, colony-forming units [CFU]) were observed among the 3 groups. Fractions above bars indicate positive lymph nodes over total lymph nodes (not all lymph nodes were cultured). Days to culture positivity (determined by the BACTEC MGIT system) was lowest within lymph nodes isolated from the coinfected recipients who were not receiving antiretroviral therapy (ART). The dotted line represents the culture-negative time limit (49 days). B, HIV was associated with an increased presence of acid-fast bacilli (AFB) that was not significantly reduced in the presence of ART. No AFB were observed in lymph nodes from HIV-uninfected persons. M. tuberculosis did not change the prevalence of HIV p24 among lymph nodes. C, AFB and HIV p24 staining within lymph nodes. AFB and HIV p24 are flagged in left panels. Significance was determined by the Kruskal–Wallis test with the Dunn multiple comparisons post hoc test (P = .05). Red and black scale bars represent 200 µM and 2 µM, respectively. GC, germinal center; Gran, granuloma.
To determine where M. tuberculosis bacilli and HIV localize within infected LNs, we correlated AFB and HIV p24 presence with germinal centers or granulomas. Contrary to multiple models of granuloma formation [24, 25], M. tuberculosis primarily resided within the macrophage layer of granulomas and not within the caseum (Figure 2C). HIV p24 preferentially localized within germinal centers and not granulomas (Figure 2C), suggesting that minimal HIV replication was occurring within the granulomas. A qualitative observation suggests that the effect of HIV and M. tuberculosis on each other appear to be remote and not local because only 4 LN sections stained positive for both AFB and HIV p24.
Coinfection Reduced Both CD4+ T-Cell Counts and CD4+/CD8+ T-Cell Count Ratios Within Excised Tissue That Were Partially Ameliorated by ART
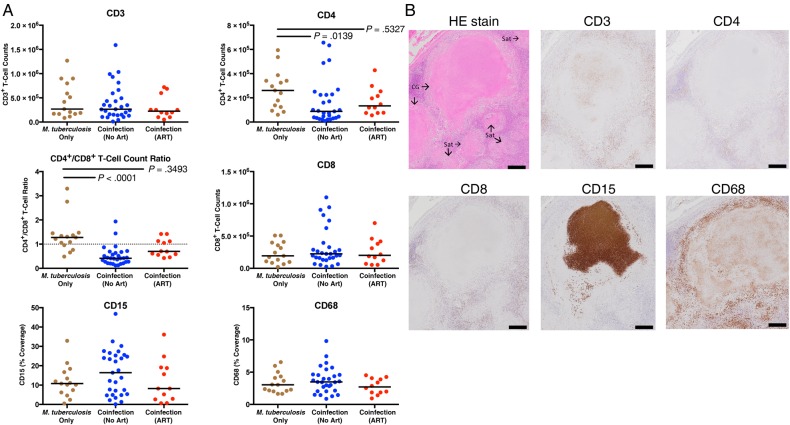
To determine the effect of coinfection on the cellular response within granulomas, we next investigated the numbers of CD3+, CD4+, and CD8+ T cells, monocytes (CD68 coverage), and neutrophils (CD15 coverage). Granulomas from coinfected persons contained significantly fewer CD4+ T cells, as well as a reduced CD4+/CD8+ T-cell count ratio, compared with HIV–uninfected persons (Figure 3A). This effect of low CD4+ T-cell count reduction in the group of samples from coinfected patients was partially restored in the group of ART recipients (Figure 3A). Moreover, coinfection did not affect CD3+ or CD8+ T-cell counts or CD15 and CD68 coverage within LNs. Although peripheral CD4+ T-cell counts were significantly lower (P = .03) they were, albeit weakly (R2 = 0.1515), correlated with granuloma CD4+ T-cell counts in ART-naive persons. This correlation was not significant when considering coinfected persons receiving ART (R2 = 0.08, P = .5328).
Figure 3.
Antiretroviral therapy (ART) partially restores the reduction of CD4+ T cells and CD4+/CD8+ T-cell count ratio observed within tuberculosis-diseased lymph nodes from persons coinfected with Mycobacterium tuberculosis and human immunodeficiency virus type 1 (HIV). A, HIV reduces CD4+ T-cell counts and CD4+/CD8+ T-cell count ratios, compared with M. tuberculosis–monoinfected persons. No significant reduction was observed in coinfected patients receiving ART. The Kruskal–Wallis test and Dunn multiple comparisons post hoc test were used to determine significance. Adjusted P values are displayed. B, Hematoxylin-eosin (HE) or cellular staining in consecutive lymph node sections that contain caseous granulomas (CG) with satellite solid cellular granulomas (Sat; black scale bar, 100 µm). CD3, CD4, and CD8 staining predominately occurred within lymphocyte layer of granulomas. Interestingly, circular CD3 staining occurred occasionally, within the center of caseous granulomas without associated nuclei. CD15 was most often localized within caseous centers, without nuclei, and sporadically within macrophage layer of granulomas. CD68 staining was within caseous granulomas without associating with nuclei and was most frequently present in the macrophage layer of granulomas.
Cellular and Cytokine Organization Within Granulomas
To further investigate the effect of coinfection on the cellular response in LNs, we next investigated the distribution of the cell types and their association with the cytokines IFN-γ, IFN-α, TNF, and IL-10. Neutrophil (CD15) staining was predominant within the center of caseous granulomas (Figure 3B). Macrophage (CD68) staining was also prevalent within caseous granulomas but frequently appeared in a pattern surrounding dense neutrophil staining (Figure 3B). CD3+, CD8+, and CD4+ T cells were evenly distributed within the lymphocyte layer of the granulomas in each group.
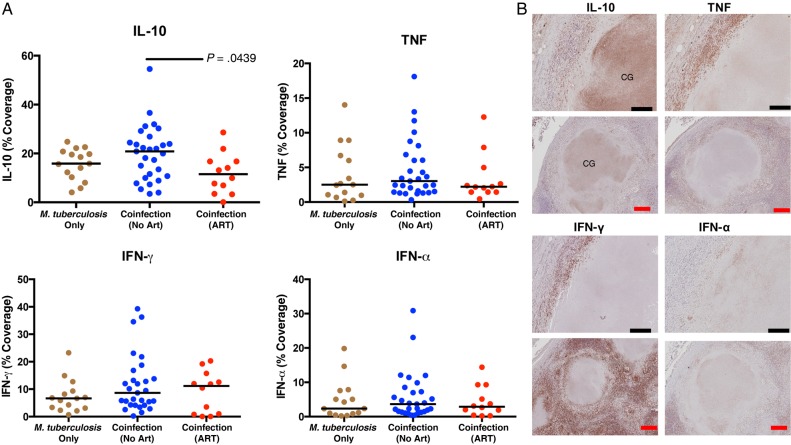
IFN-γ and TNF preferentially localized within the macrophage layer within granulomas. Multinucleated giant cells were more likely to contain IFN-α or TNF than IFN-γ or IL-10. HIV coinfection did not change IL-10, IFN-α, TNF, or IFN-γ presence within excised LNs (Figure 4A). However, ART status significantly reduced the IL-10 presence within LNs, compared with ART-naive coinfected persons (Figure 4A). IL-10 had the highest median percentage coverage of all cytokines investigated (Figure 4A) and was most often localized within caseous granulomas (Figure 4B). Total IL-10 coverage directly correlated with neutrophil influx within caseous granulomas, with HIV coinfection associated with a small reduction in this correlation (M. tuberculosis–monoinfected persons, R2 = 0.6936, P = .0001; coinfected persons, R2 = 0.3906, P = .0004).
Figure 4.
Antiretroviral therapy (ART) reduces interleukin 10 (IL-10) presence within tuberculosis-diseased lymph nodes. A, Percentage of lymph node sections covered by cytokines are represented. Human immunodeficiency virus type 1 (HIV) coinfection did not change IL-10 presence in lymph nodes, compared with Mycobacterium tuberculosis monoinfection. ART significantly reduced IL-10 presence in persons coinfected with M. tuberculosis and HIV. HIV did not change tumor necrosis factor (TNF), interferon γ (IFN-γ), or interferon α (IFN-α) presence in these tissues. The Kruskal–Wallis test and Dunn multiple comparisons post hoc test were used to determine significance. Adjusted P values are displayed. B, Cytokine staining in consecutive lymph node sections that contain caseous granulomas (CGs; black scale bar, 20 µm; red scale bar, 100 µM). Staining revealed that IL-10 was most often present in the center of caseous granulomas. TNF and IFN-γ were predominately identified in macrophage and lymphocyte layer. IFN-α most often localized within macrophage layer.
In Advanced HIV Infection, Granulomas Contain Fewer CD4+ and CD3+ T Cells, Lower CD4+/CD8+ T-Cell Count Ratios, and Increased Neutrophil, IL-10, and M. tuberculosis Presence
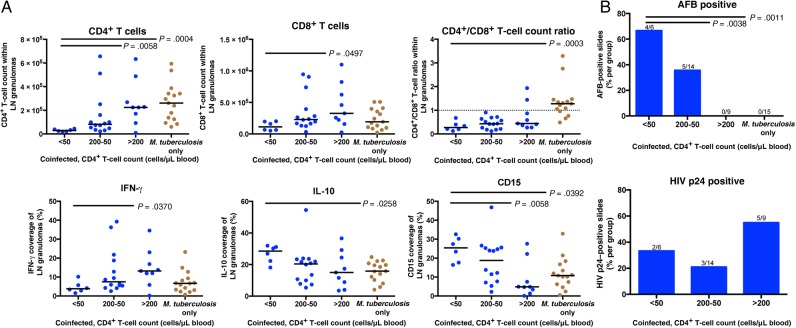
To determine how granulomas changed as HIV immunodeficiency advanced, tissue from patients with varying peripheral CD4+ T-cell counts (>200, 200–50, <50 cells/µL of blood) were examined. Granuloma composition and bacilli presence varied significantly (Figure 5). Coinfected persons with <50 peripheral CD4+ T cells/µL of blood showed significantly lower granuloma CD4+ T-cell counts than in M. tuberculosis–monoinfected persons or those with >200 peripheral CD4+ T cells/µL of blood (Figure 5A). Severely depleted peripheral CD4+ T-cell counts also correlated with reduced CD4+/CD8+ T-cell count ratios, compared with the M. tuberculosis–monoinfected group (Figure 5A). Granulomas from coinfected persons with <50 peripheral CD4+ T cells/µL of blood contained less IFN-γ and CD8+ T cells than coinfected persons with >200 peripheral CD4+ T cells/µL of blood (Figure 5A). LNs from persons with <50 peripheral CD4+ T cells/µL of blood contained significantly more CD15 and IL-10 than M. tuberculosis–monoinfected and coinfected persons with >200 peripheral CD4+ T cells/µL of blood. As peripheral CD4+ T cell counts decreased, M. tuberculosis presence within granulomas increased (Figure 5B). Granulomas from persons with >200 peripheral CD4+ T cells/µL of blood were more likely to contain HIV p24 than persons with more-depleted peripheral CD4+ T cell counts (Figure 5B).
Figure 5.
As human immunodeficiency virus type 1 (HIV) infection progresses, tuberculosis-diseased tissue contain fewer CD4+ T cells and lower CD4+/CD8+ T-cell count ratios, along with increased acid-fast bacilli (AFB), neutrophil, and IL-10 presence. A, Lymph nodes from persons who were coinfected with M. tuberculosis and HIV, not receiving ART, and <50 peripheral CD4+ T cells/µL of blood contain fewer CD4+ T cells, lower CD4+/CD8+ T-cell count ratios, and more IL-10 and CD15 than lymph nodes from M. tuberculosis–monoinfected persons. Lymph nodes from persons with <50 peripheral CD4+ T cells contain fewer CD4+ and CD8+ T cells along with less interferon γ (IFN-γ), compared with lymph nodes from coinfected persons with >200 peripheral CD4+ T cells/µL of blood. The Kruskal–Wallis test and Dunn multiple comparisons post hoc test were used to determine the significance of differences from persons with <50 peripheral CD4+ T cells/μL of blood. B, Lymph nodes from coinfected persons who were not receiving ART and had fewer peripheral CD4+ T cells were more likely to be positive for AFB than coinfected patients with >200 peripheral CD4+ T cells/µL of blood and those with M. tuberculosis monoinfection. Fractions above bars indicate positive lymph nodes over total lymph nodes. Significance was determined by Kruskal–Wallis test with the Dunn multiple comparisons post hoc test (P = .05). Adjusted P values are displayed.
M. tuberculosis Presence Correlates With Fewer CD4+ and CD8+ T Cells and More IL-10 and IFN-α
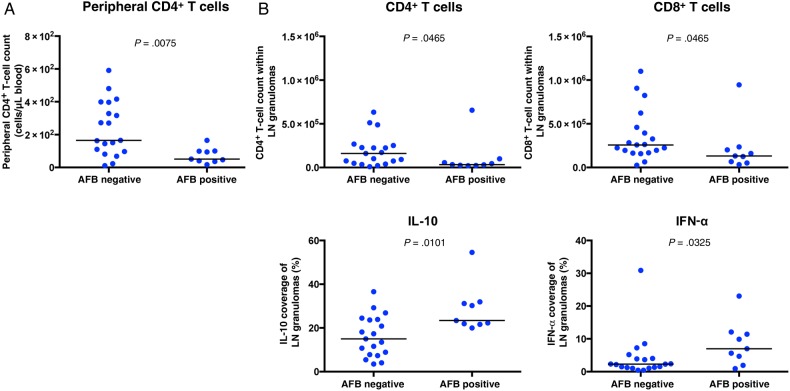
To identify correlates of M. tuberculosis presence within granulomas, we quantified cellular and cytokine presence in AFB-positive and AFB-negative sections. AFB-positive sections were more likely to occur within persons with depleted peripheral CD4+ T cell counts (Figure 6A). AFB-positive tissue contained fewer CD4+ and CD8+ T cells than AFB- tissue (Figure 6B) and were more likely to contain more IL-10 and IFN-α (Figure 6B).
Figure 6.
Acid-fast bacilli (AFB)–positive granulomas contained fewer CD4+ and CD8+ T cells along with increased interleukin 10 (IL-10) and interferon α (IFN-α) levels, compared with AFB-negative granulomas. A, Peripheral CD4+ T-cell counts were lower in coinfected persons with AFB-positive lymph node sections, compared with those with AFB-negative sections. B, AFB-positive lymph node sections contained fewer CD4+ and CD8+ T cells along with more IL-10 and IFN-α. No difference was observed in the expression of CD3, CD15, CD68, IFN-γ, or tumor necrosis factor (TNF) between AFB-positive and AFB-negative granulomas. The Mann–Whitney test was used to determine significance (P = .05).
DISCUSSION
If disruption within granulomas leads to M. tuberculosis reactivation [26] and if increases in bacterial growth within granulomas is associated with active tuberculosis [14, 27], it is likely that the ability of HIV to increase M. tuberculosis presence within granulomas may lead to increased tuberculosis pathology. To this end, we examined the microenvironment of granulomas from coinfected and M. tuberculosis–monoinfected persons to determine how HIV increases M. tuberculosis presence within granulomas.
M. tuberculosis growth restriction is the primary objective of granuloma function, so it was striking that the only observed AFB-positive LN sections and the higher bacterial burdens were from coinfected persons. Since there was no difference observed in cultured M. tuberculosis from LNs of each group but a higher bacterial load, HIV might not increase M. tuberculosis presence, but it does increase M. tuberculosis growth. Similarly, granulomas from coinfected persons tend to contain more bacilli than those from HIV–uninfected persons [28–30]. These granulomas were also more likely to contain fewer CD4+ T cells and lower CD4+/CD8+ T-cell count ratios. This increase in AFB positivity indirectly correlated with peripheral CD4+ T-cell count and the depletion of granulomatous CD4+ T cells, demonstrating that, as HIV infection clinically progresses, the likelihood of M. tuberculosis growth also increases [28, 30]. The ability of ART to ameliorate the loss of CD4+ T cells within granulomas may be why this therapy reduced tuberculosis incidence across persons with a wide spectrum of peripheral CD4+ T-cell counts [31].
As HIV infection advances, granulomas undergo phenotypic change. Within persons with <50 peripheral CD4+ T cells/µL of blood, a significant reduction in granulomatous CD4+ and CD8+ T cells, reduced IFN-γ production, and increased M. tuberculosis abundance were observed. The reduction of CD4+ and CD8+ T cells and IFN-γ production within granulomas may directly lead to increased M. tuberculosis abundance because of their well-established role in killing M. tuberculosis (reviewed in [32]).
CD4+ T cells have been identified as the primary site for HIV replication within granulomas [33]. It is hypothesized that HIV replication readily occurs within granulomas, owing to their high composition of activated CD4+ T cells and macrophages [22, 34]. However, HIV presence within LNs occurred more often within germinal centers than in granulomas, which may have resulted from a higher concentration of HIV–infectable cells. This suggests that granulomas may not be ideal sites for HIV replication.
The significant neutrophil debris staining within caseum, especially within peripheral CD4+ T-cell–depleted persons, suggests that neutrophils are actively migrating into granulomas. Neutrophil presence within granulomas increases inflammation and is associated with active tuberculosis [35, 36]. We hypothesize that this influx of neutrophils (a proinflammatory response) in LNs of patients with <50 peripheral CD4+ T cells/μL of blood ultimately led to the increased production of IL-10 (an antiinflammatory response), since their presence was positively correlated within caseous granulomas. The increase in M. tuberculosis numbers that was associated with IL-10 may also result from its ability to inhibit IFN-γ–induced macrophage killing of M. tuberculosis [37], and it can reduce M. tuberculosis–specific T-cell proliferation in humans [38].
Similar to IL-10, IFN-α was more likely to be present in AFB-positive granulomas. Because IL-10 can inhibit IFN-α production [39], and IFN-α can induce IL-10 production to reduce the ability to restrict M. tuberculosis growth [40], we hypothesize that the presence of IFN-α and IL-10 within granulomas may lead to an increase in M. tuberculosis growth [14].
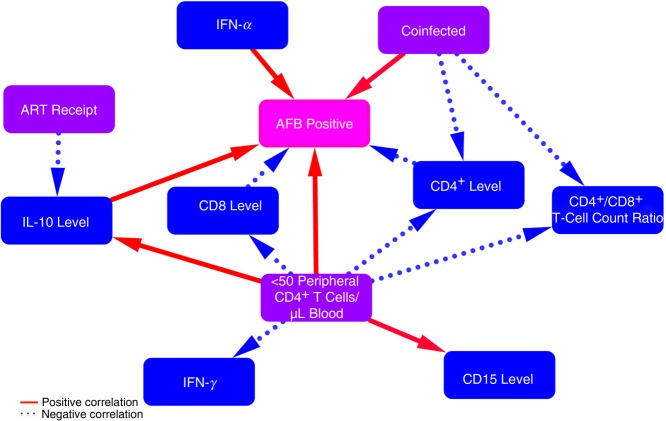
To understand what was occurring within the granulomas, we elucidated a correlation network of multiple phenotypic changes within these granulomas (Figure 7). Although a limitation of immunohistochemistry is the inability to differentiate cause and effect, it provides an opportunity to develop these hypotheses and build support with in vitro and ex vivo evidence. We hypothesize that HIV directly kills CD4+ T cells within granulomas and that this worsens as HIV disease progresses. Initially, HIV replication increases prior to severe peripheral CD4+ T-cell loss, which leads to an increase in CD8+ T-cell counts and IFN-γ production. As peripheral CD4+ T cells continue to deplete, neutrophil recruitment intensifies, followed by the production of IL-10 and IFN-α, which leads to further suppression of T-cell function [41] and M. tuberculosis growth. The ability of ART to restore the CD4+ T-cell count and reduce IL-10 production within granulomas of coinfected persons may indirectly lead to reduced M. tuberculosis growth. Furthering our understanding of how HIV and ART change M. tuberculosis granulomas will help elucidate the unknown factors that HIV exploits to increase M. tuberculosis susceptibility and tuberculosis pathology.
Figure 7.
Proposed network of how human immunodeficiency virus type 1 (HIV) and treatment status change phenotypic interactions within Mycobacterium tuberculosis granulomas. Red solid and blue dotted lines represent positive and negative correlations, respectively, between phenotypic changes within granulomas (blue and pink boxes) and clinical descriptions of persons (purple boxes). Arrows represent our hypotheses as to the cause of the phenotypic changes. Coinfection increases acid-fast bacilli (AFB) presence and reduces CD4+ T-cell counts within granulomas. As HIV infection progresses (to <50 peripheral CD4+ T cells/μL of blood), granulomas contain less CD4, CD8, and interferon γ (IFN-γ) and more CD15 and interleukin 10 (IL-10), which lead to increased M. tuberculosis growth. IL-10 and IFN-α lead to more M. tuberculosis growth within granulomas. Antiretroviral therapy (ART) receipt reduces IL-10 presence.
Notes
Acknowledgments. We thank Jurgen Geitner for his help with image acquisition.
Disclaimer. The funders of this work had no role in study design, data collection, data analysis, data interpretation, or writing of the report.
Financial support. This work was supported by the European Community's Seventh Framework Program (FP7- HEALTH-F3-2012-305578), the Wellcome Trust (awards 084323 and 104803; award 098316 to G. M.), the Claude Leon Foundation (awarded to CRD), the Research Councils (UK) via the Francis Crick Institute (10218 to R. J. W.) and the National Research Foundation of South Africa (award 96841 to R. J. W.), the South African Medical Research Council (to G. M. via the T. B. and HIV Collaborating Centres Programme), and the South African Research Chairs Initiative of the Department of Science and Technology and National Research Foundation of South Africa (grant 64787 to G. M.).
Potential conflicts of interest. All authors: No reported conflicts. All authors have submitted the ICMJE Form for Disclosure of Potential Conflicts of Interest. Conflicts that the editors consider relevant to the content of the manuscript have been disclosed.
References
- 1.World Health Organization. Global tuberculosis report 2014. Geneva: World Health Organization, 2015. [Google Scholar]
- 2.World Health Organization. Consolidated strategic information guidelines for HIV in the health sector. Geneva: World Health Organization, 2015. [PubMed] [Google Scholar]
- 3.Lawn SD, Myer L, Edwards D, Bekker L-G, Wood R. Short-term and long-term risk of tuberculosis associated with CD4 cell recovery during antiretroviral therapy in South Africa. AIDS 2009; 23:1717–25. [DOI] [PMC free article] [PubMed] [Google Scholar]
- 4.Caruso AM, Serbina N, Klein E, Triebold K, Bloom BR, Flynn JL. Mice deficient in CD4 T cells have only transiently diminished levels of IFN-gamma, yet succumb to tuberculosis. J Immunol 1999; 162:5407–16. [PubMed] [Google Scholar]
- 5.Lin PL, Rutledge T, Green AM et al. CD4 T cell depletion exacerbates acute Mycobacterium tuberculosis while reactivation of latent infection is dependent on severity of tissue depletion in cynomolgus macaques. AIDS Res Hum Retroviruses 2012; 28:1693–702. [DOI] [PMC free article] [PubMed] [Google Scholar]
- 6.Geldmacher C, Schuetz A, Ngwenyama N et al. Early depletion of Mycobacterium tuberculosis-specific T helper 1 cell responses after HIV-1 infection. J Infect Dis 2008; 198:1590–8. [DOI] [PMC free article] [PubMed] [Google Scholar]
- 7.Kalokhe AS, Adekambi T, Ibegbu CC, Ray SM, Day CL, Rengarajan J. Impaired Degranulation and Proliferative Capacity of Mycobacterium tuberculosis-Specific CD8+ T Cells in HIV-Infected Individuals With Latent Tuberculosis. J Infect Dis 2015; 211:635–40. [DOI] [PMC free article] [PubMed] [Google Scholar]
- 8.Kalsdorf B, Scriba TJ, Wood K et al. HIV-1 infection impairs the bronchoalveolar T-cell response to mycobacteria. Am J Respir Crit Care Med 2009; 180:1262–70. [DOI] [PMC free article] [PubMed] [Google Scholar]
- 9.Jambo KC, Banda DH, Afran L et al. Asymptomatic HIV-infected individuals on antiretroviral therapy exhibit impaired lung CD4(+) T-cell responses to mycobacteria. Am J Respir Crit Care Med 2014; 190:938–47. [DOI] [PMC free article] [PubMed] [Google Scholar]
- 10.Patel NR, Swan K, Li X, Tachado SD, Koziel H. Impaired M. tuberculosis-mediated apoptosis in alveolar macrophages from HIV+ persons: potential role of IL-10 and BCL-3. J Leukoc Biol 2009; 86:53–60. [DOI] [PMC free article] [PubMed] [Google Scholar]
- 11.Pathak S, Wentzel-Larsen T, Asjö B. Effects of in vitro HIV-1 infection on mycobacterial growth in peripheral blood monocyte-derived macrophages. Infect Immun 2010; 78:4022–32. [DOI] [PMC free article] [PubMed] [Google Scholar]
- 12.Day RB, Wang Y, Knox KS, Pasula R, Martin WJ, Twigg HL. Alveolar macrophages from HIV-infected subjects are resistant to Mycobacterium tuberculosis in vitro. Am J Respir Cell Mol Biol 2004; 30:403–10. [DOI] [PubMed] [Google Scholar]
- 13.Diedrich CR, O'Hern J, Wilkinson RJ. HIV-1 and the Mycobacterium tuberculosis granuloma: A systematic review and meta-analysis. Tuberculosis 2016; 98:62–76. [DOI] [PubMed] [Google Scholar]
- 14.Gideon HP, Phuah J, Myers AJ et al. Variability in tuberculosis granuloma T cell responses exists, but a balance of pro- and anti-inflammatory cytokines is associated with sterilization. PLoS Pathog 2015; 11:e1004603. [DOI] [PMC free article] [PubMed] [Google Scholar]
- 15.Mattila JT, Diedrich CR, Lin PL, Phuah J, Flynn JL. Simian immunodeficiency virus-induced changes in T cell cytokine responses in cynomolgus macaques with latent Mycobacterium tuberculosis infection are associated with timing of reactivation. J Immunol 2011; 186:3527–37. [DOI] [PMC free article] [PubMed] [Google Scholar]
- 16.Brighenti S, Andersson J. Local immune responses in human tuberculosis: learning from the site of infection. J Infect Dis 2012; 205(suppl 2):S316–24. [DOI] [PubMed] [Google Scholar]
- 17.Ehlers S, Schaible UE. The granuloma in tuberculosis: dynamics of a host-pathogen collusion. Front Immunol 2012; 3:411. [DOI] [PMC free article] [PubMed] [Google Scholar]
- 18.Flynn JL, Chan J, Lin PL. Macrophages and control of granulomatous inflammation in tuberculosis. Mucosal Immunol 2011; 4:271–8. [DOI] [PMC free article] [PubMed] [Google Scholar]
- 19.Lin PL, Myers A, Smith L et al. Tumor necrosis factor neutralization results in disseminated disease in acute and latent Mycobacterium tuberculosis infection with normal granuloma structure in a cynomolgus macaque model. Arthritis Rheum 2010; 62:340–50. [DOI] [PMC free article] [PubMed] [Google Scholar]
- 20.Behr MA, Waters WR. Is tuberculosis a lymphatic disease with a pulmonary portal? Lancet Infect Dis 2014; 14:250–5. [DOI] [PubMed] [Google Scholar]
- 21.Estes JD. Pathobiology of HIV/SIV-associated changes in secondary lymphoid tissues. Immunol Rev 2013; 254:65–77. [DOI] [PMC free article] [PubMed] [Google Scholar]
- 22.Diedrich CR, Flynn JL. HIV-1/mycobacterium tuberculosis coinfection immunology: how does HIV-1 exacerbate tuberculosis? Infect Immun 2011; 79:1407–17. [DOI] [PMC free article] [PubMed] [Google Scholar]
- 23.Bark CM, Okwera A, Joloba ML et al. Time to detection of Mycobacterium tuberculosis as an alternative to quantitative cultures. Tuberculosis 2011; 91:257–9. [DOI] [PMC free article] [PubMed] [Google Scholar]
- 24.Cambier CJ, Falkow S, Ramakrishnan L. Host evasion and exploitation schemes of Mycobacterium tuberculosis. Cell 2014; 159:1497–509. [DOI] [PubMed] [Google Scholar]
- 25.Silva Miranda M, Breiman A, Allain S, Deknuydt F, Altare F. The Tuberculous Granuloma: An Unsuccessful Host Defence Mechanism Providing a Safety Shelter for the Bacteria? Clin Dev Immunol 2012; 2012:1–14. [DOI] [PMC free article] [PubMed] [Google Scholar]
- 26.Coleman MT, Chen RY, Lee M et al. PET/CT imaging reveals a therapeutic response to oxazolidinones in macaques and humans with tuberculosis. Sci Transl Med 2014; 6:265ra167. [DOI] [PMC free article] [PubMed] [Google Scholar]
- 27.Lin PL, Ford CB, Coleman MT et al. Sterilization of granulomas is common in active and latent tuberculosis despite within-host variability in bacterial killing. Nat Med 2014; 20:75–9. [DOI] [PMC free article] [PubMed] [Google Scholar]
- 28.Heyderman RS, Makunike R, Muza T et al. Pleural tuberculosis in Harare, Zimbabwe: the relationship between human immunodeficiency virus, CD4 lymphocyte count, granuloma formation and disseminated disease. Am J Trop Med Hyg 1998; 3:14–20. [DOI] [PubMed] [Google Scholar]
- 29.Ngilimana PJ, Metz T, Munyantore S, Mureganshuro JM, Noel H, Roels H. [Lymph node tuberculosis in HIV-1 seropositive patients in Central Africa. A characteristic histopathologic picture]. Ann Pathol 1995; 15:38–44. [PubMed] [Google Scholar]
- 30.Di Perri G, Cazzadori A, Vento S et al. Comparative histopathological study of pulmonary tuberculosis in human immunodeficiency virus-infected and non-infected patients. Tuber Lung Dis 1996; 77:244–9. [DOI] [PubMed] [Google Scholar]
- 31.Suthar AB, Lawn SD, del Amo J et al. Antiretroviral therapy for prevention of tuberculosis in adults with HIV: a systematic review and meta-analysis. PLoS Med 2012; 9:e1001270. [DOI] [PMC free article] [PubMed] [Google Scholar]
- 32.Jasenosky LD, Scriba TJ, Hanekom WA, Goldfeld AE. T cells and adaptive immunity to Mycobacterium tuberculosis in humans. Immunol Rev 2015; 264:74–87. [DOI] [PubMed] [Google Scholar]
- 33.van der Ende ME, Schutten M, Raschdorff B et al. CD4 T cells remain the major source of HIV-1 during end stage disease. Aids 1999; 13:1015–9. [DOI] [PubMed] [Google Scholar]
- 34.Lawn SD, Butera ST, Shinnick TM. Tuberculosis unleashed: the impact of human immunodeficiency virus infection on the host granulomatous response to Mycobacterium tuberculosis. Microbes Infect 2002; 4:635–46. [DOI] [PubMed] [Google Scholar]
- 35.Gopal R, Monin L, Torres D et al. S100A8/A9 proteins mediate neutrophilic inflammation and lung pathology during tuberculosis. Am J Respir Crit Care Med 2013; 188:1137–46. [DOI] [PMC free article] [PubMed] [Google Scholar]
- 36.Niazi MKK, Dhulekar N, Schmidt D et al. Lung necrosis and neutrophils reflect common pathways of susceptibility to Mycobacterium tuberculosis in genetically diverse, immune competent mice. Dis Mod Mech 2015; 8:1141–53. [DOI] [PMC free article] [PubMed] [Google Scholar]
- 37.Fietta A, Meloni F, Francioli C et al. Virulence of Mycobacterium tuberculosis affects interleukin-8, monocyte chemoattractant protein-1 and interleukin-10 production by human mononuclear phagocytes. Int J Tissue React 2001; 23:113–25. [PubMed] [Google Scholar]
- 38.Boussiotis VA, Tsai EY, Yunis EJ et al. IL-10-producing T cells suppress immune responses in anergic tuberculosis patients. J Clin Invest 2000; 105:1317–25. [DOI] [PMC free article] [PubMed] [Google Scholar]
- 39.Ito S, Ansari P, Sakatsume M et al. Interleukin-10 inhibits expression of both interferon alpha- and interferon gamma- induced genes by suppressing tyrosine phosphorylation of STAT1. Blood 1999; 93:1456–63. [PubMed] [Google Scholar]
- 40.McNab FW, Ewbank J, Howes A et al. Type I IFN induces IL-10 production in an IL-27-independent manner and blocks responsiveness to IFN-γ for production of IL-12 and bacterial killing in Mycobacterium tuberculosis-infected macrophages. J Immunol 2014; 193:3600–12. [DOI] [PMC free article] [PubMed] [Google Scholar]
- 41.Bowers NL, Helton ES, Huijbregts RPH, Goepfert PA, Heath SL, Hel Z. Immune suppression by neutrophils in HIV-1 infection: role of PD-L1/PD-1 pathway. PLoS Pathog 2014; 10:e1003993. [DOI] [PMC free article] [PubMed] [Google Scholar]


