

Abstract
Background. Diagnosis of human immunodeficiency virus (HIV) infection during early infancy (commonly known as “early infant HIV diagnosis” [EID]) followed by prompt initiation of antiretroviral therapy dramatically reduces mortality. EID testing is recommended at 6 weeks of age, but many infant infections are missed.
Design/Methods. We simulated 4 EID testing strategies for HIV-exposed infants in South Africa: no EID (diagnosis only after illness; hereafter, “no EID”), testing once (at birth alone or at 6 weeks of age alone; hereafter, “birth alone” and “6 weeks alone,” respectively), and testing twice (at birth and 6 weeks of age; hereafter “birth and 6 weeks”). We calculated incremental cost-effectiveness ratios (ICERs), using discounted costs and life expectancies for all HIV-exposed (infected and uninfected) infants.
Results. In the base case (guideline-concordant care), the no EID strategy produced a life expectancy of 21.1 years (in the HIV-infected group) and 61.1 years (in the HIV-exposed group); lifetime cost averaged $1430/HIV-exposed infant. The birth and 6 weeks strategy maximized life expectancy (26.5 years in the HIV-infected group and 61.4 years in the HIV-exposed group), costing $1840/infant tested. The ICER of the 6 weeks alone strategy versus the no EID strategy was $1250/year of life saved (19% of South Africa's per capita gross domestic product); the ICER for the birth and 6 weeks strategy versus the 6 weeks alone strategy was $2900/year of life saved (45% of South Africa's per capita gross domestic product). Increasing the proportion of caregivers who receive test results and the linkage of HIV-positive infants to antiretroviral therapy with the 6 weeks alone strategy improved survival more than adding a second test.
Conclusions. EID at birth and 6 weeks improves outcomes and is cost-effective, compared with EID at 6 weeks alone. If scale-up costs are comparable, programs should add birth testing after strengthening 6-week testing programs.
Keywords: human immunodeficiency virus, early infant HIV diagnosis, birth testing, nucleic acid test, cost-effectiveness
(See the editorial commentary by Mofenson on pages 1294–6.)
More than 1.5 million human immunodeficiency virus (HIV)–infected women become pregnant worldwide each year, resulting in >150 000 infant HIV infections [1]. Without antiretroviral therapy (ART), mortality among HIV-infected children reaches 50%–65% by age 2 years, peaking in the first 2–3 months of life [2, 3]. While 76% of these deaths can be averted by prompt ART initiation, this requires accurate diagnosis of HIV infection during early infancy (commonly referred to as “early infant HIV diagnosis” [EID]) [4]. The World Health Organization (WHO) recommends EID testing at 6 weeks of age for all HIV-exposed infants; however, only 50% were tested in 2014 [5–7]. Because maternal anti-HIV antibodies are detectable in HIV-exposed infants' sera, EID requires a costlier nucleic acid amplification test (NAAT) [5, 8]. In addition, many infants are lost at each step of the EID testing-to-treatment cascade: presentation to healthcare facilities for EID, offer and acceptance of testing, specimen transport and laboratory processing, return of test results to caregivers (hereafter, “result-return), linkage to HIV care, and ART initiation [5, 8–11]. Even in well-functioning EID programs, late diagnosis causes infants to delay ART initiation until well after the peak of HIV-related mortality [3].
Changes to the current program of EID testing at 6 weeks of age have been proposed, based on the fact that infants who are infected in utero have detectable virus at birth, but infants infected during delivery (intrapartum infection) or through breastfeeding (postpartum infection) have detectable virus only several weeks after infection [8, 9, 12, 13]. Infant antiretroviral prophylaxis, usually offered for 6 weeks after birth, could plausibly reduce NAAT sensitivity at 6 weeks of age, although data remain equivocal [9, 14]. Lilian et al suggest that testing at birth, when most infants are in healthcare facilities, or 10 weeks of age, after infant prophylaxis has ended, may identify more HIV-infected children than testing once at 6 weeks of age [9, 15]. Testing twice, at birth and at 6 or 10 weeks of age, could detect and treat intrauterine infections promptly at birth and intrapartum/early postpartum infections occurring before the second test. Optimal timing of EID depends primarily on 3 factors: the number of children who have become infected and have assay-detectable virus at each time point, the number presenting to care at each time point, and the number who will experience mortality before testing occurs. These factors are difficult to study in clinical trials, because substantial unobserved morbidity and mortality occur among children not in care. We used a model of infant HIV disease to examine the clinical benefits and cost-effectiveness of current and proposed EID strategies in South Africa, the country with the highest burden of HIV disease in the world, to inform EID recommendations in the 2015 WHO Consolidated HIV Testing Guidelines.
METHODS
Analytic Overview
We used the Cost-Effectiveness of Preventing AIDS Complications (CEPAC)–Pediatric model to evaluate 4 EID strategies for South African infants born to HIV-infected mothers: the no EID testing strategy (comparator); testing once, at birth alone or 6 weeks of age alone (hereafter, the “birth alone” or “6 weeks alone” strategies); and testing twice, at birth and 6 weeks of age (hereafter, the “birth and 6 weeks” strategy). Model outcomes included short- and long-term survival, HIV-related healthcare costs, and life expectancy. To reflect outcomes and resource requirements for an entire HIV program, we projected results separately for HIV-infected infants and for a birth cohort of HIV-exposed infants (including both HIV-infected and HIV-uninfected children). Using birth cohort outcomes, discounted at 3%/year, we calculated an incremental cost-effectiveness ratio (ICER) for each strategy, compared with the next less expensive alternative, as follows: difference in lifetime costs divided by difference in years of life saved (YLS). We considered interventions with ICERs of <50% of South Africa's per capita gross domestic product (GDP; 0.5 × $6500 = $3250) to be cost-effective, based on emerging literature; we also examined thresholds of 100% and 300% of the GDP [16–19]. A strategy with higher lifetime costs and lower life expectancy than a competing strategy is considered “strongly dominated;” when comparing ≥3 strategies, if a strategy has a higher ICER than another strategy with a higher cost, the first strategy is “weakly dominated.” To understand the possible outcomes if guidelines were fully implemented in clinical practice, the base case simulated guideline-concordant care, with 100% presentation for EID, result-return (ie, the proportion of caregivers receiving test results), linkage to care, and ART for surviving HIV-infected infants. In sensitivity analyses, we varied uptake at each step in this cascade (0%–100%), used 10-week testing in place of 6-week testing, and varied other key model input data and assumptions. In scenario analyses, we examined selected clinical impacts of implementing birth and 6 weeks testing.
CEPAC-Pediatric Model
The CEPAC-Pediatric model is a microsimulation model of pediatric HIV disease (available at: http://www.massgeneral.org/mpec; Supplementary Materials), expanded to incorporate infant HIV transmission and EID testing. Validation and calibration of model-projected opportunistic infections and survival for treated and untreated infants have been previously described [20, 21]. Infants enter the model at birth and are simulated until death. Maternal CD4+ T-cell count and availability of medications for prevention of mother-to-child HIV transmission (PMTCT) determine the transmission risk during 3 periods: the intrauterine period (1-time risk), the intrapartum period (1-time risk), and the postpartum period (monthly risk until breastfeeding cessation; we exclude nonperinatal HIV acquisition). All patients face age-stratified monthly risks of non–HIV-related mortality; after HIV infection, patients face additional age- and CD4+ T-cell count–stratified risks of OIs, OI-related mortality, and non–OI-related mortality.
Planned EID testing can occur at any age from 0 to 24 months. NAAT sensitivity varies by period of infection (intrauterine, intrapartum, and postpartum) and time since infection, to reflect the viremia level necessary to be detectable. Children with undiagnosed HIV infection who develop an OI at any age also present to care and receive HIV testing. We simulated 2 available lifetime ART regimens with associated probabilities of HIV suppression and increases in CD4+ T-cell percentage (before the age of 5 years) or absolute CD4+ T-cell count (after the age of 5 years); a description of ART failure and switching is available in the Supplementary Materials. Children engaged in care may also become lost to follow-up.
Modeled Population
EID is currently recommended for infants known to be HIV exposed [22]; we therefore simulated infants born to women who were identified during antenatal care as HIV infected. Based on current WHO and South African guidelines and data, we assumed that 90% of women received ART during pregnancy and breastfeeding (WHO Option B/B+ PMTCT strategies), with a mean breastfeeding duration of 12 months (Table 1) [1, 36].
Table 1.
Selected Data Parameters for Cost-Effectiveness of Preventing AIDS Complications–Pediatric Model Analysis of Diagnostic Testing for Human Immunodeficiency Virus (HIV) Infection During Early Infancy in South Africa
| Cohort Characteristic | Value |
Source(s) | |
|---|---|---|---|
| Age, mo, mean ± SD | 0 ± 0 | Assumption | |
| Male sex, % | 48.8 | [23] | |
| Mothers with CD4+ T-cell count ≤ 350 cells/µL before ART initiation, % | 36 | [24] | |
| Breastfeeding,a % (range examined) | 80 (0–100) | Assumption | |
| Breastfeeding duration, mo, mean ± SD | 12 (2) | Assumption | |
| MTCT parameterb | Maternal CD4+ T-Cell Count ≤ 350 cells/µL | Maternal CD4+ T-Cell Count > 350 cells/µL | Source(s) |
| One-time risk for IU and IP transmission | Full references in Supplementary Table A | ||
| Receiving ART (60% IU transmission; 40% IP transmission) | 1.0 | 1.0 | |
| Not receiving ART (38% IU transmission; 62% IP transmission) | 27 | 17 | |
| Monthly risk of PP transmission during breastfeeding | |||
| Receiving ART | 0.19 | 0.19 | |
| Not receiving ART | |||
| Exclusive breastfeeding | 0.76 | 0.24 | |
| Mixed or complementary feeding | 1.28 | 0.40 | |
| Probability that maternal status is known in pregnancy, % | 100 | 100 | Assumption |
| Probability that mother is receiving ART in pregnancy and breastfeeding, % (range examined) | 90 (40–100) | 90 (40–100) | [1] |
| Monthly maternal mortality risk | 0.21 | 0.11 | CEPAC adult model |
| EID cascade parameter | Guideline Concordant, Value | Range Examined | Source(s) |
| Probability of presenting to a testing visit, % | 100 | 0–100 | Scenario-specific assumptions |
| Probability of being offered and accepting test, % | 100 | 0–100 | |
| Probability of receiving test results, % | 100 | 0–100 | |
| Delay between primary test and result receipt, mo | 1 ± 0c | 0–5 | |
| Delay between confirmatory test and result receipt, mo | 0 ± 1c | 0–3 | |
| Probability of linking to care/ART after diagnosis, % | 100 | 0–100 | |
| NAAT characteristic | Base Case Value, % | Range Examined, % | Source(s) |
| Sensitivity for IU infection, all ages | 100 | 0–100 | [25] |
| Sensitivity for IP infection, by age | [25] | ||
| First month of life | 0 | 0 | |
| Later months | 100 | 0–100 | |
| Sensitivity for PP infection, by time since infection | [25] | ||
| Month of infection | 0 | 0 | |
| Later months | 100 | 0–100 | |
| Specificity, all ages | 98.8 | 85–100 | [25] |
| ART efficacy,dby age, % | First-Line ARTe | Second-Line ARTf | Source(s) |
| Ages 0–59 mo | 91 | 75 | [26, 27] |
| Ages ≥60 mo | 75 | 75 | [28] |
| ART-associated CD4+ T-cell count–independent risk reduction, % | Value | Source(s) | |
| In opportunistic infection, by age | |||
| 0–13 mo | 85 | [21] | |
| ≥13 mo | 32 | [29] | |
| In mortality, by age | |||
| 0–13 mo | 90 | [21] | |
| ≥13 mo (range, by CD4+ T-cell count) | 55–96 | [29] | |
| Cost, $g | |||
| OI care, per event (range by age, CD4+ T-cell %/CD4+ T-cell count, type of event) | 260–2175 | [30–34] | |
| ART, per mo (range by regimen, dose/age) | 7–40 | [32, 33] | |
| NAATh (sensitivity analysis) | 25 (5–75) | Assumption | |
| NAAT result | Assumption (nurse time × salary) [35] | ||
| Return for negative NAAT result plus indicated counseling | 1.83 | ||
| Return for positive NAAT result plus indicated counseling | 3.05 | ||
Abbreviations: ART, antiretroviral therapy; EID, early infant diagnosis; IP, intrapartum; IU, intrauterine; MTCT, mother-to-child transmission; NAAT, nucleic acid amplification test; OI, opportunistic infection; PP, postpartum; SD, standard deviation.
a Exclusive breastfeeding (first 6 months of life) in 55%, mixed breastfeeding (first 6 months of life) in 25%, and replacement feeding from birth in 20%. After 6 months of age, all infants still breastfeeding are assumed to receive complementary feeding (breast milk and other liquids/solids).
b Coverage for prevention of MTCT was based on UNAIDS reports: >95% HIV testing coverage during antenatal care and >95% ART coverage after a positive result of an HIV test (0.95 × 0.95 = 0.90). Coverage scenarios of 100% for prevention of MTCT lead to projected IU/IP MTCT risks of 1.0%, reflecting, for example, a population of women who are receiving ART throughout most of pregnancy with excellent medication adherence.
c Data are mean ± SD.
d Defined as an HIV RNA load of <400 copies/mL at 24 wk of ART.
e Costs were in 2013 dollars and from the healthcare system perspective.
f Lopinavir, ritonavir, abacavir, and lamivudine.
g Efavirenz or nevirapine, plus zidovudine and lamivudine.
h Includes costs of assays, reagents, and personnel time for counseling, blood specimen collection, specimen transport and processing, and quality control.
Modeled EID Strategies
In the no EID strategy, HIV infection in an infant was diagnosed upon presenting to care with a WHO clinical stage 3/4 OI (Supplementary Figure A). In the EID strategies (birth alone, 6 weeks alone, and birth and 6 weeks), we simulated a scheduled EID test at the specified age. In the base case, any positive NAAT result was followed by linkage to HIV care and a second, confirmatory NAAT. We assumed that ART was initiated for all children in HIV care, per WHO guidelines, with ART discontinued if the result of the confirmatory NAAT was negative (a description of care after false-positive results is provided in the Supplementary Materials) [5]. For infants who missed a scheduled test (eg, sensitivity analyses with testing rates of <100%) and for infants infected after 6 or 10 weeks of age, HIV infection was diagnosed only after occurrence of an OI. We also examined 10-week testing and use of postweaning final status tests; postweaning tests are currently recommended but rarely completed (Supplementary Materials) [22, 37].
Input Data
Cohort characteristics, MTCT risks, disease progression, and ART outcomes were from African trials and cohort studies (Table 1 and Supplementary Table A) [23, 26, 27, 38, 39]. NAAT sensitivity (base case, 100% >1 month after infection), specificity (98.8%), and costs ($25) were from WHO systematic reviews, published data, and expert opinion, and their values were varied widely in sensitivity analyses [9, 25]. The model incorporates reduced mortality and OI risks for patients receiving ART, independent of CD4+ T-cell count and viral suppression [26]. In the base case, we used values for these ART-associated CD4+ T-cell count–independent risk reductions from our previously published calibration analyses [21]; we varied these widely in sensitivity analyses (Supplementary Materials).
To examine the resources required for an HIV program, we included costs related to EID (for all infants) and HIV care (for HIV-infected infants). We used South African data on OI care costs for children aged <5 years [40]. For OI care among older children and routine care at all ages, we multiplied South African adult resource utilization (outpatient visits, inpatient days, and laboratory testing) by South African unit costs [30, 31, 41]. ART costs were from published price lists, with WHO weight-based dosing [32, 33]. Our modeled NAAT costs included costs of assays, reagents, and staff time for specimen processing and result-return; we assumed that healthcare infrastructure existed to provide birth testing (eg, in labor and delivery wards or bacillus Calmette-Guérin vaccination clinics) and 6-week testing (eg, vaccination or PMTCT clinics).
Sensitivity Analyses
In the base case, we simulated guideline-concordant care, as follows: 100% probabilities of presentation for EID testing, result-return, and linkage to care and ART after diagnosis, with result-return (turnaround) time of 1 month (after the first EID test [42]). In univariate sensitivity analyses, we varied each of these probabilities and times, reflecting patient-/caregiver-level behavior and setting-specific availability of ART and HIV care (Table 1). We also varied PMTCT availability during pregnancy and breastfeeding (with consequent reductions in MTCT risk), breastfeeding prevalence and duration, NAAT specificity, NAAT sensitivity (overall and as a function of age and PMTCT exposure), OI and mortality risks, ART-associated CD4+ T-cell count–independent reductions in OI and mortality risk, loss to follow-up and virological failure rates after ART initiation (applied lifelong), and costs of NAATs, HIV care, and ART. In multivariate sensitivity analyses, we varied the most influential of these parameters simultaneously.
We also simulated strategies of EID testing at 10 weeks alone and at birth and 10 weeks. These analyses quantified the additional early postpartum infections identified with testing at 10 weeks of age versus testing at 6 weeks of age, balancing this benefit against the risk that infants infected during the intrauterine or intrapartum periods would die before testing at 10 weeks of age and subsequent ART initiation. Because of concern that NAATs may have lower sensitivity during or immediately after administration of antiretroviral prophylaxis to infants, we also compared strategies involving testing at 10 weeks of age to those involving testing at 6 weeks of age in a scenario in which NAAT sensitivity was reduced for infants receiving prophylaxis at 6 weeks of age [9].
Clinical Scenario Analyses
We examined 2 scenarios to estimate the clinical impact of adding testing at birth to existing programs involving testing at 6 weeks of age, based on the UNAIDS data [1]. In scenario A, given a partially implemented 6 weeks alone strategy with 50% presentation for testing and 50% result-return, we compared (1) adding a program for testing at birth (the birth and 6 weeks strategy with 50% testing and 50% result-return at both ages) to (2) improving testing and result-return within the existing 6 weeks alone strategy. In scenario B, we addressed concerns that negative results of EID testing at birth (excluding only infection during the intrauterine period) may lead caregivers to forgo testing at 6 weeks of age, which is needed to identify infection acquired during the intrapartum and early postpartum periods [43]. We examined the birth and 6 weeks strategy when the frequency of testing at 6 weeks of age was reduced and identified the degree of attrition between birth and 6 weeks of age that would offset the benefits of adding testing at birth to existing programs involving testing at 6 weeks of age. Because neither the relative nor absolute costs of scaling-up programs for testing at birth and at 6 weeks of age have been reported, we excluded costs from scenarios A and B.
Ethics Approval
This study was approved by the Partners Healthcare Institutional Review Board (Boston, Massachusetts).
RESULTS
Base Case Results: Clinical Outcomes
Among the birth cohort, we projected a total MTCT risk of 4.9%, with values of 1.8% for the intrauterine period, 1.2% for the intrapartum period, and 1.9% for the postpartum period; 95.1% of infants were projected to be HIV exposed and uninfected, similar to South African national estimates (Table 2) [45]. The no EID strategy (ART only for those surviving and presenting with an OI) led to the worst clinical outcomes for HIV-infected infants: 1-year survival of 64.46% and life expectancy of 21.1 years. In the base case (100% testing, result-return, and linkage), survival substantially increased with any EID program. Of the testing-once strategies, survival for HIV-infected infants was lower with the birth alone strategy (1-year survival, 72.0%; life expectancy, 24.4 years) than with the 6 weeks alone strategy (1-year survival, 74.9%; life expectancy, 25.9 years), owing to the proportion of infants surviving with detectable virus at each age (Supplementary Figure B). Testing twice further increased survival: the birth and 6 weeks strategy led to a 1-year survival of 76.6% and a life expectancy of 26.5 years. The impact of any EID strategy for the entire birth cohort (HIV-exposed but uninfected infants and HIV-infected infants) was modest: 1-year survival ranged from 92.7% to 93.3%, and life expectancy ranged from 61.1 to 61.4 years (Table 2).
Table 2.
Base-Case Model Results: Diagnostic Testing for Human Immunodeficiency Virus (HIV) Infection During Early Infancy (EID) in South Africa
| Variable | HIV-Infected Infants |
Birth Cohort |
Lifetime Cost per Person, 2013 $ |
|||
|---|---|---|---|---|---|---|
| Clinical and economic projections | ||||||
| MTCT outcomes | 4.9% of entire birth cohort: 1.8% IU transmission, 1.2% IP transmission, 1.9% PP transmission | 4.9% HIV infected; 95.1% HIV exposed, uninfected | … | |||
| Economic and clinical outcomes, by EID strategy | Survival at 1 y, % | Life Expectancy, y Undiscounted | Survival at 1 y, % | Life Expectancy, y Undiscounted | Birth Cohort, Undiscounted | HIV-Infected Infants, Undiscounted |
| No EID | 64.6 | 21.1 | 92.7 | 61.1 | 1430 | 29 100 |
| Birth alone | 72.0 | 24.4 | 93.1 | 61.3 | 1670 | 33 520 |
| 6 wk alone | 74.9 | 25.9 | 93.2 | 61.4 | 1770 | 35 470 |
| Birth and 6 wk | 76.6 | 26.5 | 93.3 | 61.4 | 1840 | 36 300 |
| ICER, by EID strategy | Birth Cohort Life Expectancy, y, Discounted | Birth Cohort Lifetime Cost per Person, $, Discounted | Incremental Cost-effectiveness Ratio, 2013 $/YLS | |||
| No EID | 25.7 | 660 | Comparator | |||
| Birth alone | 25.8 | 780 | Dominateda | |||
| 6 wk alone | 25.8 | 820 | 1250 | |||
| Birth and 6 wk | 25.8 | 870 | 2900 | |||
| Sensitivity analyses: select results for 10-week EID strategiesb | HIV-Infected Infants |
Birth Cohort |
Lifetime Cost per Person, 2013 $ |
|||
| Survival at 1 y, % | Life Expectancy, y Undiscounted | Survival at 1 y, % | Life Expectancy, y Undiscounted | Birth Cohort, Undiscounted | HIV-Infected Infants, Undiscounted | |
| 10 wk alone | 72.9 | 25.3 | 93.1 | 61.3 | 1730 | 34 660 |
| Birth and 10 wk | 75.9 | 26.3 | 93.3 | 61.4 | 1840 | 36 060 |
Abbreviations: ICER, incremental cost-effectiveness ratio; IP, intrapartum infection; IU, intrauterine infection; MTCT, mother-to-child-transmission; PP, postpartum infection; YLS, year of life saved.
a A strategy that has higher lifetime costs and lower life expectancy than a competing strategy is said to be “strongly dominated,” in which case no ICER is calculated. When comparing ≥3 strategies, if a strategy has a higher ICER than a competing strategy with a higher lifetime cost (as is the case here), then the strategy is said to be “weakly dominated,” reflecting a less efficient use of healthcare resources than a linear combination of other strategies, and the ICERs of all strategies are recalculated with that strategy omitted [44]. ICERs are calculated from unrounded model output and are then rounded to the nearest $50.
b Complete results are available in the Supplementary Materials.
Base Case Results: Costs and Cost-effectiveness
The no EID strategy yielded the lowest projected HIV-related healthcare costs for the birth cohort; 1-year costs were $50/HIV-exposed infant, and lifetime undiscounted costs were $1430/HIV-exposed infant (Figure 1 and Table 2). With both testing-once strategies, 1-year birth cohort costs were similar ($70/infant), although lifetime costs varied more widely (birth alone strategy, $1670/infant; 6 weeks alone strategy, $1770/infant). With the birth and 6 weeks strategy, the 1-year cost was $100/infant, and the lifetime cost was $1840/infant. EID program costs ranged from $30 (testing once) to $55 (testing twice), representing 43%–55% of 1-year costs and 2%–3% of lifetime costs (Figure 1). In cost-effectiveness analyses, the birth alone strategy was weakly dominated (Table 2). The ICER of the 6 weeks alone strategy versus the no EID strategy was $1250/YLS (19% of South Africa's per capita GDP), and the ICER of the birth and 6 weeks strategy versus the 6 weeks alone strategy was $2900/YLS (45% of GDP).
Figure 1.
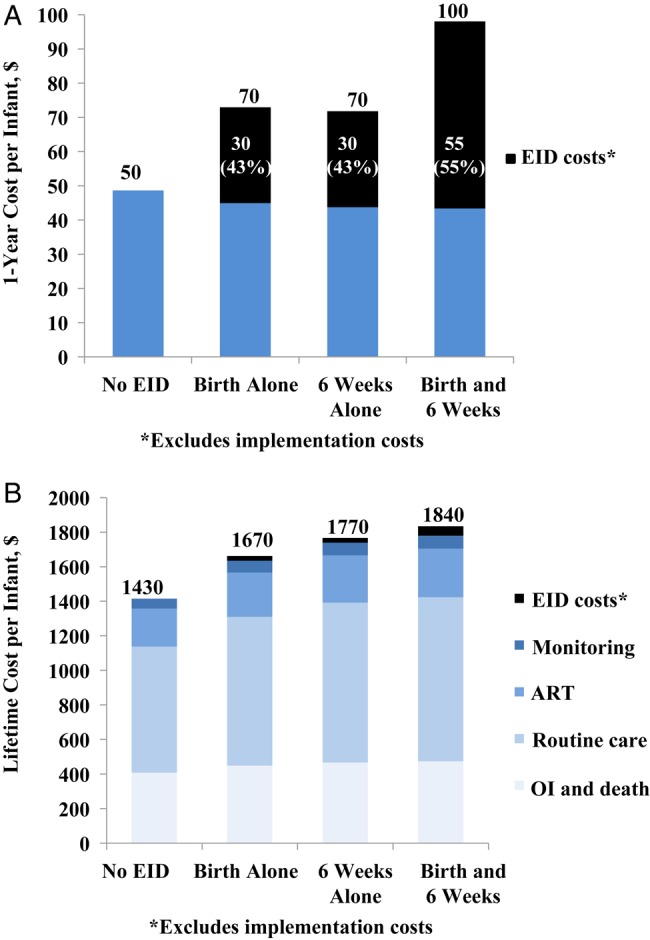
One-year and lifetime per-patient healthcare costs of strategies for diagnosis of human immunodeficiency virus (HIV) infection during early infancy (commonly known as “early infant HIV diagnosis” [EID]) for HIV-exposed infants in South Africa. A, One-year total HIV care costs per HIV-exposed infant tested range from $50 for the no EID testing strategy to $100 for testing at birth and 6 weeks of age (hereafter, the “birth and 6 weeks” strategy). Costs of the EID program itself, including the costs of assays, personnel, specimen handling, and return of test results to the infant's caregiver, are shown in black and range from $30 (testing once) to $55 (testing twice). These costs exclude implementation costs associated with adding a new program if none existed previously. B, Total and component lifetime costs per HIV-exposed infant tested. Routine HIV care, CD4+ T-cell count and HIV load monitoring, opportunistic infections (OIs) and end-of-life care, and antiretroviral therapy (ART) comprise the majority of lifetime costs. EID program costs are shown in black and comprise 2%–3% of lifetime costs.
Sensitivity Analyses: Testing Once
Among testing-once strategies, the birth alone strategy remained dominated, and the ICER of the 6 weeks alone strategy versus the no EID strategy remained <50% of GDP through wide variations in most parameters, if varied equally in all strategies. There were 2 exceptions: if the result-return rate was <10% or if the linkage to HIV care and ART rate was <10%, the ICER of the 6 weeks alone strategy versus the no EID strategy exceeded 50% of GDP.
Sensitivity Analyses: Testing Twice
The ICER of the birth and 6 weeks strategy as compared to the 6 weeks alone strategy remained <50% of the GDP despite wide variations in presentation for EID testing, use of confirmatory NAATs, PMTCT coverage, and postweaning testing. The ICER of the birth and 6 weeks strategy as compared to the 6 weeks strategy exceeded 50% of the GDP, and therefore the 6 weeks alone strategy would be preferred by this economic criterion, if the ART-associated CD4+ T-cell count–independent reductions in mortality and OI risk were <78%, the NAAT specificity was <98% or sensitivity was <30%, linkage to ART was <15%, result-return was <16%, PMTCT coverage was ≥97%, the cost of adding a birth testing program to an existing 6-week testing program was >$6/infant, NAAT costs exceeded $31, the mean result-return time exceeded 3 months, the probability of late virological failure was >4.6%/month, OI risks were reduced by 20%, or clinical care costs were >1.3 times base case values (Figure 2). In multivariate sensitivity analyses, the birth and 6 weeks strategy was more expensive but less effective (dominated) than the 6 weeks alone strategy if the benefit of ART was further reduced (OI risks doubled, combined with ART-associated CD4+ T-cell count–independent reductions in OI and mortality risk of <10%) or if linkage to ART and retention in care were both extremely low (linkage of <10% combined with a loss to follow-up >2.0%/month).
Figure 2.

Tornado diagram showing key parameters that change the cost-effectiveness of diagnostic testing for human immunodeficiency virus (HIV) infection during early infancy (commonly known as “early infant HIV diagnosis” [EID]) at birth and 6 weeks of age (hereafter, the “birth and 6 weeks” strategy), compared with testing at 6 weeks of age alone (hereafter, the “6 weeks alone” strategy). Key parameters varied in model sensitivity analyses are shown on the left. Values in parentheses indicate the range examined (from the value leading to the lowest incremental cost-effectiveness ratio [ICER] to the value leading to the highest ICER), with base-case values after the semicolon. ICERs for the comparison of birth and 6 weeks strategy versus the birth alone strategy are shown on the horizontal axis in 2013 dollars per year of life saved (YLS). The range of ICERs for each varied parameter is indicated by the blue bars. Longer bars indicate parameters to which the model results were more sensitive. The red line indicates the ICER of $2900/YLS for the birth and 6 weeks strategy versus EID at birth alone, using all base-case parameters. The dotted black line indicates 50% of South Africa's per capita gross domestic product (GDP; 0.5 × $6500 = $3250), the dashed black line indicates 100% of South Africa's per capita GDP ($6500), and the solid black vertical line indicates 300% of South Africa's per capita GDP ($19 500). The value for each parameter at which the ICER crosses the 50% GDP threshold is listed within each horizontal bar. This figure provides a framework for making decisions on cost-effectiveness grounds: the value within the horizontal bar indicates when one would favor the 6 weeks alone strategy over the birth and 6 weeks strategy on the basis of this criterion. Bars extending to the far-right axis indicate scenarios in which the birth and 6 weeks strategy results in an ICER of >$20 000/YLS, compared with the 6 weeks alone strategy, or becomes strongly dominated (more expensive and less effective) by the 6 weeks alone strategy. Abbreviations: ART, antiretroviral therapy; NAAT, nucleic acid amplification test; OI, opportunistic infection; PMTCT, prevention of mother-to-child transmission.
Sensitivity Analyses: Strategies Involving Testing at 10 Weeks of Age
Among HIV-infected infants, clinical outcomes were modestly worse if testing-once occurred via the 10 weeks alone strategy, rather than via the 6 weeks alone strategy (1-year survival, 72.9% vs 74.9%; life expectancy, 25.3 vs 25.9 years) but similar if testing twice occurred via the birth and 10 weeks strategy or via the birth and 6 weeks strategy (1-year survival, 75.9% vs 76.6%; life expectancy, 26.3 vs 26.5 years; Table 2 and Supplementary Table C). Mortality among infants infected during the intrauterine and intrapartum periods, before EID testing and ART initiation at 10 weeks of age, outweighed the survival benefit for the small additional number of infants infected during the postpartum period identified between 6 and 10 weeks of age (Supplementary Figure B). However, if NAAT sensitivity was <60% at 6 weeks of age and unaffected at 10 weeks of age, the 10 weeks alone strategy was clinically superior to the 6 weeks alone strategy. Similarly, if NAAT sensitivity was <80% at 6 weeks of age and unaffected at 10 weeks of age, the birth and 10 weeks strategy was clinically superior to the birth and 6 weeks strategy. Economically, the 10 weeks alone strategy was dominated (Supplementary Table C); differences between the 2 testing-twice strategies were small.
Clinical Scenario Analyses
In scenario A, clinical outcomes improved more by scaling up partially implemented 6 weeks alone strategies than by adding birth testing at current uptake levels (Figure 3). Given a 6 weeks alone strategy with 50% testing coverage and a 50% result-return frequency (1-year survival, 63.4%; bar I in Figure 3), adding birth testing with 50% testing coverage and a 50% result-return frequency improved survival minimally (64.4%; bar II in Figure 3). In contrast, improving coverage of the 6 weeks alone strategy and the result-return frequency to 75% (68.1%; bar III in Figure 3) or 100% (74.9%; bar V in Figure 3) led to greater survival gains. In scenario B, attrition between the 2 scheduled testing times markedly reduced the effectiveness of the birth and 6 weeks strategy. One-year survival among HIV-infected infants was worse with the birth and 6 weeks strategy than with the 6 weeks alone strategy when >37% of patients receiving a negative test result at birth did not present for scheduled testing at 6 weeks of age.
Figure 3.
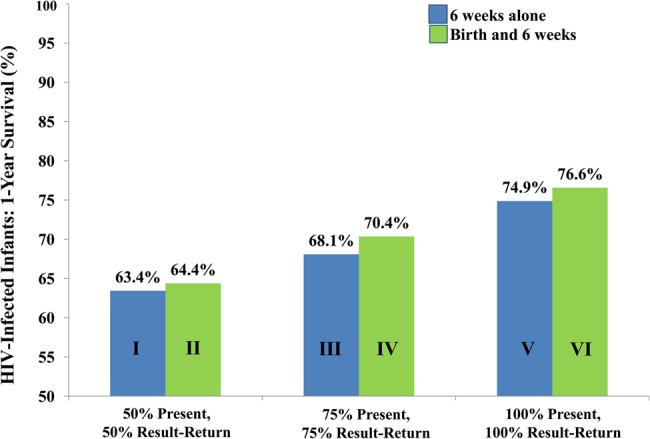
Scaling up diagnostic testing for human immunodeficiency virus (HIV) infection during early infancy (commonly known as “early infant HIV diagnosis” [EID]) programs at 6 weeks of age alone (hereafter, “6 weeks alone”) or adding testing at birth. In scenario A, we projected the impact of scaling up existing 6 weeks alone EID programs and of adding birth testing to existing 6 weeks alone programs. For a 6 weeks alone program in which 50% of infants are tested (50% testing) and results are returned to caregivers of 50% of infants tested (50% result-return), 1-year survival among HIV-infected infants is projected at 63.4% (bar I). Adding birth testing to this program, also with 50% testing and 50% result-return, would improve outcomes minimally (to 64.4%; bar II). In contrast, scaling up the 6 weeks alone program with 75% testing and 75% result-return (1-year survival, 68.1%; bar III) or closer to 100% testing and 100% result-return (1-year survival, 74.9%; bar V) would improve outcomes to a much larger degree. Five-year and lifetime outcomes followed similar trends.
DISCUSSION
We simulated EID strategies for HIV-exposed infants in South Africa, with 3 primary findings. First, testing once in the first months of life, regardless of age at testing, markedly improves survival among HIV-infected infants as compared to no EID. Among the testing-once strategies, 6 weeks alone is clinically and economically superior to birth alone. Six-week EID programs have been reported as cost-effective among formula-fed infants in Thailand; our study confirms the cost-effectiveness of current EID recommendations for breastfeeding infants in South Africa [46, 47]. Although low rates of result-return and linkage to HIV care attenuate the cost-effectiveness of EID programs, a 6-week strategy remains cost-effective unless attrition rates are extremely high (≤10% of HIV-infected infants linking to care and ART).
Second, a guideline-concordant program offering EID twice, at birth and 6 weeks of age, will further improve survival and be cost-effective in South Africa, compared with a 6 weeks alone strategy, under most scenarios (Figure 2). The cost-effectiveness of testing twice depends on MTCT risk and on the degree to which ART initiation in the first months of life reduces HIV-related mortality (Figure 2); few data are available about the latter [3, 4]. To ensure the clinical benefits of adding birth testing to a 6 weeks alone strategy, avoiding attrition between the encounters at birth and 6 weeks of age is critical. Care providers must also emphasize that negative results of tests at birth indicate only that infants were not infected in utero; testing at later ages is needed to identify infections acquired during the intrapartum and postpartum periods. If >37% of infants receiving a negative test result at birth do not present for testing at 6 weeks of age, as seen in Cape Town [43], the survival benefits of adding testing at birth to a fully implemented 6 weeks alone strategy are lost. Additionally, for existing 6 weeks alone programs, clinical outcomes are improved to a much greater degree by maximizing uptake among 6-week-old infants than by adding birth testing at low uptake levels (Figure 3).
Third, the benefit of testing twice remains substantial regardless of whether the second test is offered at 6 or 10 weeks. Although the 10 weeks alone strategy is inferior to the 6 weeks alone strategy, the decision between the birth and 6 weeks strategy and the birth and 10 weeks strategy can be made on the basis of programmatic and feasibility considerations, including current immunization and PMTCT follow-up visits, which usually occur at 6 weeks of age [5, 9, 11]. However, the birth and 10 weeks strategy becomes superior to the birth and 6 weeks strategy if antiretrovirals for PMTCT reduce NAAT sensitivity at 6 weeks of age to <80%. The few available reports have estimated NAAT sensitivities of 75%–100% at 6 weeks of age with antiretroviral exposure [9, 14]. Further investigation of the impact of antiretrovirals on assay sensitivity will be critical.
There are several limitations in our model-based analysis. Important developments in medication availability, clinical care, and healthcare costs will undoubtedly occur over infants' lifetimes, and long-term model-based projections for children are uncertain. We addressed this uncertainty by calibrating the model to ensure that results matched current survival, MTCT risk, and OI data [20, 21, 45] and then varying factors likely to change over time, such as OI outcomes, ART availability, and costs. Except where noted, these sensitivity analyses did not change our policy conclusions; they also suggest that, while economic results are specific to South Africa, clinical results may be generalizable to many settings. Next, we were not able to fully assess economic trade-offs of scaling up an existing 6 weeks alone strategy, compared with adding testing at birth. We found that if adding birth testing to a 6 weeks alone strategy costs ≥$6/infant tested, a birth and 6 weeks strategy will no longer be cost-effective as compared to a 6 weeks alone strategy at the 50% GDP threshold. Little is known about the resources required to implement or expand EID programs. A South African pilot program for testing at birth was costly (6 full-time staff identified and tested HIV-exposed infants, returned results, and initiated ART; Karl Technau, personal communication). It is plausible that scale-up of 6 weeks alone programs might be costlier (eg, developing systems to trace HIV-exposed infants not presenting for care), but there are no data on these costs. In the absence of available scale-up costs, we focused our scenario analyses on clinical outcomes. Finally, this work addresses infants known to be HIV exposed. In many settings, maternal HIV status may not be known or adequately documented on infant health cards, or maternal infection may occur after antenatal HIV testing [1]. Strategies to detect HIV exposure are likely to improve infant health in settings of high HIV prevalence [48].
In summary, we have found that current EID recommendations for a 6 weeks alone strategy markedly improve infant outcomes and are of good value in South Africa as compared to a no EID strategy. Testing twice, at birth and 6 weeks of age, will further improve outcomes and be cost-effective when uptake is high. If scale-up costs are comparable, policymakers should add testing at birth after optimizing 6 weeks only strategies, alongside careful attention to retaining infants with negative results of tests at birth in care.
Supplementary Data
Supplementary materials are available at http://jid.oxfordjournals.org. Consisting of data provided by the author to benefit the reader, the posted materials are not copyedited and are the sole responsibility of the author, so questions or comments should be addressed to the author.
Notes
Acknowledgments. We thank Emily Hyle, Divya Mallampati, Anne Neilan, George Seage III, Kunjal Patel, Sophie Desmonde, Ingrid Bassett, and Elena Losina, for their insightful contributions to designing the analysis and interpreting model results; and Simone Frank, for her assistance with manuscript preparation.
Disclaimer. The content is solely the responsibility of the authors and does not necessarily represent the official views of the National Institutes of Health or the World Health Organization.
Financial support. This work was supported by the World Health Organization (to J. A. F., M. P., T. H., R. A. P., and A. C.); the National Institutes of Health, through the Eunice Kennedy Shriver National Institute of Child Health and Human Development (NICHD; award R01 HD079214 to J. A. F., T. H., R. L. M., R. P. W., M. C. W., R. A. P., K. A. F., and A. C.) and the National Institute of Allergy and Infectious Diseases (NIAID; awards K01 AI078754 [to A. C.], R01 AI058736 [to J. A. F., T. H., R. L. M., R. P. W., M. C. W., R. A. P., and K. A. F.], and R37 AI093269 [to R. P. W.]); the International Maternal Pediatric Adolescent AIDS Clinical Trials (IMPAACT) group (to A. C., T. H., R. P. W., and K. A. F.); and the Massachusetts General Hospital Executive Committee on Research (to A. C. and R. P. W.).
Overall support for the IMPAACT group was provided by the NIAID (awards UM1 AI068632 [to IMPAACT LOC] and UM1 AI068616 [to IMPAACT SDMC]), with cofunding from the NICHD and the National Institute of Mental Health. Support of the sites was provided by the NIAID and the NICHD International and Domestic Pediatric and Maternal HIV Clinical Trials Network, funded by the NICHD (contract N01-DK-9-001/HHSN267200800001C).
Potential conflicts of interest. All authors: No reported conflicts. All authors have submitted the ICMJE Form for Disclosure of Potential Conflicts of Interest. Conflicts that the editors consider relevant to the content of the manuscript have been disclosed.
References
- 1.World Health Organization (WHO). Progress report on the global plan towards the elimination of new HIV infections among children and keeping their mothers alive. Geneva, Switzerland: WHO, 2015. http://www.unaids.org/sites/default/files/media_asset/JC2774_2015ProgressReport_GlobalPlan_en.pdf Accessed 22 March 2016. [Google Scholar]
- 2.Newell ML, Coovadia H, Cortina-Borja M, Rollins N, Gaillard P, Dabis F. Mortality of infected and uninfected infants born to HIV-infected mothers in Africa: a pooled analysis. Lancet 2004; 364:1236–43. [DOI] [PubMed] [Google Scholar]
- 3.Bourne DE, Thompson M, Brody LL et al. Emergence of a peak in early infant mortality due to HIV/AIDS in South Africa. AIDS 2009; 23:101–6. [DOI] [PubMed] [Google Scholar]
- 4.Violari A, Cotton MF, Gibb DM et al. Early antiretroviral therapy and mortality among HIV-infected infants. N Engl J Med 2008; 359:2233–44. [DOI] [PMC free article] [PubMed] [Google Scholar]
- 5.World Health Organization. Consolidated guidelines on the use of antiretrovirals for the treatment and prevention of HIV infection. Geneva, Switzerland: WHO, 2013. http://www.who.int/hiv/pub/guidelines/arv2013/download/en/index.html Accessed 7 July 2016. [Google Scholar]
- 6.UNAIDS. How AIDS changed everything: 15 years, 15 lessons of hope from the AIDS response. 2015. http://www.unaids.org/sites/default/files/media_asset/MDG6Report_en.pdf Accessed 7 July 2016.
- 7.World Health Organization. Global health sector response to HIV, 2000–2015: focus on innovations in Africa: progress report. Geneva, Switzerland: WHO, 2015. http://apps.who.int/iris/bitstream/10665/198065/1/9789241509824_eng.pdf/en/ Accessed 14 March 2016. [Google Scholar]
- 8.Ciaranello AL, Park JE, Ramirez-Avila L, Freedberg KA, Walensky RP, Leroy V. Early infant HIV-1 diagnosis programs in resource-limited settings: opportunities for improved outcomes and more cost-effective interventions. BMC Med 2011; 9:59. [DOI] [PMC free article] [PubMed] [Google Scholar]
- 9.Lilian RR, Johnson LF, Moolla H, Sherman GG. A mathematical model evaluating the timing of early diagnostic testing in HIV-exposed infants in South Africa. J Acquir Immune Defic Syndr 2014; 67:341–8. [DOI] [PubMed] [Google Scholar]
- 10.Hassan AS, Sakwa EM, Nabwera HM et al. Dynamics and constraints of early infant diagnosis of HIV infection in rural Kenya. AIDS Behav 2012; 16:5–12. [DOI] [PMC free article] [PubMed] [Google Scholar]
- 11.Woldesenbet SA, Jackson D, Goga AE et al. Missed opportunities for early infant HIV diagnosis: results of a national study in South Africa. J Acquir Immune Defic Syndr 2015; 68:e26–32. [DOI] [PMC free article] [PubMed] [Google Scholar]
- 12.Lilian RR, Kalk E, Technau KG, Sherman GG. Birth diagnosis of HIV infection in infants to reduce infant mortality and monitor for elimination of mother-to-child transmission. Pediatr Infect Dis J 2013; 32:1080–5. [DOI] [PubMed] [Google Scholar]
- 13.Lilian RR, Kalk E, Bhowan K et al. Early diagnosis of in utero and intrapartum HIV infection in infants prior to 6 weeks of age. J Clin Microbiol 2012; 50:2373–7. [DOI] [PMC free article] [PubMed] [Google Scholar]
- 14.Mallampati D, Hannaford A, Sugandhi N, Markby J, Penazzato M. The performance of virological testing for early infant diagnosis: A systematic review In: International AIDS Society Conference, Vancouver, Canada, 2015. http://www.who.int/hiv/pub/posters/poster_08.pdf?ua=1 Accessed 5 October 2015. [DOI] [PubMed] [Google Scholar]
- 15.Provincial Government of the Western Cape Department of Health. The Western Cape consolidated guidelines for HIV treatment: Prevention of mother-to-child transmission of HIV (PMTCT), children, adolescents and adults. Cape Town: Western Cape Government Health; 2015. https://www.westerncape.gov.za/sites/www.westerncape.gov.za/files/the-western-cape-consolidated-guidelines-for-hiv-treatment-2015-v26012016.pdf Accessed 15 March 2016. [Google Scholar]
- 16.World Health Organization (WHO-CHOICE). Prices for hospitals and health centers. Geneva, Switzerland: WHO, 2016. http://www.who.int/choice/en/ Accessed 7 July 2016. [Google Scholar]
- 17.The World Bank. GDP per capita: Data by country. 2015. http://data.worldbank.org/indicator/NY.GDP.PCAP.CD Accessed 7 June 2016.
- 18.Revill P, Walker S, Madan J et al. Using cost-effectiveness thresholds to determine value for money in low- and middle-income country healthcare systems: Are current international norms fit for purpose? York, United Kingdom: Center for Health Economics, University of York, 2014. https://www.york.ac.uk/media/che/documents/papers/researchpapers/CHERP98_costeffectiveness_thresholds_value_low_middle_income_countries.pdf Accessed 7 November 2014.
- 19.Marseille E, Larson B, Kazi DS, Kahn JG, Rosen S. Thresholds for the cost-effectiveness of interventions: alternative approaches. Bull World Health Organ 2015; 93:118–24. [DOI] [PMC free article] [PubMed] [Google Scholar]
- 20.Ciaranello AL, Morris BL, Walensky RP et al. Validation and calibration of a computer simulation model of pediatric HIV infection. PLoS One 2013; 8:e83389. [DOI] [PMC free article] [PubMed] [Google Scholar]
- 21.Ciaranello AL, Doherty K, Penazzato M et al. Cost-effectiveness of first-line antiretroviral therapy for HIV-infected African children less than 3 years of age. AIDS 2015; 29:1247–59. [DOI] [PMC free article] [PubMed] [Google Scholar]
- 22.World Health Organization (WHO). Guideline on when to start antiretroviral therapy and on pre-exposure prophylaxis for HIV. Geneva, Switzerland: WHO, 2015. http://apps.who.int/iris/bitstream/10665/186275/1/9789241509565_eng.pdf Accessed 3 February 2016. [PubMed] [Google Scholar]
- 23.Ciaranello AL, Lu Z, Ayaya S et al. Incidence of WHO Stage 3 and 4 events, tuberculosis, and mortality in untreated, HIV-infected children enrolling in care before 1 year of age: an IeDEA (International Epidemiologic Databases to Evaluate AIDS) East Africa regional analysis. Pediatr Infect Dis J 2014; 33:623–9. [DOI] [PMC free article] [PubMed] [Google Scholar]
- 24.Iliff PJ, Piwoz EG, Tavengwa NV et al. Early exclusive breastfeeding reduces the risk of postnatal HIV-1 transmission and increases HIV-free survival. AIDS 2005; 19:699–708. [DOI] [PubMed] [Google Scholar]
- 25.World Health Organization (WHO). New strategies for infant HIV diagnosis: expert review meeting. Geneva, Switzerland: WHO, 2013. [Google Scholar]
- 26.Violari A, Lindsey JC, Hughes MD et al. Nevirapine versus ritonavir-boosted lopinavir for HIV-infected children. N Engl J Med 2012; 366:2380–9. [DOI] [PMC free article] [PubMed] [Google Scholar]
- 27.Palumbo P, Lindsey JC, Hughes MD et al. Antiretroviral treatment for children with peripartum nevirapine exposure. N Engl J Med 2010; 363:1510–20. [DOI] [PMC free article] [PubMed] [Google Scholar]
- 28.Babiker A, Castro nee Green H, Compagnucci A et al. First-line antiretroviral therapy with a protease inhibitor vs non-nucleoside reverse transcriptase inhibitor and switch at higher vs low viral load in HIV-infected children: an open-label, randomised phase 2/3 trial. Lancet Infect Dis 2011; 11:273–83. [DOI] [PMC free article] [PubMed] [Google Scholar]
- 29.Losina E, Yazdanpanah Y, Deuffic-Burban S et al. The independent effect of highly active antiretroviral therapy on severe opportunistic disease incidence and mortality in HIV-infected adults in Côte d'Ivoire. Antivir Ther 2007; 12:543–51. [PMC free article] [PubMed] [Google Scholar]
- 30.Holmes CB, Wood R, Badri M et al. CD4 decline and incidence of opportunistic infections in Cape Town, South Africa: Implications for prophylaxis and treatment. J Acquir Immune Defic Syndr 2006; 42:464–9. [DOI] [PubMed] [Google Scholar]
- 31.Cleary S, Chitha W, Jikwana S, Okorafor OA, Boulle A. Health systems trust: South African health review. In: Ijumba PBP, ed. Durban 2005. http://www.healthlink.org.za/publications/682 Accessed 7 July 2017. [Google Scholar]
- 32.Clinton Health Access Initiative. Antiretroviral (ARV) ceiling price list. 2015. http://www.clintonhealthaccess.org/content/uploads/2016/01/2015-CHAI-ARV-Reference-Price-List.pdf Accessed 7 July 2016.
- 33.Doherty K, Essajee S, Penazzato M, Holmes C, Resch S, Ciaranello AL. Estimating age-based antiretroviral therapy costs for HIV-infected children in resource-limited settings based on World Health Organization weight-based dosing recommendations. BMC Health Services Research 2014; 14:201. [DOI] [PMC free article] [PubMed] [Google Scholar]
- 34.Thomas TK, Masaba R, Borkowf CB et al. Triple-antiretroviral prophylaxis to prevent mother-to-child HIV transmission through breastfeeding--the Kisumu Breastfeeding Study, Kenya: a clinical trial. PLoS Med 2011; 8:e1001015. [DOI] [PMC free article] [PubMed] [Google Scholar]
- 35.Bassett IV, Giddy J, Nkera J et al. Routine voluntary HIV testing in Durban, South Africa: the experience from an outpatient department. J Acquir Immune Defic Syndr 2007; 46:181–6. [DOI] [PMC free article] [PubMed] [Google Scholar]
- 36.Republic of South Africa Department of Health. National consolidated guidelines for the prevention of mother-to-child transmission of HIV (PMTCT) and the management of HIV in children, adolescents, and adults. Pretoria, South Africa: Republic of South Africa Department of Health, 2014. http://www.sahivsoc.org/upload/documents/HIV%20guidelines%20_Jan%202015.pdf Accessed 15 June 2016. [Google Scholar]
- 37.Sherman GG, Matsebula TC, Jones SA. Is early HIV testing of infants in poorly resourced prevention of mother to child transmission programmes unaffordable? Trop Med Int Health 2005; 10:1108–13. [DOI] [PubMed] [Google Scholar]
- 38.Becquet R, Marston M, Dabis F et al. Children who acquire HIV infection perinatally are at higher risk of early death than those acquiring infection through breastmilk: a meta-analysis. PLoS One 2012; 7:e28510. [DOI] [PMC free article] [PubMed] [Google Scholar]
- 39.Ciaranello AL, Perez F, Keatinge J et al. What will it take to eliminate pediatric HIV? Reaching WHO target rates of mother-to-child HIV transmission in Zimbabwe: a model-based analysis. PLoS Med 2012; 9:e1001156. [DOI] [PMC free article] [PubMed] [Google Scholar]
- 40.Thomas LS. Costing of HIV/AIDS services at a tertiary level hospital in Gauteng Province. Witwatersrand, South Africa: Faculty of Health Sciences, University of Witwatersrand, 2006.
- 41.World Health Organization (WHO). WHO-CHOICE unit cost estimates for service delivery. Geneva, Switzerland: WHO, 2016. http://www.who.int/choice/costs/en/ Accessed 7 July 2016. [Google Scholar]
- 42.Hsiao NY, Stinson K, Myer L. Linkage of HIV-infected infants from diagnosis to antiretroviral therapy services across the Western Cape, South Africa. PLoS One 2013; 8:e55308. [DOI] [PMC free article] [PubMed] [Google Scholar]
- 43.Maritz J, Hsiao N, Preiser W, Myer L. Low uptake of routine infant diagnostic testing following HIV PCR testing at birth In: Conference on Retroviruses and Opportunistic Infections, Boston, Massachusetts, 2016. http://www.croiconference.org/sessions/low-uptake-routine-infant-diagnostic-testing-following-hiv-pcr-testing-birth Accessed 16 March 2016. [Google Scholar]
- 44.Hunink M, Glasziou P, Siegel J, et al. Decision making in health and medicine: integrating evidence and values. Cambridge: Cambridge University Press, 2003. [Google Scholar]
- 45.Goga AE, Jackson DJ, Singh MCL, for the SAPMTCTE study group. Early (4–8 weeks postpartum) population-level effectiveness of WHO PMTCT Option A, South Africa, 2012–2013. Cape Town, South Africa: South African Medical Research Council and National Department of Health of South Africa, 2012. http://www.mrc.ac.za/healthsystems/SAPMTCTEReport2012.pdf Accessed 7 July 2016. [Google Scholar]
- 46.Finocchario-Kessler S, Odera I, Okoth V et al. Lessons learned from implementing the HIV infant tracking system (HITSystem): A web-based intervention to improve early infant diagnosis in Kenya. Healthc (Amst) 2015; 3:190–5. [DOI] [PMC free article] [PubMed] [Google Scholar]
- 47.Collins IJ, Cairns J, Ngo-Giang-Huong N et al. Cost-effectiveness of early infant HIV diagnosis of HIV-exposed infants and immediate antiretroviral therapy in HIV-infected children under 24 months in Thailand. PLoS One 2014; 9:e91004. [DOI] [PMC free article] [PubMed] [Google Scholar]
- 48.Rollins N, Mzolo S, Moodley T, Esterhuizen T, van Rooyen H. Universal HIV testing of infants at immunization clinics: an acceptable and feasible approach for early infant diagnosis in high HIV prevalence settings. AIDS 2009; 23:1851–7. [DOI] [PubMed] [Google Scholar]
Associated Data
This section collects any data citations, data availability statements, or supplementary materials included in this article.