ABSTRACT
We investigated the cytotoxic interactions of romidepsin, a histone deacetylase inhibitor, and lenalidomide, an immunomodulatory agent, in a T-cell lymphoma preclinical model. Hut-78 and Karpas-299 cells were treated with romidepsin and lenalidomide alone and in combination. The interaction between romidepsin and lenalidomide was evaluated by the Chou–Talalay method, and cell viability and clonogenicity were also evaluated. Apoptosis, reactive oxygen species (ROS) levels, and cell cycle distribution were determined by flow cytometry. ER stress, caspase activation, and the AKT, MAPK/ERK, and STAT-3 pathways were analyzed by Western blot. Combination treatment with romidepsin and lenalidomide had a synergistic effect in Hut-78 cells and an additive effect in Karpas-299 cells at 24 hours and did not decrease the viability of normal peripheral blood mononuclear cells. This drug combination induced apoptosis, increased ROS production, and activated caspase-8, −9, −3 and PARP. Apoptosis was associated with increased hallmarks of ER stress and activation of UPR sensors and was mediated by dephosphorylation of the AKT, MAPK/ERK, and STAT3 pathways.The combination of romidepsin and lenalidomide shows promise as a possible treatment for T-cell lymphoma. This work provides a basis for further studies.
KEYWORDS: Lenalidomide, romidepsin, synergistic interaction, T-cell lymphoma, tumor cell death
Introduction
T-cell lymphomas (TCLs) comprise 10–20% of all non-Hodgkin lymphomas (NHLs). TCLs are classified into 22 subtypes by the 2008 WHO classification based on their clinicopathologic characteristics, and they comprise a various group of hematologic disease with unfortunate prognosis.1 Ordinary treatment do not generally provide satisfactory outcomes, and the majority of patients relapse. Epigenetic processes, which modify the phenotype without changing the genotype, are often altered in cancer cells.2 Epigenetic DNA and chromatin modifications include methylation, acetylation, phosphorylation, and ubiquitination. Histone acetylation is related to activation of gene transcription, whereas deacetylation is linked with transcriptional repression.3,4 The 2 processes are catalyzed by specific enzymes, namely histone acetyltransferases (HATs) and histone deacetylases (HDACs).4 HDACs enzymatically remove the acetyl group from histones and control gene expression.4 HDAC inhibitors (HDACis), which are newly emerging cancer therapeutics,5 modify genes that control cell growth and apoptosis, trigger the generation of reactive oxygen species (ROS), regulate the MAPK pathway and induce the acetylation of cytoplasmic proteins.5,6 Clinical trials have been conducted for HDACis for the cure of cutaneous TCL (CTCL), peripheral TCL (PTCL) and Hodgkin disease.7,8 Romidepsin, also called FK228 and Istodax®, is a potent HDACi with high inhibitory activity for class I HDACs.9 Romidepsin was the first HDACi to show anti-tumor activity in patients10 and has broad biological effects: it induces apoptosis, cell cycle arrest and it alters gene expression in a diversity of tumor, including TCL10,11. HDACis can be used in combination with different cytotoxic drug or anti-angiogenesis drugs.12
Lenalidomide, also called CC-5013 and Revlimid®, is a second-generation immunomodulatory drug (IMiD) and thalidomide analog that has antiangiogenic, antitumorigenic, and immunomodulatory activity.13,14 The use of lenalidomide in proliferative neoplasms has increased recently due to the agent's success in multiple myeloma (MM) and myelodysplasia (MDS). In these cancers, it alters immune homeostasis and modulates inflammation within the bone marrow microenvironment. Lenalidomide treatment is effective in patients with chronic lymphocytic leukemia (CLL),15 non-Hodgkin lymphoma,16 and CTCL.17
The rationale for using drug combinations is to obtain additive or synergistic effects, thus maximizing the total dose intensity, enhancing anticancer activities, and increasing patient survival.
Here we investigated combination therapy with 2 anticancer compounds that act through different mechanisms. The present study aimed to define the in vitro effects of romidepsin alone and in combination with low-dose lenalidomide in TCL cell lines and to investigate whether combination treatment could modulate apoptosis and cell viability.
Results
Romidepsin and lenalidomide as single agents
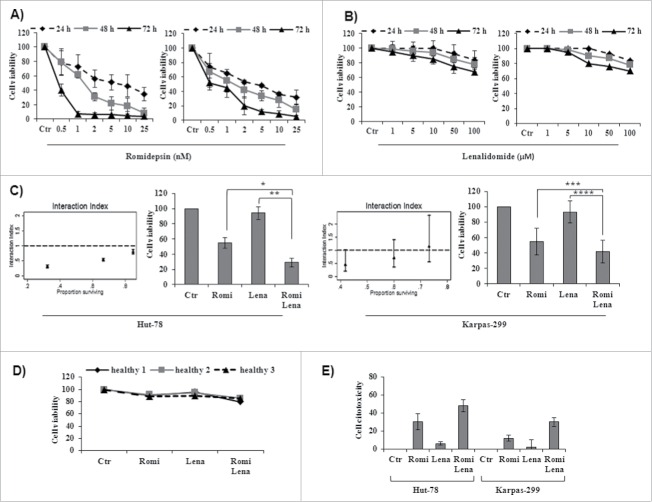
Romidepsin potently inhibited cell viability in both cell lines in a time- and dose-dependent manner. The IC50 ranged from 0.038 to 6.36 nM for Hut-78 cells and from 0.44 to 3.87 for Karpas-299 cells (Table 1). Important inhibition of cell vitality was evident after 48 h of incubation with romidepsin by MTT assay (Fig. 1A). Treatment with lenalidomide slightly inhibited cell viability even after 72 h of treatment but did not reach the IC50 (Fig. 1B).
Table 1.
IC50 values for romidepsin in T-lymphoma cell lines. Hut-78 and Karpas-299 cells were treated with romidepsin at a range of concentrations from 1 to 25 nM for 24, 48, and 72 hours. The IC50 values were calculated using the MTT assay. CI95%: 95% confidence interval. The values represent 3 independent experiments.
| Time | |||
|---|---|---|---|
| T - cell lines | 24 h | 48 h | 72 h |
| Hut-78 | |||
| IC50 | 6.36 | 1.54 | 0.038 |
| CI95% | (5.39–7.32) | (1.45–1.63) | (0.002; 0.077) |
| Karpas-299 | |||
| IC50 | 3.87 | 1.49 | 0.44 |
| CI95% | (3.68–4.06) | (1.39–1.59) | (0.40–0.49) |
Figure 1.
(A) Romidepsin alone inhibited cell viability in a time- and dose-dependent manner in Hut-78 and Karpas-299 cells (see Table 1 for IC50 values of romidepsin). (B) Lenalidomide alone slightly inhibited cell viability in TCL cell lines, but did not reach the IC50 even after 72 h of treatment. (C) Isobologram analysis of combination treatment with both romidepsin (0.5, 1, 2.5 nM) and lenalidomide (2, 4, 10 µM) for 24 hours (see Table 2 for combination index values) and cell viability from cell lines treated with romidepsin (2.5 nM) and lenalidomide (10 µM) either alone and in combination for 24 hours (*P < 0.003; **P < 0.001; ***P < 0.02; ****P < 0.002). (D) Cell viability from PBMCs from 3 healthy subjects treated with romidepsin (2.5 nM) and lenalidomide (10 µM) alone and in combination. (E) Cytotoxicity of TCL cells after treatment with romidepsin (2.5 nM) for 6 hours followed by washout and the addition of lenalidomide (10 µM) for 24 hours.
Drug combination shows synergistic effects in Hut-78 cells and additive effects in Karpas-299 cells
Cell viability decreased significantly after treatment with both drugs compared with treatment with each drug alone. Indeed, treatment with both romidepsin and lenalidomide showed synergistic effects in Hut-78 cells, with a CI <1 after 24 hours (0.14–0.84) (Table 2 and Fig. 1C, left panel). In Karpas-299 cells, treatment with romidepsin (1 nM, 2.5 nM) plus lenalidomide (4 μM, 10 μM) showed additive effects, with CI values of 0.95 and 1.05, respectively (Table 2 and Fig. 1C, right panel). No cytoxicity was observed in normal PBMCs (Fig. 1D). Sequential treatment with romidepsin (2.5 nM) for 6 hours followed by washout and the addition of lenalidomide (10 µM) for 24 hours showed cytotoxic effects but did not reach a CI <1 . This confirmed that the cytotoxicity of romidepsin alone was enhanced by combining it with lenalidomide (Fig. 1E). On the other hand, sequential treatment with lenalidomide (10 µM) for 6 hours followed by washout and the addition of romidepsin (2.5 nM) for 24 hours did not show significant cytotoxic effects (data not shown). Based on the results of the MTT assay and the isobologram analysis, we chose to use romidepsin (2.5 nM) and lenalidomide (10 µM) for the following experiments.
Table 2.
Isobologram analysis of treatment with romidepsin and lenalidomide. Hut-78 and Karpas-299 cells were cultured with romidepsin (0.5 nM, 1 nM, and 2.5 nM) and lenalidomide (2 µM, 4 µM, and 10 µM). Synergism, additivity, or antagonism were quantified by determining the combination index (CI) as calculated.
| T - cell lines | Romidepsin(nM) | Lenalidomide(µM) | CI |
|---|---|---|---|
| Hut-78 | 0.5 | 2 | 0.84 |
| 1 | 4 | 0.44 | |
| 2.5 | 10 | 0.14 | |
| Karpas-299 | 0.5 | 2 | 1.31 |
| 1 | 4 | 0.95 | |
| 2.5 | 10 | 1.05 |
Drug combination affects the clonogenic survival and overcomes the protective effect of BM-MSCs
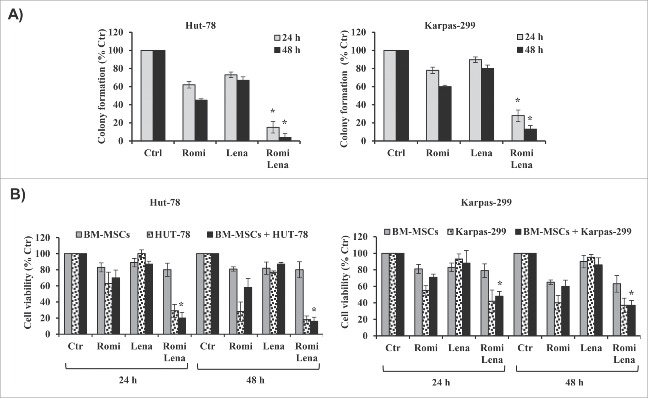
Combination treatment with romidepsin and lenalidomide for 24 hours reduced clonogenic survival to approximately 15% in Hut-78 cells and to 28% in Karpas-299 cells compared to control cultures. After 48 hours of treatment with the 2 drugs, there were additional reductions in clonogenic survival to 4% in Hut-78 cells and to 13% in Karpas-299 cells (Fig. 2A). Sequential treatment with romidepsin followed by washout and the addition of lenalidomide for 24 h–48 h reduced clonogenic survival to between 80% and 89%. Conversely, sequential treatment with lenalidomide followed by washout and the addition of romidepsin for 24 h–48 h did not reduce clonogenic survival (data not shown). These observations support the CI results. Given that the BM microenvironment promotes proliferation and drug resistance, we next examined whether combination treatment with romidepsin and lenalidomide induced cell death in the presence of BM-MSCs. Combination treatment had minimal or no cytotoxic effects on BM-MSCs and decreased the viability of Hut-78 and Karpas-299 cells co-cultured with BM-MSCs, indicating that combination treatment overcomes the anti-apoptotic effects of the bone marrow microenvironment (Fig. 2B). The synergistic and additive effects of combination treatment in the presence of BM-MSCs were confirmed in the Hut-78 and Karpas-299 cell lines.
Figure 2.
(A) Drug combination for 24–48 hours reduced clonogenic survival in TCL cells compared to control cultures (*P < 0.001 vs. romidepsin and lenalidomide alone). (B) Drug treatment reduced the viability of TCL cells that were co-cultured with BM-MSCs (*P < 0.001 vs. romidepsin or lenalidomide alone).
Apoptosis induced by drug combination is mediated by caspase activation and by Bcl-2 family
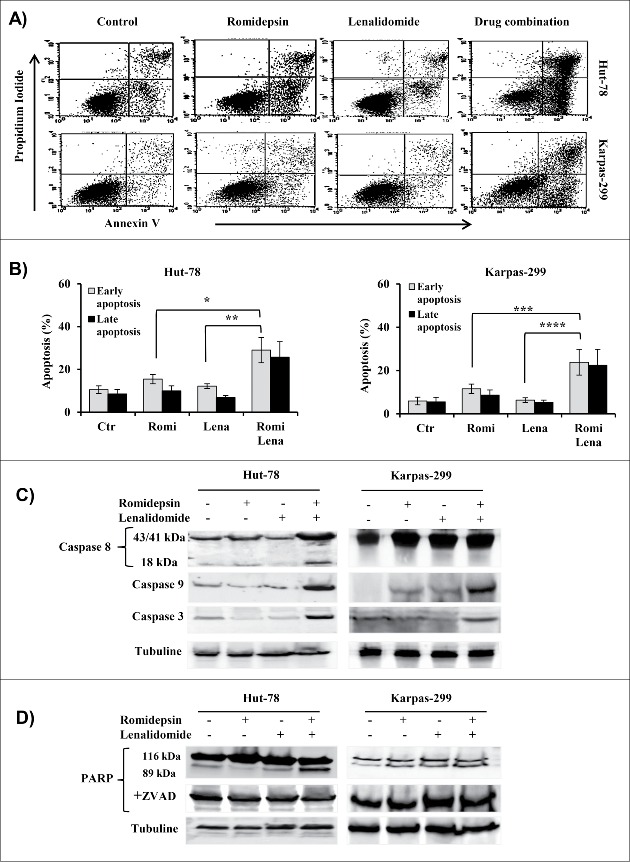
In both TCL cell lines, compared to either drug alone, the combination treatment induced apoptosis. The fraction of annexin V-positive cells (early and late apoptosis) after 24 h with romidepsin or lenalidomide or with both increased to 25%, 18%, and 65%, respectively, in Hut-78 cells and to 20%, 11%, and 46%, respectively, in Karpas-299 cells (Fig. 3A, B). No caspase-8 activation was induced in Karpas-299 cells after 24 h of combination treatment, but caspase-8 activation was observed in Hut-78 cells (Fig. 3C). The activation of caspase-9 in both cell lines indicated the participation of the mitochondrial apoptotic pathway (Fig. 3C). Finally, romidepsin/lenalidomide treatment resulted in increased levels of the caspase-3 (Fig. 3C) and the cleavage of the PARP enzyme confirms the activation of the apoptotic pathway. The cleavage of PARP was annulled by Z-VAD, confirming that the observed apoptosis was caspase-dependent (Fig. 3D).
Figure 3.
(A and B) Flow cytometry showed an increase in apoptosis after 24 h that was induced by combination treatment (*P < 0.005; **P < 0.001; ***P < 0.02; ****P < 0.002). (C and D) Western blot analysis of caspase−8, −9, −3 and PARP in cellular extracts from Hut-78 and Karpas-299 cells cultured with or without Z-VAD-fmk (D).
Combination treatment did not modify Bcl-2 expression (data not shown), but reduced Bcl-xL and Mcl-1 expression (Fig. 4) and augmented the expression of Bax, Bim, Noxa, Bad112 and Bad136 (Fig. 4). Taken together, the results indicate that combination treatment with romidepsin and lenalidomide triggers the mitochondria-mediated apoptotic signaling pathway.
Figure 4.
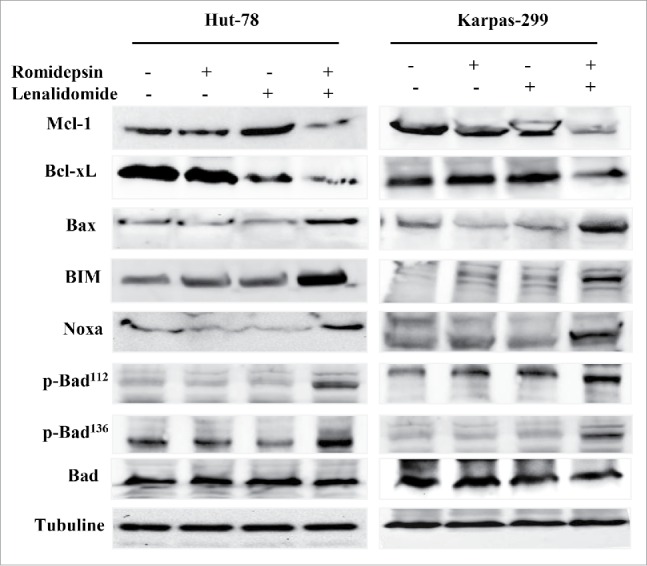
Western blots showing the downregulation of the anti-apoptotic proteins Mcl-1 and Bcl-xL and the phosphorylation of the pro-apoptotic proteins Bax, Bim, Noxa, and Bad.
Apoptosis induced by drug combination depends on ROS generation and correlates with ER stress and unfolded protein response (UPR) signaling
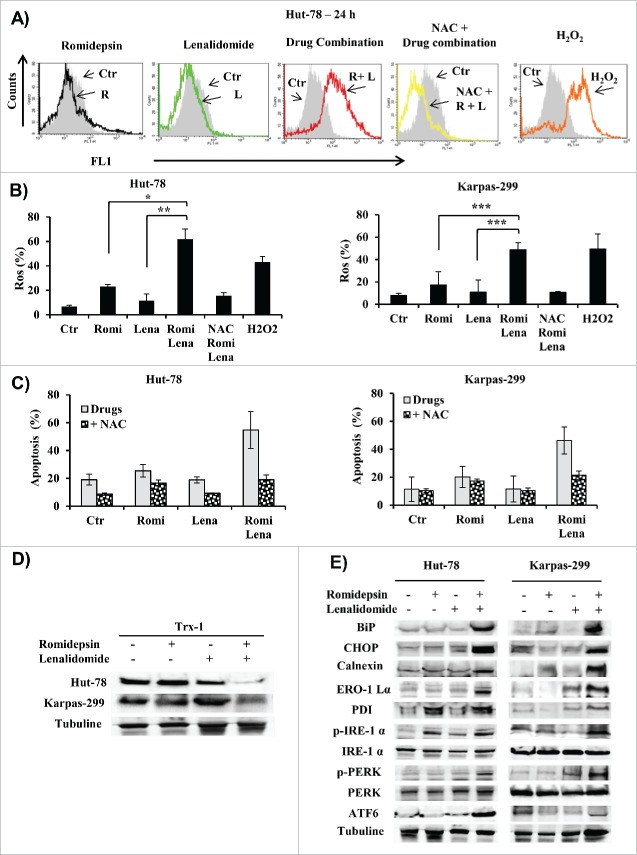
Mitochondria represent the main resource of ROS in cells undergoing apoptosis.18,19 Accordingly, we evaluated ROS generation in cells treated with a combination of romidepsin and lenalidomide. Combination treatment induced ROS generation in a higher percentage of cells (61.8% of Hut-78 cells and 53% of Karpas-299 cells) than either romidepsin alone (23% of Hut-78 cells and 17% of Karpas-299 cells) or lenalidomide alone (11% of both Hut-78 and Karpas-299 cells) (Fig. 5A, B). Co-administration of the antioxidant NAC with the drugs blocked ROS generation (Fig. 5A, B) and reduced apoptosis from 55% to 16% in Hut-78 cells and from 46% to 21% in Karpas-299 cells (Fig. 5C) suggesting that apoptosis was at least partly ROS-mediated. Apoptosis and ROS generation induced by combination treatment were associated with a decrease in thioredoxin-1 (Trx1) expression (Fig. 5D). Endoplasmic reticulum (ER) stress-induced apoptosis is activated by ROS generation,20 and HDACis induce the unfolded protein response (UPR) and ER stress.21 In this context, we tested whether induction of ER stress was associated with the death of TCL cells due to treatment with romidepsin/lenalidomide. The apoptosis induced by combination treatment correlated with increased expression of IRE1-α, ATF6, and PERK, which are 3 ER stress sensors, and with the expression of chaperone proteins such as calnexin and protein disulfide isomerase (PDI). Hallmarks of UPR as BIP and CHOP, were also activated (Fig. 5E).
Figure 5.
(A) Representative flow cytometry histograms showed ROS generation in Hut-78 cells. (B) Percentage of cells with increased ROS levels in Hut-78 and Karpas-299; NAC was used as antioxidant and H2O2 as a positive control (*P < 0.002; **P < 0.012; ***P < 0.003). (C) Percentage of apoptotic cells pre-treated with NAC and then cultured with romidepsin and lenalidomide either alone and in combination. (D and E) Cellular extracts from Hut-78 and Karpas-299 cells treated with romidepsin (2.5 nM) and lenalidomide (10 µM) alone and in combination for 24 hours. Whole-cell lysates were subjected to protein gel blotting using the indicated antibodies.
Romidepsin/lenalidomide on the cell cycle and on proteins involved in cell cycle regulation
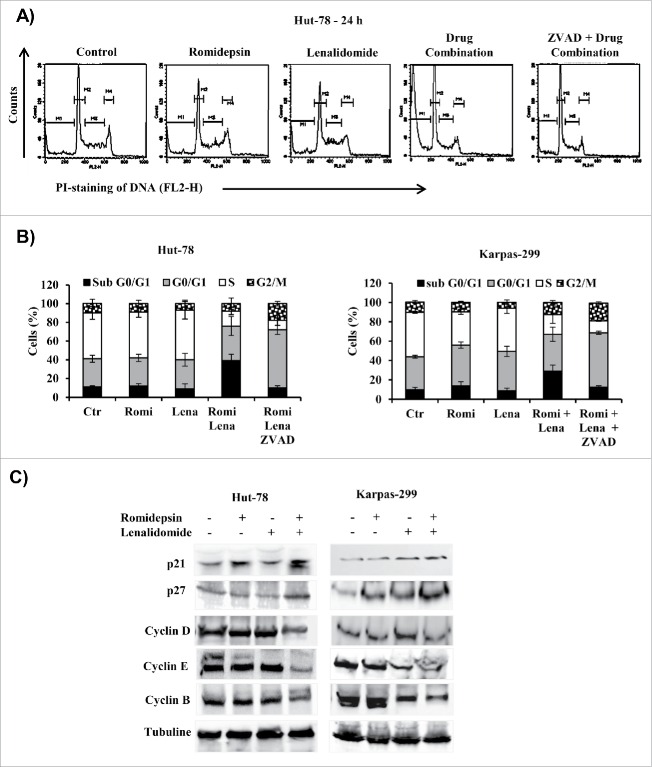
Treatment with either romidepsin or lenalidomide alone did not significantly affect the cell cycle distribution, but combination treatment had a modest effect on cell cycle phases. Compared to the effects of treatment with either drug alone, combination treatment slightly increased the fraction of cells in G0/G1, decreased the S phase and strongly increased the percentage of cells in sub-G0/G1 phase (Fig. 6A, B). These findings were confirmed by increased annexin V staining as measured by flow cytometry and the inhibition of apoptosis by Z-VAD caused cell cycle arrest at G0/G1 phase and decreased the percentage of cells in S phase (Fig. 6B). Combination treatment down-regulated the expression of cyclins D, E, and B, which are positive regulators of cell cycle progression, and upregulated the CDK inhibitors p21 and p27 (Fig. 6C).
Figure 6.
(A) Representative cell cycle of Hut-78 cells. The M1, M2, M3, and M4 bars indicate the sub-G0/G1, G0/G1, S, and G2/M phases, respectively. (B) Cell cycle distribution (%) of TCL cells after 24 hours of treatment with drug combination. (C) Cellular extracts from Hut-78 and Karpas-299 cells treated with the drugs alone and in combination for 24 hours. Whole-cell lysates were subjected to western blotting using the indicated antibodies.
Drug combination inactivates the AKT, MAPK, and STAT3 pathways
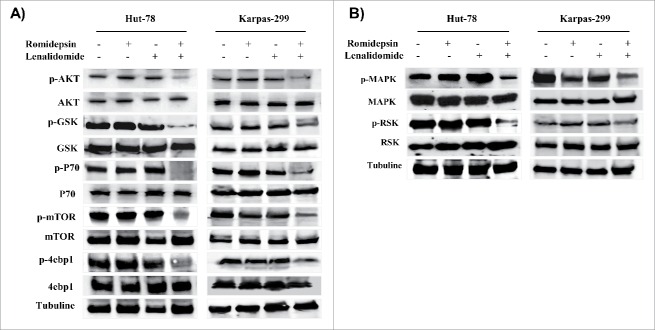
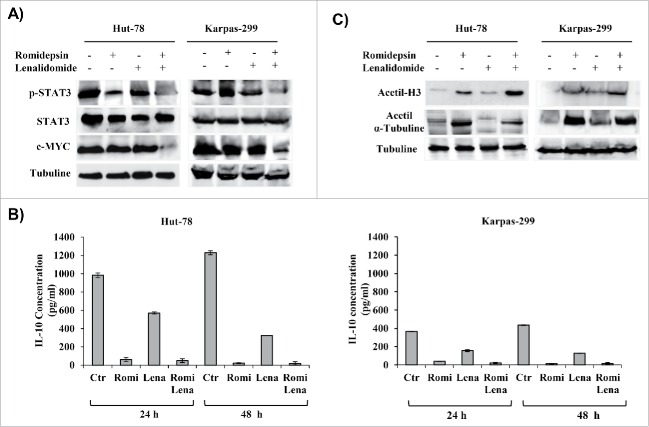
The PI3K/AKT pathway is implicated in the signaling cascade that controls the survival of T-lymphocytes.22 Compared with treatment with each drug alone, combination treatment with romidepsin and lenalidomide for 24 hours downregulated the phosphorylation of AKT and the downstream proteins, GSK3-β, p70S6, mTOR, and 4EBP1 (Fig. 7A). The MAPK/ERK pathway is part of a signaling cascade that controls the cellular response to cytokines and stress, and it has been associated to the signal transmission induced by ROS.23 Each drug alone has not reduced the MAPK/ERK pathway while combination treatment with romidepsin and lenalidomide downregulated the MAPK/ERK pathway (Fig. 7B). STAT3 transcription factor is associated to tumor cell growth and to cytokine expression in malignant cells.24 Western blotting results showed that the expression levels of the p-STAT3 protein decreased in both TCL cell lines compared with untreated controls (Fig. 8A). A downstream target of STAT, c-myc, was downregulated after 24 hours of combination treatment, further confirming the inhibition of STAT3 activity (Fig. 8A). The transcription factor c-myc plays an important role in hematologic malignancies.25
Figure 7.
(A and B), Western blots of cellular extracts from Hut-78 and Karpas-299 treated with the drugs alone or in combination for 24 hours. Whole-cell lysates were subjected to Western blotting using the indicated antibodies.
Figure 8.
(A) Whole-cell lysates were subjected to Western blotting using the indicated antibodies. (B) The effect of drug combination on IL-10 secretion in TCL cell lines. (C) Cellular extracts from Hut-78 and Karpas-299 cells treated with the drugs alone and in combination for 24 hours. Whole-cell lysates were subjected to Western blotting using the indicated antibodies.
Combination treatment affects IL-10 secretion
STAT3 is a key regulator of IL-10 in TCL cells.26 IL-10 may be connected with the development of T-cell NHLs, and it may be involved in a rescue effect that protects T cells from apoptotic cell death linked with upregulation of Bcl-2 expression.27 Romidepsin alone or in combination with lenalidomide significantly reduced IL-10 secretion by Hut-78 and Karpas-299 cells (Fig. 8B).
Romidepsin alone confirmed its state of acetylation, an effect that is not modified by lenalidomide
The biological effects of HDACis are thought to be associated with modification of the acetylation state of histones and α-tubulin. Western blot analysis revealed that romidepsin treatment clearly increased the acetylation of histone H3 and α-tubulin in TCL cells, but treatment with lenalidomide did not increase acetylation (Fig. 8C).
Discussion
Tumor cells are influenced by many signaling pathway that take to the oncogenic process, and most drugs that target a single signaling pathway have low response rates. Targeting multiple signaling pathways using more than one drug often enhances the anti-tumor effects. Romidepsin has antitumor activity in both in vitro and in vivo in tumor xenograft models. A number of phase I/II and III clinical trials are underway with romidepsin to test its effects in patients with colorectal, renal, and breast neoplasms and sarcomas and in patients with hematological malignancies.28
Lenalidomide has pleiotropic properties and is highly effective for treating a wide range of hematological malignancies. It has a low toxicity profile, and it directly inhibits the growth of tumor cells and alters their microenvironment by inducing tumor cell apoptosis and by downregulating the survival cytokines IL-6, IL-8, and IL-10.29 Current studies showed a new mechanism of action of lenalidomide. The drug binds to a E3 ubiquitin ligase cereblon complex (CRL4CRBN) and control its substrate specificity resulting in the proteasomal degradation of target proteins. The E3 ubiquitin ligase cereblon was identified as a molecular target that may underlie the effects of lenalidomide on tumor cells, as well as on cells in the tumor microenvironment. The drug binding to cereblon, induces the ubiquitination and subsequent proteasomal degradation of 2 transcription factors Ikaros (IKZF1) and Aiolos (IKZF3) killing malignant cell. As consequence of IKZF1 and IKZF3 degradation, IRF4 and MYC transcription decrease resulting in growth inhibition of multiple myeloma cells and de-repression of IL-2 in T cells. IKZF1 and IKZF3 are essential proteins for the antiproliferative effect of lenalidomide.30
Lenalidomide shows efficacy in patients with relapsed/refractory TCL.31,32 Despite the recent development of new drugs, TCL remains an incurable disease. Combination treatment with different classes of drugs that have non-overlapping toxicities might improve patient outcomes. Combining low doses of romidepsin with low doses of lenalidomide might therefore represent an opportunity to improve patient outcomes by overcoming drug resistance and improving the drug toxicity profile. We studied the cytotoxic effects of romidepsin in combination with lenalidomide in an in vitro TCL preclinical model. We first demonstrated that romidepsin alone decreased the viability of Hut-78 and Karpas-299 cells in a time- and dose-dependent manner. Lenalidomide alone slightly inhibited the growth of TCL cells without reaching the IC50, as described previously. However, after 24 hours of treatment, simultaneous combination treatment with romidepsin and lenalidomide increased cytotoxicity in TCL cells. The combination index analysis showed that simultaneous treatment with both drugs had a synergistic effect in Hut-78 cells and an additive effect in Karpas-299 cells in terms of its pro-apoptotic effects. Conversely, sequential treatment with the 2 drugs did not show synergistic effects. The concentrations of romidepsin and lenalidomide that showed synergistic effects did not have a toxic effect on normal mononuclear peripheral blood cells. These results were confirmed by clonogenic assays that showed that lenalidomide potentiates the efficacy of romidepsin. The ability of the 2 drugs to act in combination to enhance drug-induced cytotoxicity was related to activation of pro-apoptotic pathways. To evaluate whether the combination of drugs acted primarily via the intrinsic or extrinsic apoptotic cascade, we performed Western blot analysis to assess the activation status of caspase-9 and caspase-8. Our experiment showed that compared to the effects of treatment with single drugs, combination treatment with romidepsin and lenalidomide at low doses had pro-apoptotic effects in both TCL cells. The apoptotic pathway was determined by the cleavage of the PARP enzyme, and this activation was blocked by Z-VAD. The combination drug treatment induces caspase-dependent apoptosis and the induced apoptosis is mediated by activation of the intrinsic apoptotic pathway in both TCL cell lines and by activation of the extrinsic pathway in Hut-78 cells. Drug combination decreased the levels of the anti-apoptotic proteins Bcl-xL and Mcl-1. Upregulation of Bim by treatment with the 2 drugs along with the downregulation of anti-apoptotic proteins may shift the balance from pro-survival to pro-apoptosis, leading to enhanced cell death. Cancer cells, including the cells in hematological malignancies, have higher levels of ROS compared to normal cells33 and that HDAC inhibitors, including romidepsin, can induce the generation of ROS. Romidepsin/lenalidomide combination induced an additional increase in ROS generation respect to that seen with either agent alone. The increase of ROS production can favor to the synergistic activity in Hut-78 cells and the additive effects in Karpas-299 cells. The co-administration of NAC, a ROS scavenger, reduced the increased ROS levels induced by the drug combination and decreased apoptosis. This means that oxidative damage plays an important role in causing the cell death. Malignant cells work with a basal level of ROS mediated signaling and are very sensitive to increased ROS. The romidepsin/lenalidomide combination could cause intracellular ROS to accumulate to levels that exceeded the cells metabolic capabilities, thereby inducing cell death in malignant cells but not in normal cells. The ROS generation is not the results of mitochondrial damage because ROS generation can occur before the loss of outer mitochondrial membrane potential.34 An increase in ROS beyond a certain threshold would result in irreversible DNA damage, and this could explain the activation of apoptosis pathway.35 Our results showed that the apoptosis and ROS generation induced by the drug combination were associated with a decrease in Trx-1 expression. Trx inhibits both spontaneous and drug-induced apoptosis, stimulates tumor growth, and controls the activity of enzymes that counteract oxidative stress within the cell and that have antioxidant properties due to ROS scavenging.36-38 Trx-1 has been linked with aggressive tumor growth and unfortunate prognosis.39 Decreasing the levels of Trx in transformed cells increased their sensitivity to cell death after treatment with the drug combination. In addition to the above mechanism, apoptosis induced by combination treatment is associated with ER stress; notably, ER stress activates the UPR signaling pathway, which is involved in cell death and survival.40 Romidepsin and lenalidomide induced TCL cell death via a mechanism that was mediated by ER stress, as evidenced by increased levels of IRE1-α, ATF6, and PERK, which are hallmarks of ER stress. UPR sensors, BIP and CHOP proteins were activated. Studies suggest that, in tumor treatment, the intrinsic pathways for induction of apoptosis are activated by ER stress and AKT and MAPK signaling pathways involved in the cellular response to ER stress.41,42 The ER maintains a balance between protein synthesis and degradation, and breaking ER stability leads to the increase of unfolded proteins. The ER has a pool of molecular chaperone proteins, including calnexin and PDI. Calnexin is an ER membrane-associated calcium-binding protein that preserves synthetized glycoproteins inside the ER to guarantee correct folding and quality control. BiP is a key pro-survival pathway in the UPR and has a role in the folding and assembly. The separation of BiP by PERK, ATF-6 and IRE-1α, 3 ER transmembrane receptors, activates the UPR.43 PERK activates downstream CHOP expression, inducing apoptosis43. CHOP is an important mediator of apoptosis-ER-induced stress and is regularly produced at low levels in the cytoplasm, but is produced at high levels in response to stress of ER.44 CHOP is phosphorylated by MAPK family, which increases its transcriptional activity of many pro-apoptotic genes.44 Recently, Mounir et al. demonstrated that PERK is a substrate of Akt.45 The inactivation of PERK has profound effects in terms of promoting tumor death in response to the inhibition of the PI3K/Akt pathway by drugs.45 Our results confirmed that ER stress was triggered by combination treatment with romidepsin and lenalidomide. Combination drug treatment had a modest effect on cell cycle progression in both Hut-78 and Karpas-299 cells. However the “sub-G0/G1” peak, which corresponds to apoptotic cells, was induced in both TCL cell lines. Cell cycle arrest was observed when apoptosis was inhibited with Z-VAD. Drug combination induced a slight decrease in cyclin D and B levels that was accompanied by increases in p21 and p27 levels that negatively control cell cycle and are therefore relevant to proliferation inhibition in tumors46. The promoters for p21 and p27 transcription are controlled by their histone acetylation status, and they are frequently hypoacetylated in cancer disease.47 Our results showed increased levels of p21 and p27, and this could be a possible mechanism for tumor growth inhibition by the combination of romidepsin and lenalidomide. The AKT, MAPK and STAT pathways are the most important and intensively investigated signaling pathways. They play central roles in governing the cell survival and their dysregulation is related to the development of many diseases.24,48 Co-treatment with romidepsin and lenalidomide inactivated AKT as well as multiple downstream AKT targets and the MAPK/ERK signaling pathway. The drug combination also decreased STAT3 tyrosine phosphorylation, which in turn led to downregulation of c-myc, a STAT3 target. Activation of STAT3 has been described in CTCL and ALCL, and it may be directly involved in clinical progression.24 STAT3 overexpression is linked to cancer survival, and reduced cyclin D and CDK2 levels induce apoptosis in tumor cells.49 Romidepsin/lenalidomide decreased STAT3 and cyclin D levels in TCL cells. STAT3 is a key regulator of IL-10 in TCL cells.50 Accordingly, we examined whether IL-10 expression in TCL cells depended on STAT3 activity. One study reported that IL-10 may be linked with the evolution of T-cell NHLs,51 while another study showed that IL-10 plays a role in the rescue activity on T cells, protecting them from cell death connected upregulated Bcl-2 expression.52 IL-10, is a strong promoter of Bcl-2 expression,53 and could be involved in the apoptosis-related resistance mechanism of T-cell NHLs through a Bcl-2 mediated pathway.54 Our experiments showed that romidepsin alone and in combination with lenalidomide reduced IL-10 secretion.
The present results suggest that romidepsin interacts with lenalidomide in TCL cells, triggering downregulation of Mcl-1 and Bcl-xL and inactivation of the AKT, MAPK/ERK, and STAT3 signaling pathways. The drug combination induced ROS generation, ER stress, and UPR, which in turn led to cell death. Future studies are needed to determine the efficacy of combination regimens that include romidepsin.
Materials and methods
Reagents and cell culture
Romidepsin and lenalidomide were provided by the Celgene Corporation (San Diego, CA) and were dissolved in dimethylsulfoxide (DMSO, Sigma-Aldrich St.Louis, MO, USA) and stored at −20° C until use. The final concentration of DMSO, which was used as the vehicle control, did not exceed 0.01%. Hut-78, human CTCL, was purchased from the European Collection of Cell Cultures (ECACC). Karpas-299, human anaplastic large cell lymphoma (ALCL), was obtained from the German Collection of Microorganisms and Cell Cultures (DSMZ). Hut-78 and Karpas-299 cells were cultured in RPMI-1640 supplemented with 10% fetal bovine serum (FBS), 2 mM L-glutamine, and 100 U/mL penicillin and streptomycin at 37°C in a humidified atmosphere containing 5% CO2. Bone marrow mesenchymal stromal cells (BM-MSCs) were generated as described previously55. Adherent cells were cultured long-term and expanded in MEM medium supplemented with 20% FBS, 2 mM L-glutamine, and 100 U/mL penicillin and streptomycin at 37°C and 5% CO2. Peripheral blood mononuclear cells (PBMCs) were obtained from 3 healthy volunteers using the Ficoll-Hypaque technique. Healthy volunteer who took part in the study gave written informed consent and the protocol was approved by the local Institutional Review Board. All reagents were purchased from Euroclone.
Viability assay and evaluation of the effect of the drug combination
Hut-78 cells, Karpas-299 cells, and normal PBMCs were placed into 96-well plates at a concentration of 5 × 10⁴−1 × 10⁵ cells/well and incubated in triplicate with increasing concentrations of romidepsin (0.5–25 nM) and lenalidomide (1–100 µM) as single agents for 24–72 h to identify the IC50 values of each drug. In order to evaluate the synergistic and additive effects of the 2 drugs, serial dilutions of the 2 agents were assessed using concentrations lower than the IC50. Hut-78 and Karpas-299 cells were cultured with fixed doses of romidepsin (0.5 nM, 1 nM, and 2.5 nM) and lenalidomide (2 µM, 4 µM, and 10 µM). The combination index (CI), which was calculated by the Chou–Talalay equation, demonstrates synergistic effects with CI <1 , additive effects with CI = 1, and antagonism with CI >1.
We analyzed the drug combinations as follows: 1) simultaneous (combination) treatment with both drugs; 2) sequential drug treatment with either (a) treatment with romidepsin for 6 h, followed by 2 washes, followed by treatment with lenalidomide for 24 hours or (b) treatment with lenalidomide for 6 hours, followed by 2 washes, followed by treatment with romidepsin for 24 hours. Cell viability was evaluated by MTT colorimetric assay (CellTiter non-radioactive cell proliferation assay, Promega Corporation, Madison, USA) following the manufacturer's instructions.
Clonogenic assays
Hut-78 and Karpas-299 cells were cultured with romidepsin and lenalidomide alone and in combination in liquid culture for 24–48 hours, then collected and incubated in methylcellulose (StemCell, Vancouver, Canada) and maintained for 10 or 14 d. Growing colonies (>50 cells) were counted under a microscope.
Co-culture of TCL cell lines with BM-MSCs
BM-MSCs (n = 5000/well) were seeded in triplicate in 96-well plates and incubated for 48 hours to reach confluence. After 48 h, TCL cell lines were seeded at 2 × 10⁴ cells/well in the presence or absence of BM-MSCs. The next day, cells were treated with romidepsin (2.5 nM) and lenalidomide (10 µM) either alone or in combination. Non-adherent cells were collected 24 and 48 hours after addition of the drugs, and cell viability was evaluated.
Annexin V/propidium iodide assay
TCL cell lines (1 × 10⁶ cells/mL) were cultured for 24 hours with romidepsin (2.5 nM) and lenalidomide (10 µM) either alone or in combination. Apoptosis was quantified using the Annexin V-FITC and propidium iodide (PI) binding assay following the manufacturer's instructions (Miltenyi Biotec, Germany). The cells were then analyzed by fow cytometry (FACS Calibur, BD San Jose, CA, USA) and CellQuest data analysis software (BD, Franklin Lake, NJ, USA). Apoptotic cells were designated Annexin V+/PtdIns− or Annexin V+/PI+; these designations indicate early and late apoptosis, respectively. All experiments were performed in triplicate.
Analysis of Bcl-2 expression by flow cytometry
TCL cell lines (1 × 10⁶ cells/mL) were incubated in 6-well plates for 24–48 h with romidepsin (2.5 nM) and lenalidomide (10 µM) either alone or in combination. After treatment, the cells were fixed and permeabilized using the BD Cytofix/Cytoperm Kit™ (BD Biosciences, San Jose, CA, USA) according to the manufacturer's instructions. Cells were incubated with FITC-conjugated mouse anti-human Bcl-2 monoclonal antibody (BD Biosciences, San Jose, CA, USA), or FITC-conjugated mouse IgG1 monoclonal isotype control antibody (BD Biosciences, San Jose, CA, USA), then analyzed by fow cytometry. The experiment was performed in triplicate.
Measurement of reactive oxygen species (ROS) production
ROS production was analyzed using 2’,7’-dichloroflourescein diacetate (DCFH-DA; Sigma-Aldrich St. Louis, MO, USA) and was evaluated by quantifying the fluorescence. Cells treated for 24 hours, were incubated with 5 µM DCFH-DA in PBS at 37°C for 30 min. We used the free radical scavenger acetyl-l-cysteine (NAC) (Sigma-Aldrich St. Louis, MO, USA) for assess the role of ROS generation in apoptosis. Cells were pre-incubated with 12 mM NAC for 3 h followed by incubation with romidepsin and lenalidomide either alone or in combination. H2O2 was used as the positive control. The fluorescence intensity was read by flow cytometry on the FL1 channel within 45 min. ROS production was determined in gated live cells by comparing the intensity of fluorescence in treated vs. untreated cells. The data were analyzed by Cell Quest data analysis software.
Cell cycle analysis
TCL cells were cultured at 1 × 10⁶ cells/well for 24 hours with romidepsin (2.5 nM) and lenalidomide (10 µM) either alone or in combination. Cell cycle analysis was determined by flow cytometry as described previously.18
Western blot analysis
Cell pellets were resuspended in cold lysis buffer (Mammalian Cell Extraction Kit; Biovision Inc. CA, USA) following the manufacturer's instructions. Cell lysates (50–100 μg of protein) were loaded onto pre-cast 4%–20% (w/v) Miniprotean TGX Precast Gels (Bio-Rad, USA), subjected to electrophoresis, and electrotransferred onto nitrocellulose membranes (Bio-Rad, USA). The antibodies and supplemental western blot method are provided in the Supplementary Materials.
Measurement of IL-10
After treatment, the cells was centrifuged and the cell culture supernatants collected for IL-10 analysis. IL-10 expression was measured using IL-10–enzyme-linked immunosorbent assay (ELISA; R&D Systems, Minneapolis, USA) according to the manufacturer's instructions.
Statistical analysis, isobologram, and CI calculation
The efficacy of the drugs both alone and in combination, was studied using Calcusyn Software (Biosoft, Cambridge, UK). The CI and isobologram plot were calculated according to the Chou–Talalay method.56 All in vitro experiments were performed in triplicate and repeated at least 3 times, and a representative experiment was selected for the figures. Data are expressed as mean values ± standard error. Statistical differences between controls and drug-treated cells were determined by one-way analysis of variance (ANOVA), and p values <0 .05 were considered statistically significant. Data were analyzed using the Stata 8.2/SE package (StataCorp LP).
Supplementary Material
Disclosure of potential conflicts of interest
No potential conflicts of interest were disclosed.
Funding
This work was supported by a grant from the Celgene Corporation (San Diego, CA, USA), which provided romidepsin and lenalidomide for the in vitro studies.
References
- 1.Campo E, Swerdlow SH, Harris NL, Pileri S, Stein H, Jaffe ES. The 2008 WHO classification of lymphoid neoplasms and beyond: evolving concepts and practical applications. Blood 2011; 117:5019-32; PMID:21300984; http://dx.doi.org/ 10.1182/blood-2011-01-293050 [DOI] [PMC free article] [PubMed] [Google Scholar]
- 2.Sharma S, Kelly TK, Jones PA. Epigenetics in cancer. Carcinogenesis 2010; 31:27-36; PMID:19752007; http://dx.doi.org/ 10.1093/carcin/bgp220 [DOI] [PMC free article] [PubMed] [Google Scholar]
- 3.Kano Y, Akutsu M, Tsunoda S, Izumi T, Kobayashi H, Mano H, Furukawa Y. Cytotoxic effects of histone deacetylase inhibitor FK228 (depsipeptide, formally named FR901228) in combination with conventional anti-leukemia/lymphoma agents against human leukemia/lymphoma cell lines. Invest New Drugs 2007; 25:31-40; PMID:16865529; http://dx.doi.org/ 10.1007/s10637-006-9000-0 [DOI] [PubMed] [Google Scholar]
- 4.Kouzarides T. Histone acetylases and deacetylases in cell proliferation. Curr Opin Genet Dev 1999; 9:40-8; PMID:10072350; http://dx.doi.org/ 10.1016/S0959-437X(99)80006-9 [DOI] [PubMed] [Google Scholar]
- 5.Lane AA, Chabner BA. Histone deacetylase inhibitors in cancer therapy. J Clin Oncol 2009; 27:5459-68; PMID:19826124; http://dx.doi.org/ 10.1200/JCO.2009.22.1291 [DOI] [PubMed] [Google Scholar]
- 6.Khan O, La Thangue NB. HDAC inhibitors in cancer biology: emerging mechanisms and clinical applications. Immunol Cell Biol 2012; 90:85-94; PMID:22124371; http://dx.doi.org/ 10.1038/icb.2011.100 [DOI] [PubMed] [Google Scholar]
- 7.Zain J, O'Connor OA. Targeting histone deacetyalses in the treatment of B- and T-cell malignancies. Invest New Drugs 2010; 28:S58-78; PMID:21132350; http://dx.doi.org/ 10.1007/s10637-010-9591-3 [DOI] [PMC free article] [PubMed] [Google Scholar]
- 8.Harrison SJ, Bishton M, Bates SE, Grant S, Piekarz RL, Johnstone RW, Dai Y, Lee B, Araujo ME, Prince HM. A focus on the preclinical development and clinical status of the histone deacetylase inhibitor, romidepsin (depsipeptide, Istodax(®). Epigenomics 2012; 4:571-89; PMID:23130838; http://dx.doi.org/ 10.2217/epi.12.52 [DOI] [PMC free article] [PubMed] [Google Scholar]
- 9.Furumai R, Matsuyama A, Kobashi N, Lee KH, Nishiyama M, Nakajima H, Tanaka A, Komatsu Y, Nishino N, Yoshida M, et al.. FK228 (depsipeptide) as a natural prodrug that inhibits class I histone deacetylases. Cancer Res 2002; 62:4916-21; PMID:12208741 [PubMed] [Google Scholar]
- 10.Piekarz RL, Robey RW, Zhan Z, Kayastha G, Sayah A, Abdeldaim AH, Torrico S, Bates SE. T-cell lymphoma as a model for the use of histone deacetylase inhibitors in cancer therapy: impact of depsipeptide on molecular markers, therapeutic targets, and mechanisms of resistance. Blood 2004; 103:4636-43; PMID:14996704; http://dx.doi.org/ 10.1182/blood-2003-09-3068 [DOI] [PubMed] [Google Scholar]
- 11.Woo S, Gardner ER, Chen X, Ockers SB, Baum CE, Sissung TM, Price DK, Frye R, Piekarz RL, Bates SE, et al.. Population pharmacokinetics of romidepsin in patients with cutaneous T-cell lymphoma and relapsed peripheral T-cell lymphoma. Clin Cancer Res 2009; 15:1496-503; PMID:19228751; http://dx.doi.org/ 10.1158/1078-0432.CCR-08-1215 [DOI] [PMC free article] [PubMed] [Google Scholar]
- 12.Nolan L, Johnson PW, Ganesan A, Packham G, Crabb SJ. Will histone deacetylase inhibitors require combination with other agents to fulfil their therapeutic potential? Br J Cancer 2008; 99:689-94; http://dx.doi.org/ 10.1038/sj.bjc.6604557 [DOI] [PMC free article] [PubMed] [Google Scholar]
- 13.Richardson P, Anderson K. Immunomodulatory analogs of thalidomide: an emerging new therapy in myeloma. J Clin Oncol 2004; 22:3212-14; PMID:15249587; http://dx.doi.org/ 10.1200/JCO.2004.05.984 [DOI] [PubMed] [Google Scholar]
- 14.Davies F, Baz R. Lenalidomide mode of action: linking bench and clinical findings. Blood Rev 2010; 24:S13-9; PMID:21126632; http://dx.doi.org/ 10.1016/S0268-960X(10)70004-7 [DOI] [PubMed] [Google Scholar]
- 15.Chanan-Khan A, Miller KC, Takeshita K, Koryzna A, Donohue K, Bernstein ZP, Mohr A, Klippenstein D, Wallace P, Zeldis JB, et al.. Results of a phase 1 clinical trial of thalidomide in combination with Fludarabine as initial therapy for patients with treatment-requiring chronic lymphocytic leukemia (CLL). Blood 2005; 106:3348-52; PMID:16051743; http://dx.doi.org/ 10.1182/blood-2005-02-0669 [DOI] [PubMed] [Google Scholar]
- 16.Wiernik PH, Lossos IS, Tuscano JM, Justice G, Vose JM, Cole CE, Lam W, McBride K, Wride K, Pietronigro D, et al.. Lenalidomide monotherapy in relapsed or refractory aggressive non-Hodgkin's lymphoma. J Clin Oncol 2008; 26:4952-7; PMID:18606983; http://dx.doi.org/ 10.1200/JCO.2007.15.3429 [DOI] [PubMed] [Google Scholar]
- 17.Querfeld C, Rosen ST, Guitart J, Duvic M, Kim YH, Dusza SW. Results of an open-label multicenter phase 2 trial of lenalidomide monotherapy in refractory mycosis fungoides and Sézary syndrome. Blood 2014; 123:1159-66; PMID:24335103; http://dx.doi.org/ 10.1182/blood-2013-09-525915 [DOI] [PubMed] [Google Scholar]
- 18.Kannan K. SK Oxidative stress and apoptosis. Pathophysiology 2000; 7:153-63; PMID:10996508; http://dx.doi.org/ 10.1016/S0928-4680(00)00053-5 [DOI] [PubMed] [Google Scholar]
- 19.Mignotte B, Vayssiere JL. Mitochondria and apoptosis. Eur. J. Biochem 1998; 252:1-15; PMID: 9523706; http://dx.doi.org/24180212 10.1046/j.1432-1327.1998.2520001.x [DOI] [PubMed] [Google Scholar]
- 20.Liu ZW, Zhu HT, Chen KL, Dong X, Wei J, Qiu C, Xue JH. JH1Protein kinase RNA-like endoplasmic reticulum kinase (PERK) signaling pathway plays a major role in reactive oxygen species (ROS)-mediated endoplasmic reticulum stress-induced apoptosis in diabetic cardiomyopathy. Cardiovasc Diabetol 2013; 12:158; PMID:24180212; http://dx.doi.org/ 10.1186/1475-2840-12-158 [DOI] [PMC free article] [PubMed] [Google Scholar]
- 21.Hui KF, Chiang AK. Combination of proteasome and class I HDAC inhibitors induces apoptosis of NPC cells through an HDAC6-independent ER stress-induced mechanism. Int J Cancer 2014; 135:2950-61; PMID:24771510; http://dx.doi.org/ 10.1002/ijc.28924 [DOI] [PubMed] [Google Scholar]
- 22.Bauer B, Baier G. Protein kinase C and AKT/protein kinase B in CD4+ T-lymphocytes: new partners in TCR/CD28 signal integration. Mol Immunol 2002; 38:1087-99; PMID:12044776; http://dx.doi.org/ 10.1016/S0161-5890(02)00011-1 [DOI] [PubMed] [Google Scholar]
- 23.Darling NJ, Cook SJ. The role of MAPK signalling pathways in the response to endoplasmic reticulum stress. Biochim Biophys Acta 2014; 1843:2150-63; PMID:24440275; http://dx.doi.org/ 10.1016/j.bbamcr.2014.01.009 [DOI] [PubMed] [Google Scholar]
- 24.Mitchell TJ, John S. Signal transducer and activator of transcription (STAT) signalling and T-cell lymphomas. Immunology. 2005; 114:301-12; PMID:15720432; http://dx.doi.org/ 10.1111/j.1365-2567.2005.02091.x [DOI] [PMC free article] [PubMed] [Google Scholar]
- 25.Calado DP, Sasaki Y, Godinho SA, Pellerin A, Köchert K, Sleckman BP, de Alborán IM, Janz M, Rodig S, Rajewsky K. The cell-cycle regulator c-Myc is essential for the formation and maintenance of germinal centers. Nat Immunol 2012; 13:1092-100; PMID:23001146; http://dx.doi.org/ 10.1038/ni.2418 [DOI] [PMC free article] [PubMed] [Google Scholar]
- 26.Krejsgaard T, Ralfkiaer U, Clasen-Linde E, Eriksen KW, Kopp KL, Bonefeld CM, Geisler C, Dabelsteen S, Wasik MA, Ralfkiaer E, et al.. Malignant cutaneous T-cell lymphoma cells express IL-17 utilizing the Jak3/Stat3 signaling pathway. J Invest Dermatol 2011; 131:1331-8; PMID:21346774; http://dx.doi.org/ 10.1038/jid.2011.27 [DOI] [PubMed] [Google Scholar]
- 27.Cohen SB, Crawley JB, Kahan MC, Feldmann M, Foxwell BM. Interleukin-10 rescues T cells from apoptotic cell death: association with an upregulation of Bcl-2. Immunology 1997; 92:1-5; PMID:9370916; http://dx.doi.org/ 10.1046/j.1365-2567.1997.00348.x [DOI] [PMC free article] [PubMed] [Google Scholar]
- 28.National Institutes of Health (NIH) ClinicalTrials.gov 2015 Available from: http://www.clinicaltrial.gov [Google Scholar]
- 29.Wiernik PH. Lenalidomide in lymphomas and chronic lymphocytic leukemia. Expert Opin Pharmacother 2013; 14:475-88; PMID:23356486; http://dx.doi.org/ 10.1517/14656566.2013.765858 [DOI] [PubMed] [Google Scholar]
- 30.Fink EC, Ebert BL. The novel mechanism of lenalidomide activity. Blood 2015; 126:2366-9; PMID:26438514; http://dx.doi.org/ 10.1182/blood-2015-07-567958 [DOI] [PMC free article] [PubMed] [Google Scholar]
- 31.Dueck G, Chua N, Prasad A, Finch D, Stewart D, White D, van der Jagt R, Johnston J, Belch A, Reiman T. Interim report of a phase 2 clinical trial of lenalidomide for T-cell non-Hodgkin lymphoma. Cancer 2010; 116:4541-8; PMID:20572046; http://dx.doi.org/ 10.1002/cncr.25377 [DOI] [PubMed] [Google Scholar]
- 32.Morschhauser F, Fitoussi O, Haioun C, Thieblemont C, Quach H, Delarue R, Glaisner S, Gabarre J, Bosly A, Lister J, Li J, et al.. A phase 2, multicentre, single-arm, open-label study to evaluate the safety and efficacy of single-agent lenalidomide (Revlimid) in subjects with relapsed or refractory peripheral T-cell non-Hodgkin lymphoma: the EXPECT trial. Eur J Cancer 2013; 49:2869-76; PMID:23731832; http://dx.doi.org/ 10.1016/j.ejca.2013.04.029 [DOI] [PubMed] [Google Scholar]
- 33.Pelicano H, Carney D, Huang P. ROS stress in cancer cells and therapeutic Implications. Drug Resistance Update 2004; 7:97-110; http://dx.doi.org/ 10.1016/j.drup.2004.01.004 [DOI] [PubMed] [Google Scholar]
- 34.Ruefli AA, Ausserlechner MJ, Bernhard D, Sutton VR, Tainton KM, Kofler R, et al.. The histone deacetylase inhibitor and chemotherapeutic agent suberoylanilide hydroxamic acid (SAHA) induces a cell-death pathway characterized by cleavage of Bid and production of reactive oxygen species. Proc Natl Acad Sci USA. 2001; 98:10833-8; http://dx.doi.org/ 10.1073/pnas.191208598 [DOI] [PMC free article] [PubMed] [Google Scholar]
- 35.Fulda S, Gorman AM, Hori O, Samali A. Cellular Stress Responses: Cell Survival and Cell Death. Int J Cell Biol 2010; 2010:214074; PMID:20182529; http://dx.doi.org/ 10.1155/2010/214074 [DOI] [PMC free article] [PubMed] [Google Scholar]
- 36.Ericson ML, Horling J, Wendel-Hansen V, Holmgren A, Rosen A. Secretion of thioredoxin after in vitro activation of human B cells. Lymphokine Cytokine Res 1992; 11:201-7; PMID:1334710 [PubMed] [Google Scholar]
- 37.Powis G, Kirkpatrick DL. Thioredoxin signaling as a target for cancer therapy. Curr Opin Pharmacol 2007; 7:392-7; PMID:17611157; http://dx.doi.org/ 10.1016/j.coph.2007.04.003 [DOI] [PubMed] [Google Scholar]
- 38.Gromer S, Urig S, Becker K. The thioredoxin system–from science to clinic. Med Res Rev 2004; 24:40-89; PMID:14595672; http://dx.doi.org/ 10.1002/med.10051 [DOI] [PubMed] [Google Scholar]
- 39.Tonissen KF, Di Trapani G. Thioredoxin system inhibitors as mediators of apoptosis for cancer therapy. Mol Nutr Food Res 2009; 53:87-103; PMID:18979503; http://dx.doi.org/ 10.1002/mnfr.200700492 [DOI] [PubMed] [Google Scholar]
- 40.Bhandary B, Marahatta A, Kim HR, Chae HJ. An involvement of oxidative stress in endoplasmic reticulum stress and its associated diseases. Int J Mol Sci 2012; 14:434-56; PMID:23263672; http://dx.doi.org/ 10.3390/ijms14010434 [DOI] [PMC free article] [PubMed] [Google Scholar]
- 41.Blaustein M, Pérez-Munizaga D, Sánchez MA, Urrutia C, Grande A, Risso G, Srebrow A, Alfaro J, Colman-Lerner A. Modulation of the Akt pathway reveals a novel link with PERK/eIF2α, which is relevant during hypoxia. PLoS One 2013; 8:e69668; PMID:23922774; http://dx.doi.org/ 10.1371/journal.pone.0069668 [DOI] [PMC free article] [PubMed] [Google Scholar]
- 42.Darling NJ, Cook SJ. The role of MAPK signalling pathways in the response to endoplasmic reticulum stress. Biochim Biophys Acta 2014; 1843:2150-63; PMID:24440275; http://dx.doi.org/ 10.1016/j.bbamcr.2014.01.009 [DOI] [PubMed] [Google Scholar]
- 43.Sano R, Reed JC. ER stress-induced cell death mechanisms. Biochim Biophys Acta 2013; 1833:3460-70; PMID:23850759; http://dx.doi.org/ 10.1016/j.bbamcr.2013.06.028 [DOI] [PMC free article] [PubMed] [Google Scholar]
- 44.Ron DP. Walter. Signal integration in the endoplasmic reticulum unfolded protein response. Nat Rev Mol Cell Biol 2007; 8:519-29; PMID:17565364; http://dx.doi.org/ 10.1038/nrm2199 [DOI] [PubMed] [Google Scholar]
- 45.Mounir Z, Krishnamoorthy JL, Wang S, Papadopoulou B, Campbell S, Muller WJ, Hatzoglou M, Koromilas AE. Akt determines cell fate through inhibition of the PERK-eIF2a phosphorylation pathway. Sci Signal 2011; 4:ra62; PMID:21954288; http://dx.doi.org/ 10.1126/scisignal.2001630 [DOI] [PMC free article] [PubMed] [Google Scholar]
- 46.Sandor V, Senderowicz A, Mertins S, Sackett D, Sausville E, Blagosklonny MV, Bates SE. P21-dependent g(1)arrest with downregulation of cyclin D1 and upregulation of cyclin E by the histone deacetylase inhibitor FR901228. Br J Cancer 2000; 83:817-25; PMID:10952788; http://dx.doi.org/ 10.1054/bjoc.2000.1327 [DOI] [PMC free article] [PubMed] [Google Scholar]
- 47.Heider U, Rademacher J, Lamottke B, Mieth M, Moebs M, von Metzler I, Assaf C, Sezer O. Synergistic interaction of the histone deacetylase inhibitor SAHA with the proteasome inhibitor bortezomib in cutaneous T cell lymphoma. Eur J Haematol 2009; 82:440-9; PMID:19220424; http://dx.doi.org/ 10.1111/j.1600-0609.2009.01239.x [DOI] [PubMed] [Google Scholar]
- 48.Kim EK, Choi EJ. Pathological roles of MAPK signaling pathways in human diseases. Biochim Biophys Acta 2010; 1802:396-405; PMID:20079433; http://dx.doi.org/ 10.1016/j.bbadis.2009.12.009 [DOI] [PubMed] [Google Scholar]
- 49.Shapiro GI. Cyclin-dependent kinase pathways as targets for cancer treatment. J Clin Oncol 2006; 24:1770-83; PMID:16603719; http://dx.doi.org/ 10.1200/JCO.2005.03.7689 [DOI] [PubMed] [Google Scholar]
- 50.Kasprzycka M, Zhang Q, Witkiewicz A, Marzec M, Potoczek M, Liu X, Wang HY, Milone M, Basu S, Mauger J, et al.. Gamma c-signaling cytokines induce a regulatory T cell phenotype in malignant CD4+ T lymphocytes. J Immunol 2008; 181:2506-12; PMID:18684941; http://dx.doi.org/ 10.4049/jimmunol.181.4.2506 [DOI] [PMC free article] [PubMed] [Google Scholar]
- 51.Lee JJ, Kim DH, Lee NY, Sohn SK, Kim JG, Kim HJ, Do YR, Park YH. Interleukin-10 gene polymorphism influences the prognosis of T-cell non-Hodgkin lymphomas. Br J Haematol 2007; 137:329-36; PMID:17408400; http://dx.doi.org/ 10.1111/j.1365-2141.2007.06570.x [DOI] [PubMed] [Google Scholar]
- 52.Cohen SB, Crawley JB, Kahan MC, Feldmann M, Foxwell BM. Interleukin-10 rescues T cells from apoptotic cell death: association with an upregulation of Bcl-2. Immunology 1997; 92:1-5; PMID:9370916; http://dx.doi.org/ 10.1046/j.1365-2567.1997.00348.x [DOI] [PMC free article] [PubMed] [Google Scholar]
- 53.Weber-Nordt RM, Henschler R, Schott E, Wehinger J, Behringer D, Mertelsmann R, Finke J. Interleukin-10 increases Bcl-2 expression and survival in primary human CD34+ hematopoietic progenitor cells. Blood 1996; 88:2549-58; PMID:8839847 [PubMed] [Google Scholar]
- 54.Rassidakis GZ, Jones D, Lai R, Ramalingam P, Sarris AH, McDonnell TJ, Medeiros LJ. BCL-2 family proteins in peripheral T-cell lymphomas: correlation with tumour apoptosis and proliferation. J Pathol 2003; 200:240-8; PMID:12754745; http://dx.doi.org/ 10.1002/path.1346 [DOI] [PubMed] [Google Scholar]
- 55.Cosenza M, Civallero M, Pozzi S, Marcheselli L, Bari A, Sacchi S. The combination of bortezomib with enzastaurin or lenalidomide enhances cytotoxicity in follicular and mantle cell lymphoma cell lines. Hematol Oncol 2015; 33:166-75; PMID:25394177; http://dx.doi.org/ 10.1002/hon.2179 [DOI] [PubMed] [Google Scholar]
- 56.Chou TC. Theoretical basis, experimental design, and computerized simulation of synergism and antagonism in drug combination studies. Pharmacol Rev 2006; 58:621-81; PMID:16968952; http://dx.doi.org/ 10.1124/pr.58.3.10 [DOI] [PubMed] [Google Scholar]
Associated Data
This section collects any data citations, data availability statements, or supplementary materials included in this article.


