

Abstract
Background: The amount of drug aerosol from an inhaler that can pass through an in vitro model of the mouth and throat (MT) during a realistic breath or inhalation flow rate vs. time profile (IP) is designated the total lung dose in vitro, or TLDin vitro. This article describes a clinical study that enabled us to recommend a general method of selecting IPs for use with powder inhalers of known airflow resistance (R) provided subjects followed written instructions either alone or in combination with formal training.
Methods: In a drug-free clinical trial, inhaler-naïve, nonsmoking healthy adult human volunteers were screened for normal pulmonary function. IPs were collected from each volunteer inhaling through different air flow resistances after different levels of training. IPs were analyzed to determine the distribution of inhalation variables across the population and their dependence on training and airflow resistance.
Results: Equations for IP simulation are presented that describe the data including confidence limits at each resistance and training condition. Realistic IPs at upper (90%), median (50%), and lower (10%) confidence limits were functions of R and training. Peak inspiratory flow rates (PIFR) were inversely proportional to R so that if R was assigned, values for PIFR could be calculated. The time of PIFR, TPIFR, and the total inhaled volume (V) were unrelated to R, but dependent on training. Once R was assigned for a powder inhaler to be tested, a range of simulated IPs could be generated for the different training scenarios. Values for flow rate acceleration and depth of inspiration could also be varied within the population limits of TPIFR and V.
Conclusions: The use of simulated IPs, in concert with realistic in vitro testing, should improve the DPI design process and the confidence with which clinical testing may be initiated for a chosen device.
Key words: : airflow resistance, dry powder inhaler, in vitro–in vivo correlations, inhalation profiles, patient training, peak inhalation flow rate, realistic inhaler testing
Introduction
In this series of publications on realistic inhaler testing, we sought to offer improved, clinically-relevant test methods for aerosol drugs and possible in vitro–in vivo correlations (IVIVC) for lung deposition.(1–3) The experimental setup and brief description of the test method is shown in Figure 1.
FIG. 1.

Experimental setup for realistic in vitro testing. A passive powder inhaler with known airflow resistance (R) is primed and inserted into small, medium, or large mouth-throat (MT) model(s) that span 95% of the volumetric range seen in human adults. Internal surfaces of MT are coated to retain powder particles. A breath simulator with sufficient capacity is programmed to withdraw a volume V through a low resistance filter using a range of simulated IPs, as described in the text. The mass of drug that reaches the filter, TLDin vitro, depends on the product, and the MT-IP combination.(1–4,14–17)
By assessing the aerosol drug dose exiting small, medium, and large realistic mouth–throat (MT) models(4) while using inhalation profiles (IPs) believed to simulate the breathing maneuvers used during clinical testing, we found that (a) the mean value for TLDin vitro, from several different dry powder inhalers (DPIs) was consistent with literature values for lung deposition following clinical testing(2) and (b) the range of values from a single DPI agreed with the published range of values for TLDin vivo following gamma-scintigraphic testing in a mixed-gender adult population.(1)
It is well known that performance of passive DPIs is air flow rate dependent. Indeed the seminal work of Clark and Hollingworth(5) led to compendial test methods requiring that dose emissions and size distributions be determined at flow rates that maintain an appropriate pressure drop across each inhaler.(6) It is also well known that DPI performance depends on the way that patients use these inhalers. While this can be influenced by instruction leaflets, training and of course, the subject's lung capacity, present DPI development is largely empirical and often retrospective because of in vitro performance testing that fails to concern itself with the way that patients actually inhale through a chosen device. Reports that a large proportion of patients fail to use DPIs correctly are common; failure to exhale before inhalation, failure to inhale rapidly and deeply, as well as incorrect mouthpiece positioning may all influence regional drug deposition and clinical outcome.(7,8)
In this article we report the results of a clinical study that enabled us to document the variability in the inhalation profiles (IPs) of inhaler-naïve normal adults inhaling through a series of air flow resistances typical of those used in commercial DPIs. The study enabled us to recommend a range of IPs for testing DPIs with different airflow resistances. The IPs may be simulated using sinusoidal equations that adequately describe the flow rate vs time profiles spanning the 10 through 90 percentile values for a mixed-gender, lung-normal, adult population.
Because inhaler-naïve volunteers were recruited for the study, it was also possible to compare the effectiveness of “training by package insert” to formalized training from a pharmacist in the use of passive DPIs; this by comparing the different IPs elicited by the two procedures in the same subjects. Use of the protocol described here should enable IPs to be selected for inhaler testing to span those likely to be used by normal human volunteers in clinical trials. While recognizing that inhalation profiles may differ in patient groups with different demographics and lung disease,(9–12) the approach to data analysis and IP simulation that is described here can likely be generalized to cover different populations so that product development scientists can select IPs for inhaler testing in vitro that are realistic and representative of the way new inhalers should eventually be used.
Materials and Methods
A protocol was designed to document the IPs commonly used by healthy volunteers inhaling through powder inhalers. Volunteers were trained first by reading the directions for use provided in a typical package insert, and second, by receiving a demonstration and direct oral instructions from a pharmacist. The objectives were (a) to collect a range of typical flow rate versus time profiles from normal adult subjects inhaling through air flow resistances that mimicked those seen in commercial DPIs, (b) curve-fit and analyze those IPs before and after receipt of training, and thus, (c) establish a data base and equations for simulation of typical IPs used by normal subjects inhaling through different air flow resistances.
We envisaged the use of these equations by inhaler designers seeking to optimize product performance in vitro, in advance of clinical trials. As it is well known that aerosol drug delivery performance of passive DPIs is dependent on air flow rate and air flow resistance,(5,6) a drug-free “inhalation flow cell (IFC)” with a disposable mouthpiece and variable airflow resistances was constructed and instrumented with a digital volumetric flow meter, as shown in Figure 2, to record the air flow rate vs. time profiles used by each of the volunteers.
FIG. 2.
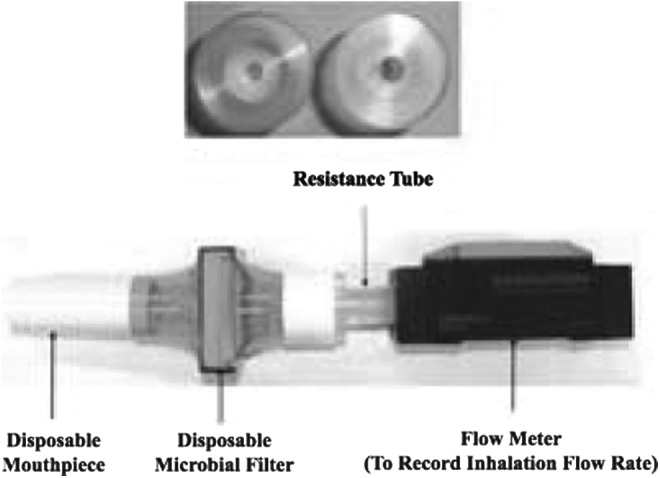
The inhalation flow cell (IFC) with top views of two “Resistance Tubes” with identical external, but different internal, dimensions. Six IFC resistances were chosen for IP recordings in the clinic: 0.0179, 0.0200, 0.0241, 0.0344, 0.0432, and 0.0462 kPa0.5L−1 min. These values were determined experimentally from the slope of plots measured pressure drop0.5 (flowmeter inlet to mouthpiece) vs. the volumetric airflow rate exiting the mouthpiece (ASL 5000-XL, Ingmar Medical, Pittsburgh, PA). In the clinic, flow rates entering IFC were recorded every 50 msec using a calibrated digital flow meter (EM1, Sensirion Inc., CA). All flow rates in this article are expressed as the volumetric flow rate exiting the mouthpiece and are identical to those used to program the breath simulator (Fig. 1).
Each recorded flow rate value was converted to the volumetric flow rate exiting the mouthpiece using an algorithm to account for the change in the volumetric gas flow into and out of the IFC with variations in pressure and resistance.(13) All of the IPs and flowrates described in this article are flowrates exiting the mouthpiece. Therefore, all IP data can be used directly to program breath simulators in the “realistic” in vitro tests we described elsewhere.(1–3,14–17) Air flow resistance values [kPa0.5L−1 min] for the IFC were determined from the slope of experimental plots of (pressure drop across IFC)0.5 vs. volumetric flow rate out of the mouthpiece, by linear regression.
Clinical study: Collection of inhalation profiles (IPs)
Adult human volunteers were recruited from the general population of Richmond, Virginia, via advertisements. Healthy, nonpregnant, nonsmoking subjects were recruited who were 18 to 65 years old, above 147cm in height, 50 to 120 kg in weight, without history of recent congestion, lung disease, and/or inhaler use. Volunteers had never used, or been trained to use, a DPI before admission to the study. The study was approved by VCU's Institutional Review Board and entered on www.clinicaltrials.gov.
Eligible subjects were enrolled; twenty (10 M, 10 F) completed the study. None had evidence of acute medical or psychiatric illness and all were found to have FEV1 > the predicted lower limit of normal (LLN) after spirometric screening performed during an initial visit.(18,19) On the second visit, each volunteer was asked to inhale approximately 18 times through the IFC (Fig. 2). Individual IPs were recorded digitally every 50 msec as the volumetric flow rate vs. time profile of air exiting the mouthpiece of the calibrated inhalation cell after Instruction A and B were provided, sequentially, to each volunteer.
Instruction A
Each volunteer was asked to read the instructions shown in Figure 3. Those written instructions were based on leaflets, supplied as package inserts with marketed powder inhalers, showing patients how to inhale from a primed DPI. After reading the instructions, volunteers were asked to inhale through the drug-free IFC, as if they were conforming to the written instructions. Inhalation profiles were recorded for each of six different resistance tubes placed in the IFC in random order. Subjects were allowed to rest between inhalations to avoid fatigue.
FIG. 3.

Written instructions for inhalation. Instruction A (Artwork adapted from patient information leaflets).
Instruction B
Verbal instruction and a practical demonstration of how to use a powder inhaler correctly was then delivered individually to each volunteer by a pharmacist trained and experienced in the use of powder inhalers. The same pharmacist provided the same demonstration and instructions to each volunteer that emphasized: (Step 1) breathe out completely, (Step 2) ensure good lip closure around the IFC mouthpiece, (Step 3) inhale as fast and deep as possible through the mouth; and to continue until replete, (Step 4) hold breath and remove IFC from mouth.
Following this formal training, volunteers were again asked to inhale through the IFC in the way they had been instructed and, during each inhalation, they were encouraged to continue inhaling as they began to show signs of reduced effort. IPs were recorded for each of the six different resistance tubes placed in the IFC in random order. Each flow profile was repeated to give a second IP, or flow rate exiting the mouthpiece vs. time, for each subject and resistance. The results from these duplicate experiments were designated “Instruction B1” and “Instruction B2”.
Data analysis and statistics
Overall, the trial produced a series of 20 IPs per air flow resistance (total = 120) for each of three instruction conditions: A, B1, and B2. These IPs were analyzed to determine their overall dependence on airflow resistance (R) and training status. In order to do this, the parameters defined in Figure 4 were extracted from each IP and tabulated. The descriptive statistics: mean, median, standard deviation, minimum and maximum values, coefficient of variation (CV (%) = 100*standard deviation/mean) were estimated for each of the inhalation variables (PIFR, TPIFR, V and T; Fig. 4) by gender and across gender.
FIG. 4.

Idealized IP or flow rate (FR) versus time curve and the primary variables: AUC, area under the curve; PIFR, peak inspiratory flow rate; TPIFR, the time at which PIFR occurs; V, inhaled volume. Total inhalation time (T) is a secondary variable, dependent on PIFR and V.
Further inferential statistics were estimated as follows: for each individual dataset (Instruction A, B1, or B2) for a given volunteer, the quantitative relationship between each inhalation variable and air flow resistance (R) was assessed by linear regression analysis. Four functions of R, [f(R)], were explored in this way: R, 1/R, LogR and R0.5. Best f(R) was selected based on the best fit (e.g., the coefficient of determination, r2, that was largest). To assess the effects of training on IP statistically (e.g. comparing instruction A, B1 or B2) it was necessary to pool the results for each training condition. Accordingly, secondary variables were derived that were resistance-independent: in cases where significant relationships existed between the inhalation variable and R (e.g., PIFR), the values of that variable were normalized by resistance and averaged across all resistances in order to obtain a secondary, resistance-independent, normalized, inhalation variable.
In case of insignificant relationships between a variable and R, the inhalation variables were averaged across resistances, without normalization, again to obtain a secondary, resistance-independent, inhalation variable. The effect of formal training (Instruction B1 and B2) on these secondary inhalation variables was assessed using repeated-measures ANOVA. The level of significance was preset at 0.05. Normality of the residuals was judged by normal quantile plots and visual inspection of the distribution of residuals. JMP 8.0 (SAS Corp, RTP, NC) was used for all statistical analyses.
Results
Air flow resistances of the Inhalation Flow Cell (Fig. 2) were 0.0462, 0.0432, 0.0344, 0.0241, 0.0200, and 0.0179 kPa0.5L−1 min. These were comparable with the values 0.0467, 0.0435, 0.0352, 0.0241, 0.0198, and 0.0176 kPa0.5L−1 min, determined from linear regression of pressure drop0.5 versus flow rate data for Spiriva® HandiHaler®, Salbutamol Easyhaler®, Pulmicort® Turbuhaler®, Budelin® Novolizer®, Relenza® Diskhaler®, and Foradil® Aerolizer®, respectively. Twenty (10 F, 10 M) of an initial 22 volunteers, with the demographics and pulmonary function results shown in Table 1, completed the study.
Table 1.
Summary of Subject Demographics and Pulmonary Function Tests (Mean ± SD)
| Males | Females | Overall | |
|---|---|---|---|
| Total | 10 | 10 | 20 |
| Caucasian | 6 | 3 | 9 |
| African | 1 | 3 | 4 |
| Asian | 1 | 2 | 3 |
| Hispanic | 0 | 1 | 1 |
| Others | 2 | 1 | 3 |
| Age [yrs] | 31.1 ± 10.31 | 34.0 ± 8.81 | 32.6 ± 9.23 |
| Height [cm] | 176.6 ± 5.64 | 161.8 ± 6.49 | 169.2 ± 9.40 |
| Weight [kg] | 81.7 ± 16.75 | 60.7 ± 7.29 | 71.2 ± 16.16 |
| PFTa | |||
| FVC [L] | 5.02 ± 0.60 | 3.31 ± 0.35 | 4.15 ± 0.98 |
| FEV1 [L] | 4.23 ± 0.41 | 2.81 ± 0.32 | 3.51 ± 0.80 |
| FEV1/FVC | 0.84 ± 0.04 | 0.85 ± 0.06 | 0.85 ± 0.05 |
| FEF 25%–75% [L/s] | 4.72 ± 0.70 | 3.29 ± 0.87 | 3.99 ± 1.03 |
| PEF [L/s] | 10.08 ± 1.28 | 7.12 ± 0.77 | 9.15 ± 1.92 |
| FET [s] | 6.46 ± 1.01 | 6.91 ± 3.77 | 6.69 ± 2.63 |
Pulmonary function tests.
Each subject followed the instructions and inhaled through the six, randomly-presented, airflow resistances that are typical of those in marketed DPIs, using the apparatus shown in Figure 2. The resulting IPs are used in the discussion to provide data on the type and range of inspiratory maneuvers that need to be catered for by powder inhaler designers seeking to deliver aerosol drug clouds to the lungs of inhaler-naïve human adults with essentially normal pulmonary function, and where the subjects selected for product development trials have either been given written instructions on how to inhale or received formal training in DPI use by a professional.
Dependence of inhalation variables on air flow resistance and training
A complete and detailed description of the analyses performed on the inhalation variables collected clinically is available in Delvadia;(13) the thesis included analyses of residual distributions, normal quantile plots, statistical evaluation of gender effects, assessment of interactions between training status, gender and data from pulmonary function tests, and a complete compilation of all numerical data on which the analyses in this article are based. While those results enable us to present IP data, conclusions and equations for IP simulation at each resistance and training condition, the material is too lengthy to present in its entirety. Therefore, essential material in Delvadia(13) is presented to justify our recommendations to test dry powder inhalers in vitro, using the apparatus shown in Figure 1, with a range of differently simulated IPs that describe the pooled data including confidence limits at each resistance and training condition.
The experimental values for PIFR, TPIFR, and V (Fig. 4) were assessed for functional dependence on airflow resistance (R). The results showed that 1/R gave the best fit for PIFR from the four functions tested, while TPIFR and V showed no detectable dependence on resistance. Accordingly, the statistics describing the mean, median, standard deviation, minimum and maximum values, and coefficient of variation (CV (%) = 100 * standard deviation/mean) for each “resistance-normalized” variable (Fig. 4; R*PIFR, TPIFR, and V) are presented in Table 2 by gender, across gender, and by training status to show the effects of gender and training.
Table 2.
Descriptive Result Summary of IP Data for “Resistance-Normalized”, R*PIFR (kPa0.5), Mean Volume, V (L), and Mean TPIFR (sec), by Training status and Gender
| Female | Male | Overall | |||||||
|---|---|---|---|---|---|---|---|---|---|
| Instr. A Mean (R*PIFR) | Instr. B1 Mean (R*PIFR) | Instr. B2 Mean (R*PIFR) | Instr. A Mean (R*PIFR) | Instr. B1 Mean (R*PIFR) | Instr. B2 Mean (R*PIFR) | Instr. A Mean (R*PIFR) | Instr. B1 Mean (R*PIFR) | Instr. B2 Mean (R*PIFR) | |
| Mean | 1.895 | 2.402 | 2.381 | 2.619 | 3.029 | 2.920 | 2.257 | 2.715 | 2.650 |
| SD | 0.432 | 0.287 | 0.316 | 0.589 | 0.259 | 0.235 | 0.625 | 0.417 | 0.387 |
| Min | 0.893 | 2.012 | 1.900 | 1.291 | 2.529 | 2.510 | 0.893 | 2.012 | 1.900 |
| Max | 2.507 | 3.009 | 3.033 | 3.391 | 3.376 | 3.287 | 3.391 | 3.376 | 3.287 |
| CV | 22.8 | 11.9 | 13.3 | 22.5 | 8.5 | 8.1 | 27.7 | 15.4 | 14.6 |
| Median | 1.879 | 2.375 | 2.372 | 2.654 | 3.053 | 2.920 | 2.244 | 2.661 | 2.583 |
| Mean V (L) | Mean V (L) | Mean V (L) | Mean V (L) | Mean V (L) | Mean V (L) | Mean V (L) | Mean V (L) | Mean V (L) | |
|---|---|---|---|---|---|---|---|---|---|
| Mean | 1.562 | 2.025 | 2.100 | 3.009 | 3.781 | 3.793 | 2.285 | 2.903 | 2.947 |
| SD | 0.532 | 0.410 | 0.370 | 0.925 | 0.758 | 0.814 | 1.044 | 1.078 | 1.064 |
| Min | 1.065 | 1.393 | 1.486 | 2.366 | 2.982 | 2.713 | 1.065 | 1.393 | 1.486 |
| Max | 2.484 | 2.687 | 2.679 | 5.349 | 5.595 | 5.488 | 5.349 | 5.595 | 5.488 |
| CV | 34.0 | 20.2 | 17.6 | 30.7 | 20.0 | 21.5 | 45.7 | 37.2 | 36.1 |
| Median | 1.384 | 2.031 | 2.167 | 2.620 | 3.688 | 3.799 | 2.384 | 2.834 | 2.696 |
| Mean TPIFR | Mean TPIFR | Mean TPIFR | Mean TPIFR | Mean TPIFR | Mean TPIFR | Mean TPIFR | Mean TPIFR | Mean TPIFR | |
|---|---|---|---|---|---|---|---|---|---|
| Mean | 0.803 | 0.497 | 0.529 | 0.914 | 0.614 | 0.582 | 0.858 | 0.555 | 0.555 |
| SD | 0.447 | 0.153 | 0.210 | 0.456 | 0.192 | 0.275 | 0.443 | 0.179 | 0.240 |
| Min | 0.453 | 0.222 | 0.255 | 0.540 | 0.225 | 0.250 | 0.453 | 0.222 | 0.250 |
| Max | 1.893 | 0.734 | 0.978 | 1.944 | 0.872 | 1.179 | 1.944 | 0.872 | 1.179 |
| CV | 55.7 | 30.8 | 39.6 | 49.9 | 31.3 | 47.3 | 51.7 | 32.3 | 43.2 |
| Median | 0.667 | 0.473 | 0.491 | 0.744 | 0.619 | 0.520 | 0.683 | 0.550 | 0.495 |
While the move from Instruction A to Instruction B1 or B2 showed the importance of formal training, the data from the duplicate IPs designated “Instruction B1” or “Instruction B2” showed no statistical difference between the pooled first or second measurement sets. Accordingly, data from B1 and B2 were pooled for further analysis and designated “Instruction B”.
Gray profiles in Figures 5 and 6 show the IP results from all subjects (M and F) following Instructions A and B, respectively. The profiles shown in red at each resistance and training condition are taken from the gray profiles after processing to show the 10th, 50th, and 90th percentile flow rate for the population at each 50 msec sampling time.
FIG. 5.

Individual flow profiles (gray) or volumetric flow rates exiting the mouthpiece of IFC vs. time from 20 volunteers (10 M, 10 F; 20 gray profiles per panel) after reading written instruction A (Fig. 3). IFC airflow resistance (R) is shown in each panel. Red profiles show the 10, 50, and 90 percentile IP in each case.
FIG. 6.

Individual flow profiles (gray) or volumetric flow rates exiting the mouthpiece of IFC vs. time from 20 volunteers (10 M, 10 F) after Instruction B (40 gray profiles, from B1 and B2, per panel). IFC airflow resistance (R) is shown in each panel. Red profiles show the 10, 50, and 90 percentile IP in each case.
The functional dependence of the 10, 50 (median), and 90 percentile PIFR values (Figs. 5 and 6) on reciprocal resistance is plotted in Figure 7 for this population. Figure 7 is valid for values of R in the range 0.018–0.046 kPa0.5L−1 min, although beyond this range, curvature of PIFR vs. 1/R is expected (in order to meet a zero intercept as R tends to infinity). There was no need to explore curvature at impractically large resistance values, however, as the selected linear functions were clearly appropriate for resistances that are encountered practically.
FIG. 7.

PIFR versus I/R from pooled data collected after (a) Instruction A (reading only) and (b) Instruction B (training by professional; r2 > 0.995). 10, 50, and 90 percentile values can be predicted based on a pre-selected value for R in the range 0.018–0.046 kPa0.5 L−1 min.
Inhalation profiles were less erratic after subjects received professional training (Instruction B) and values for PIFR appeared to increase. Equations 1–3 and Figure 7(a) describe the 90, 50, and 10 percentile values for PIFR in this population due to Instruction A; Equations 4–6 and Figure 7(b) apply to Instruction B.
Instruction A:
 |
 |
 |
Instruction B:
 |
 |
 |
where R < 0.046 > 0.018 kPa0.5 L−1 min and PIFR and R have units of L min−1 and kPa0.5L−1 min, respectively. Overall (Table 2), males had higher mean PIFR compared to females, and volunteers inhaled at larger flow rates with lower inter-subject variability when formally trained (Instruction B; there was no significant difference between normalized PIFR values for Instruction B1 and B2). Residuals from plots of PIFR vs. 1/R were randomly distributed and the observed positive linear relationship between PIFR and 1/R was consistent with the physiological literature where the slope of the regression line of PIFR vs. 1/R has been reported to give the square root of the “maximum” pressure drop across an inhaler for a given volunteer; this pressure drop reportedly stays approximately constant across the air flow resistances seen in marketed DPIs.(20)
Values for inhaled volume (V) and the time to the peak inspiratory flow rate, TPIFR, (Table 2) were resistance-independent. As expected however, V was clearly influenced by gender. Consistent with their larger total lung capacity(21) males had a mean value for V = 3.009 L after Instruction A. This was 1.45 L more than females (mean V = 1.562 L). After Instruction B, these values increased to 3.787 and 2.063 L, respectively. Formal training (Instruction B), caused a statistically significant improvement in V across gender (n = 20); mean V overall was 0.64 L greater than that seen after Instruction A (p < 0.0001). There was no apparent effect of gender on TPIFR but training once again was influential. A significant reduction of 0.3 seconds in mean TPIFR was observed after formal training [p < 0.0001].
Discussion
This study describes the data resulting from a clinical study of the breath profiles produced by differently trained, inhaler-naïve, normal human adults inhaling through variable resistances typical of those seen in marketed DPIs.(1,2) Because the leaflets supplied with different powder inhalers use different phrases to describe the actual inhalation maneuver, we adopted a standardized phrase for Step 3 of our written Instruction A: “breathe in as quickly and as deeply as you can” (Fig. 3). Our choice of phrase may have influenced the profiles shown in Figure 5, given that the respective phrases in leaflets for Aerolizer®, Diskhaler®, Novolizer®, Turbuhaler®, Easyhaler® and HandiHaler® were: “breathe in quickly and deeply,” “breathe in through your mouth steadily and as deeply as you can,” “inhale the powder with a deep breath,” “breathe in as deeply and as hard as you can,” “take a strong and deep breath,” and “breathe in deeply until your lungs are full.” Nevertheless, volunteers inhaled faster and deeper when they were trained using written instructions in combination with formal training from a pharmacist skilled in the use of inhalers, compared to the use of written instructions alone.
The study showed that formal training helped to reduce inter-subject variability in inhalation flow rate vs. time profiles; an observation that may translate into reduced variability in aerosol drug deposition in the lung. IP analysis showed that decreased air flow resistance produced increases in PIFR while V was unchanged. The results also showed that males inhaled faster and more deeply than females, although no significant relationships were observed between the spirometric results (Table 1) of volunteers and their observed inhalation variables (Fig. 4).
Because the scope of the present study was limited to 20 healthy volunteers, most of whom were in their prime, the reported IPs probably do not reflect those for subjects with significant reductions in lung capacity. While the time of PIFR, TPIFR, and the total inhaled volume V were unrelated to R in this study, the findings may not hold in all subjects. Sarinas et al., for example, showed that in CF, COPD, and asthma, V fell as resistance was increased.(9)
Gender and age, which influence mouth inspiratory pressure (MIP), have also been shown to influence inspiratory flow.(10–12) In spite of this limitation, the analysis below shows a general way of selecting standard IPs for use in realistic in vitro tests of inhalers during development. Indeed, because many drug and device development efforts, including aerosol deposition studies used for bridging purposes, begin with normal volunteers or largely asymptomatic patients, the present study was designed to ensure that the equations and general procedures for IP simulation that were developed could span the likely range of “normal” IPs needed to program a breath simulator for use with a realistic in vitro test method (Fig. 1). In addition we sought to offer IP ranges for volunteers who were representative of patients who had to teach themselves how to inhale after reading an instruction leaflet.
Simulating inhalation profiles for DPIs with different airflow resistances
Even though it is possible to program breath simulators with IPs that are almost identical to the individual breath profiles of volunteers, or the 10, 50, and 90 percentile IPs shown in red in Figures 5 and 6, and this is practiced by some scientists,16 profiles that are statistically representative of groups of subjects, that can be selected a priori, seem preferable for testing and development purposes.
To program a breath simulator to mimic IPs that were representative of those shown in Figures 5 and 6, we sought suitable equations and functions able to adequately describe the red profiles representing the 10, 50, and 90 percentile flow rate vs time curves shown in each panel. Ideally, parameters in the resulting equations should have physiologic meanings that relate to the variables shown in Figure 4. While we and others have described and used alternate methods previously,(1–3,22,23) we sought a simplified approach for use in future research with DPIs, in which it was only necessary to select the inhaler resistance (R) in order then to be able to define ranges of PIFR, TPIFR, and V; whence to generate a fan of appropriate IPs with which to test a new DPI. Because the approach and algorithm is simple, we hope that the method proposed here can be generalized to include realistic tests that extend to treatment of different patient groups with differently designed inhalers and use instructions.
The black curves in Figure 8 are the simulated flow rate vs time profiles that resulted from the following routine. They are clearly good descriptions of the real profiles (reproduced from Fig. 6) that represent the 10, 50, and 90 percentile IPs (Instruction B). The same approach can be used to generate curves that follow the red profiles in Figure 5 (Instruction A; not shown), while intermediate curves, for testing inhalers with different resistances can also be generated. Each panel of IPs (black curves; Fig. 8) was generated as follows from Equations 7–10
 |
 |
FIG. 8.

Simulated inhalation profiles (black curves) generated using Equations 7–10 for resistances shown in each panel and the algorithm described in the text. PIFR was calculated from Equations 4–6 (Instruction B); TPIFR = TPIFR50% = 0.49 s for all black curves, while values for V10%, V50%, and V90% were 1.4, 2.7, and 4.6 L. Gray (non-smooth) profiles shown for comparison are the 10, 50, and 90 percentile IPs from Figure 6.
Because AUC = V (Fig. 4) is given by integrating and adding Equations 7 and 8,
 |
Therefore,
 |
First, PIFR90%, PIFR50%, PIFR10% was calculated based on the DPI resistance, R (quoted in panel of Fig. 8) using Equations 4, 5, and 6, respectively. Second, a median value for TPIFR50% = 0.49 sec was selected and held constant; if required however, alternate values for TPIFR50% may be employed to produce different values for airflow acceleration (see distribution and legend in Figure 9). Notably, TPIFR was independent of R and log-normally distributed across the 240 IPs from this population. In spite of that observation, because the rising slope d(FR)/dt falls with decreasing PIFR (Fig. 6) and PIFR decreases with increasing R (Fig. 7), de Boer et al.'s reported relationship between the “flow increase rate (FIR)” and device resistance(24) still holds.
FIG. 9.

Distribution of values for TPIFR (seconds) across genders after Instruction B. The 10, 50, and 90 percentile values were 0.28, 0.49, and 0.88 seconds, respectively. Instruction A yielded a similar distribution with 10, 50, and 90 percentile values of 0.43, 0.66, and 1.68 seconds, respectively. Selection of the values for TPIFR and PIFR permits the study of device behavior at different flow accelerations according to Equation 7.
Third, V90%, V50%, and V10% values were assigned (4.6, 2.7, and 1.4 L, respectively), based on “across gender” data for V (Table 2; because values for V in males and females differ significantly, IPs simulated for single gender studies should be adjusted). Fourth, values were calculated for the inhalation time T90%, T50%, and T10% from Equation 10. Coupling the calculated and assigned values for PIFR, TPIFR, V, and T at their chosen percentiles, enables the calculation of flowrates leaving the mouthpiece at each value of time, t, from Equations 7 (t<TPIFR) and 8 (t>TPIFR).
These simulated profiles were plotted as the large, medium, and small profiles shown in black on Figure 8. In practice, breath simulators, such as the ASL 5000-XL, can be programmed directly using these sine wave equations, or data may be supplied directly in the form of a spreadsheet of simulated flow rates over time. An example of the use of these IPs to test a DPI with known resistance was described previously.(25)
Conclusion
A general method of selecting and simulating a range of inhaled flow rate versus time profiles for use in the realistic testing of powder inhalers has been described. Equations and an algorithm are presented that enable simulation of the range of inhalation flow rate vs. time curves used by normal human adult volunteers of both genders both before and after formal training in the use of powder inhalers. The approach enables the product designer to select breath profiles with which to study aerosol device performance across the likely inter-subject variability seen with DPIs of different resistances following either leaflet training alone, or formal training from a professional in addition to leaflet training.
Acknowledgments
The authors are grateful to Ingmar Medical in Pennsylvania for upgrading and loaning the ASL 5000-XL Breath Simulator and software (needed to simulate large inhaled volumes). The Medical College of Virginia Foundation and VCU's Center for Clinical and Translational Research Grant #UL1TR000058 supported the clinical trial.
RRD and XW acknowledge the support of VCU School of Pharmacy for support as graduate teaching assistants. Data analysis and manuscript preparation were supported in part by FDA grant 1U01FD004570.
Author Disclosure Statement
At the time of the investigation all authors were faculty and students at Virginia Commonwealth University. RRD is now employed by the US Food and Drug Administration that has not endorsed this work or influenced the statements made in this article. Supplies and equipment were purchased from commercial sources. No conflicts of interest exist.
References
- 1.Delvadia RR, Longest PW, and Byron PR: In vitro tests for aerosol deposition. I: Scaling a physical model of the upper airways to predict drug deposition variation in normal humans. J Aerosol Med Pulm Drug Deliv. 2012;25:32–40 [DOI] [PubMed] [Google Scholar]
- 2.Delvadia RR, Hindle M, Longest PW, and Byron PR: In vitro tests for aerosol deposition. II: IVIVCs for different dry powder inhalers in normal adults. J Aerosol Med Pulm Drug Deliv. 2013;26:138–144 [DOI] [PubMed] [Google Scholar]
- 3.Delvadia RR, Longest PW, Hindle M, and Byron PR: In vitro tests for aerosol deposition. III: Effect of inhaler insertion angle on aerosol deposition. J Aerosol Med Pulm Drug Deliv. 2013;26:145–156 [DOI] [PubMed] [Google Scholar]
- 4.Longest PW: VCU Mouth Throat (MT) models. http://www.rddonline.com/resources/tools/models.php Accessed Feb. 16, 2015
- 5.Clark AR, and Hollingworth AM: The relationship between powder inhaler resistance and peak inspiratory conditions in healthy volunteers—Implications for in vitro testing. J Aerosol Med. 1993;6:99–110 [DOI] [PubMed] [Google Scholar]
- 6.General Chapter (601) Aerosols, Nasal Sprays, Metered Dose Inhalers, and Dry Powder Inhalers. United States Pharmacopeia and National Formulary (USP 36-NF 31). United States Pharmacopeia Convention: Rockville USA; pp. 242–262, 2013 [Google Scholar]
- 7.Broeders ME, Sanchis J, Levy ML, Crompton GK, and Dekhuijzen PN. The ADMIT series—Issues in inhalation therapy. 2. Improving technique and clinical effectiveness. Prim Care Respir J. 2009;18:76–82 [DOI] [PMC free article] [PubMed] [Google Scholar]
- 8.van Beerendonk I, Mesters I, Mudde AN, and Tan TD: Assessment of the inhalation technique in outpatients with asthma or chronic obstructive pulmonary disease using a metered-dose inhaler or dry powder device. J Asthma. 1998;35:273–279 [DOI] [PubMed] [Google Scholar]
- 9.Sarinas PS, Robinson TE, Clark AR, Canfield J, Jr., Chitkara RK, and Fick RB, Jr: Inspiratory flow rate and dynamic lung function in cystic fibrosis and chronic obstructive lung diseases. Chest. 1998;114:988–992 [DOI] [PubMed] [Google Scholar]
- 10.Broeders ME, Molema J, Hop WC, Vermue NA, and Folgering HT: The course of inhalation profiles during an exacerbation of obstructive lung disease. Respir Med. 2004;98:1173–1179 [DOI] [PubMed] [Google Scholar]
- 11.Malmberg LP, Rytila P, Happonen P, and Haahtela T: Inspiratory flows through dry powder inhaler in chronic obstructive pulmonary disease: Age and gender rather than severity matters. Int J Chron Obstruct Pulmon Dis. 2010;5:257–262 [DOI] [PMC free article] [PubMed] [Google Scholar]
- 12.Baba K, Tanaka H, Nishimura M, Yokoe N, Takahashi D, Yagi T, Yamaguchi E, Maeda Y, Muto T, and Hasegawa T: Age-dependent deterioration of peak inspiratory flow with two kinds of dry powder corticosteroid inhalers (Diskus and Turbuhaler) and relationships with asthma control. J Aerosol Med Pulm Drug Deliv. 2011;24:293–301 [DOI] [PubMed] [Google Scholar]
- 13.Delvadia RR: In vitro methods to predict aerosol drug deposition in normal adults. Doctor of Philosophy. Virginia Commonwealth University: Richmond, USA, 2012 [Google Scholar]
- 14.Byron PR, Wei X, Delvadia RR, and Longest PW: Standardizing in vitro test methods to support aerosol drug evaluation in the clinic. In: Dalby R, Byron PR, Peart J, Suman JD, Young PM, and Traini D, (eds). RDD Europe 2013. Vol 1. DHI Publishing: River Grove, IL; pp. 85–92, 2013 [Google Scholar]
- 15.Wei X, Byron PR, and Longest PW: Predicting variations in lung dose with different mouth-throat models. In: Dalby R, Byron PR, Peart J, Farr SJ, Suman JD, Young PM, and Traini D, (eds). Respiratory Drug Delivery 2014. Vol 3. DHI Publishing: River Grove, IL; pp. 773–776, 2014 [Google Scholar]
- 16.Olsson B, Borgstrom L, Lundback H, and Svensson M: Validation of a general in vitro approach for prediction of total lung deposition in healthy adults for pharmaceutical inhalation products. J Aerosol Med Pulm Drug Deliv. 2013;26:355–369 [DOI] [PubMed] [Google Scholar]
- 17.Byron PR, Hindle M, Lange CF, Longest PW, McRobbie D, Oldham MJ, Olsson B, Thiel CG, Wachtel H, and Finlay WH: In vivo-in vitro correlations: Predicting pulmonary drug deposition from pharmaceutical aerosols. J Aerosol Med Pulm Drug Deliv. 2010;23 Suppl 2:S59–69 [DOI] [PubMed] [Google Scholar]
- 18.Marion MS, Leonardson GR, Rhoades ER, Welty TK, and Enright PL: Spirometry reference values for American Indian adults: Results from the Strong Heart Study. Chest. 2001;120:489–495 [DOI] [PubMed] [Google Scholar]
- 19.Miller MR, Hankinson J, Brusasco V, Burgos F, Casaburi R, Coates A, Crapo R, Enright P, van der Grinten CP, Gustafsson P, Jensen R, Johnson DC, MacIntyre N, McKay R, Navajas D, Pedersen OF, Pellegrino R, Viegi G, and Wanger J: Standardisation of spirometry. Eur Respir J. 2005;26:319–338 [DOI] [PubMed] [Google Scholar]
- 20.Smutney CC, Friedman EM, Polidoro JM, and Amin N: Inspiratory efforts achieved in use of the Technosphere insulin inhalation system. J Diabetes Sci Technol. 2009;3:1175–1182 [DOI] [PMC free article] [PubMed] [Google Scholar]
- 21.Hankinson JL, Odencrantz JR, and Fedan KB: Spirometric reference values from a sample of the general U.S. population. Am J Respir Crit Care Med. 1999;159:179–187 [DOI] [PubMed] [Google Scholar]
- 22.Longest PW, Tian G, Delvadia R, and Hindle M: Development of a stochastic individual path (SIP) model for predicting the deposition of pharmaceutical aerosols: Effects of turbulence, polydisperse aerosol size, and evaluation of multiple lung lobes. Aerosol Sci Technol. 2012;46:1271–1285 [Google Scholar]
- 23.Longest PW, Tian G, Walenga RL, and Hindle M: Comparing MDI and DPI aerosol deposition using in vitro experiments and a new stochastic individual path (SIP) model of the conducting airways. Pharm Res. 2012;29:1670–1688 [DOI] [PubMed] [Google Scholar]
- 24.de Boer AH, Bolhuis GK, Gjaltema D, and Hagedoorn P: Inhalation characteristics and their effects on in vitro drug delivery from dry powder inhalers: Part 3: The effect of flow increase rate (FIR) on the in vitro drug release from the Pulmicort 200 Turbuhaler. Intl J Pharmaceut. 1997;153:67–77 [Google Scholar]
- 25.Byron PR, Wei X, Delvadia RR, Longest PW, and Venitz J: Breath profiles for testing new DPI devices in development. In: Dalby R, Byron PR, Peart J, Farr SJ, Suman JD, Young PM, and Traini D, (eds). Respiratory Drug Delivery 2014. Vol 1 DHI Publishing: River Grove, IL; pp. 295–302, 2014 [Google Scholar]