Abstract
Although nicotinamide nucleotide transhydrogenase (NNT)–deficient C57BL/6J (6J) mice are known to be highly susceptible to diet-induced metabolic disease, this notion stems primarily from comparisons of 6J mice to other inbred strains. To date, very few studies have directly compared metabolic disease susceptibility between NNT-deficient 6J mice and NNT-competent C57BL/6 substrains. In this study, comprehensive profiling of the metabolic response to a high-fat/high-sucrose diet (HFD) were compared across time in 6J and C57BL/6NJ (6N) mice. Given that increased peroxide exposure drives insulin resistance, coupled with the fact that NNT regulates peroxide detoxification, it was hypothesized that 6J mice would experience greater derangements in redox homeostasis/metabolic disease upon HFD exposure. Contrary to this, both lines were found to be highly susceptible to diet-induced metabolic disease, as evidenced by impairments in glucose tolerance as early as 24 h into the HFD. Moreover, various markers of the metabolic syndrome, as well as peroxide stress, were actually blunted, rather than exacerbated, in the 6J mice, likely reflecting compensatory increases in alterative redox-buffering pathways. Together, these data provide evidence that the susceptibility to HFD-induced metabolic disease is similar in the 6J and 6N substrains. Given the numerous genetic variances in the 6J stain, including loss of NNT function, these findings suggest that the 6N substrain is the more logical and representative genetic background model for metabolic studies.
Introduction
C57BL/6J (6J) mice are one of the most widely used genetic strains in the field of diabetes research. These mice display symptoms of glucose intolerance as early as 6 weeks of age (1) and are highly susceptible to the development of obesity, insulin resistance, and overt type 2 diabetes when placed on a high-fat diet (2,3). In an elegant series of experiments conducted by Toye et al. (4), the glucose-intolerant phenotype of the 6J strain was mapped to a naturally occurring in-frame five-exon deletion within the nicotinamide nucleotide transhydrogenase (NNT) gene (5,6). Follow-up experiments in which functional NNT was reintroduced via transgenic expression successfully rescued the impaired insulin secretion/glucose clearance phenotype of the 6J mice (5), thus confirming NNT loss of function as the source of glucose intolerance. The absence of NNT is thought to elevate mitochondrial peroxide exposure within the β-cell in response to glucose uptake and metabolism, thereby lowering the ATP/ADP ratio (through an as-yet-unidentified mechanism), delaying closure of the KATP channel, and ultimately impairing insulin secretion (7).
The loss of function mutation in the NNT gene originates exclusively from the 6J substrain produced by The Jackson Laboratory (http://jaxmice.jax.org/strain/000664.html). Several other C57BL/6 substrains, such as C57BL/6NTac and C57BL/6N (6N), express functional NNT and present with superior glucose tolerance compared with their 6J counterparts (8). Despite functional NNT, the 6N substrains still appear to develop multiple features of the metabolic syndrome (e.g., obesity, glucose intolerance, and insulin resistance) when fed a high-fat diet, suggesting that NNT loss of function does not solely drive diet-induced metabolic disease in the 6J strain. In fact, the rationale within the field to use 6J mice as the model of choice for metabolic research stems primarily from studies comparing diet-induced metabolic disease susceptibility between 6J mice and other recombinant inbred strains (e.g., A/J, DBA/2, and BALB/c), rather than 6J to 6N mice (2,3,9). At present, only a few studies have directly compared the metabolic response to a high-fat/high-sucrose diet (HFD) in 6J versus 6N mice, resulting in conflicting reports with respect to diet-induced obesity (10,11). In these studies, the degree of glucose intolerance induced by HFD in both strains was similar, despite higher area under the curve for blood glucose being evident in the 6J mice for both chow and HFD conditions.
In addition to NNT, recent evidence details widespread genetic variation encompassing multiple single nucleotide polymorphisms, small indels, and structural variants that distinguish the 6J and 6N substrains (8). Affected genes span various biological pathways and as such likely account for the numerous phenotypic differences documented between 6J and 6N mice (8). Despite clear genotypic and phenotypic disparity between 6J and 6N mice, the two lines are often referred to interchangeably as “C57BL/6” mice, creating both discrepancy and confusion within the field. To this point, in a recent review of the literature, Fontaine and Davis (12) reported that <50% of studies incorporating a genetic mouse model conducted over the last several years have specifically detailed the background strain used (12). Moreover, because embryonic stem cells derived from 6J mice have low rates of germline transmission, embryonic stem cells derived from 6N donors have at times been used with 6J mice, thus leading to the generation of knockout mice on a mixed background (12). This issue becomes increasingly problematic when selecting the proper control strain, as evidence exists in the literature in which opposite disease susceptibility phenotypes have been observed when comparing a knockout mouse model to wild-type controls on a 6J versus 6N background (13).
Over the past decade, numerous genetic models have been shown to result in the attenuation or exacerbation of diet-induced metabolic disease and as such have led to the establishment of potential mechanisms of insulin resistance within the field. Examples of such mechanisms include cytotoxic lipid accumulation, activation of inflammatory pathways, and alterations in redox homeostasis, to name a few. To date, no study has sought to validate a given mechanism within both 6J and 6N mice, thus creating difficulty in ascertaining whether specific research findings might translate to the human population in which NNT is functional. Because the creation of genetic models within multiple background strains presents an unrealistic financial burden, it would appear that consistency with respect to a given C57BL/6 substrain is warranted. The current study was designed to directly compare multiple facets of the metabolic syndrome across multiple time points of an HFD intervention in both 6J and 6N mice from the same vendor (The Jackson Laboratory). Given the strong association between alterations in cellular redox status and insulin resistance (14–16), diet-induced changes in liver and skeletal muscle redox homeostasis were simultaneously assessed. Because NNT-derived NADPH appears to be essential for matrix peroxide detoxification in both liver (17) and skeletal muscle mitochondria (18), it was hypothesized that HFD feeding would exacerbate derangements in redox homeostasis in the 6J line, which in turn was expected to increase the severity of metabolic disease. Results revealed that although loss of NNT in the 6J line drastically increased mitochondrial peroxide emission in vitro, both 6J and 6N mice displayed a similar susceptibility to HFD-induced metabolic disease. In fact, contrary to the initial hypothesis, several characteristics of the metabolic syndrome were found to be more severe in the 6N line, including alterations in redox homeostasis. Given that humans express functional NNT, these data suggest that the 6N substrain is a more representative model system for studies designed to elucidate the mechanisms by which nutrient excess drives the metabolic syndrome.
Research Design and Methods
All animal studies were approved by the East Carolina University Institutional Animal Care and Use Committee. C57BL/6J (6J) and C57BL/6NJ (6N) mice at 6 weeks of age were purchased from The Jackson Laboratory. Upon arrival, all mice were housed five mice per cage in a temperature- (22°C) and light-controlled (12 h light/12 h dark) room and maintained on a standard chow diet. At 8 weeks of age, mice were switched to a 10% low-fat/low-sucrose diet (LFD) (catalog number D12450J; Research Diets, Inc.) or 45% HFD (catalog number D12451; Research Diets, Inc.) for the indicated periods of time with free access to food and water. Due to excessive fighting, mice were individually housed ∼2 weeks into the 6-week diet intervention. For consistency, mice were individually housed for the 24-h and 1-week HFD interventions as well. For experiments designed to assess in vivo insulin signaling, mice were fed a 10% LFD or 45% HFD for a period of 7 days. On the morning of day 7, mice were fasted for 3 h, anesthetized (via isoflurane) 20 min following intraperitoneal insulin (1 U/kg fat-free mass [FFM]) injection, and gastrocnemius muscles and livers were extracted for Western blotting experiments. All other terminal surgeries in which tissues were harvested were done in 2-h fasted mice anesthetized with ketamine/xylazine.
Glucose/Insulin Tolerance Testing
All experiments were performed following a 4-h fast at ∼12:00 p.m., unless otherwise stated. Blood glucose was monitored using the Blood Glucose Alpha Track Monitoring System from samples collected at the distal tail vein. Following an initial blood glucose measurement, glucose (2 g/kg FFM) or insulin (0.5 U/kg FFM) was injected intraperitoneally, and glucose measurements were made every 10–20 min for a period of 90–120 min. Insulin was assessed using a commercially available ELISA kit (Merck Millipore).
[3+H]2-Deoxyglucose Uptake
Immediately after removal, extensor digitorum longus muscles were placed inside prefilled wells containing Krebs-Henseleit buffer plus 1 mmol/L pyruvate with continuous bubbling of 95% O2 and 5% CO2 inside a temperature-controlled (37°C) water bath. Following a 20-min preincubation period, muscles were transferred to fresh wells, which did or did not contain insulin (50 mU/mL), for 30 min. Muscles were then transferred to incubation wells containing 5 mmol/L 2-deoxyglucose (2-DG), 10 mmol/L mannitol, 0.2 µCi/mL [3+H]2-DG, 0.01 µCi/mL [14C]d-mannitol, with or without insulin (50 mU/mL). After incubation, muscles were transferred to ice-cold Krebs-Henseleit buffer to stop the reaction, trimmed of connective tissue, and flash frozen until time of analysis. Frozen muscles were weighed and solubilized in 0.1 mL of 0.5 N NaOH. Solubilized muscles and incubation media samples were counted in a Beckman LS 5000 TD liquid scintillation counter preset to count 14C and 3H channels simultaneously. Data are expressed as micromoles per gram per hour.
Assessment of Whole-Body Energy Metabolism
The TSE LabMaster System (TSE Systems, Chesterfield, MO) was used to determine VO2 and VCO2, respiratory exchange ratio, food and water intake, and energy expenditure. Infrared sensors were used to record ambulatory activity in three-dimensional axes (x, y, and z). All reported measurements represent the average of at least two 12-h light or dark cycles. Measurements of fat and lean body mass were determined using the EchoMRI-500 (EchoMRI, Houston, TX).
Preparation of Permeabilized Fiber Bundles and Isolated Mitochondria
Fiber bundle preparation was adapted from previous methods and has been thoroughly described (19). Permeabilized fibers were prepared from both red gastrocnemius (RG) and white gastrocnemius (WG) muscle. Isolated mitochondria were prepared from livers of 6J and 6N mice via differential centrifugation. Livers were homogenized in mitochondrial isolation buffer (300 mmol/L sucrose, 10 mmol/L HEPES, 1 mmol/L EGTA, and 1 mg/mL BSA [pH 7.1]). Homogenate was spun at 500 × g for 10 min, and the resulting supernatant was spun at 9,000 × g for 10 min, both at 4°C. The mitochondrial pellet was washed in mitochondrial isolation buffer without BSA and spun down again at 9,000 × g for 10 min at 4°C. Final mitochondrial pellets were resuspended in mitochondrial isolation buffer without BSA, and protein content was determined via the Pierce BCA protein assay (Thermo Fisher Scientific).
Mitochondrial Respiration and H2O2 Emission Measurements
High-resolution O2 consumption measurements were conducted at 37°C in buffer Z, supplemented with creatine monohydrate (20 mmol/L), using the OROBOROS O2K Oxygraph as previously described (18). Mitochondrial H2O2 emission was measured fluorometrically at 37°C via Amplex Ultra Red (10 μmol/L)/horseradish peroxidase (3 U/mL) detection system (excitation/emission 565/600) (18). Blebbistatin (25 μmol/L) was present during all O2 consumption and H2O2 emission experiments involving permeabilized fibers to prevent contraction (19). For hydrogen peroxide emission rate (JH2O2) experiments involving liver mitochondria, 0.1 mg/mL mitochondria was used for each assay. All O2 consumption and H2O2 emission experiments were brief protocols conducted at normoxia (∼200 nmol O2/mL).
Reduced Glutathione, Glutathione Disulfide, and Reduced Glutathione/Glutathione Disulfide
Reduced glutathione (GSH) and glutathione disulfide (GSSG) were measured using high-performance liquid chromatography (HPLC) (20–22). Briefly, skeletal muscle (tibialis anterior) and liver were homogenized in a buffer containing 50 mmol/L Trizma base supplemented with 20 mmol/L boric acid, 20 mmol/L L-serine, and 10 mmol/L N-ethylmaleimide (NEM). NEM is an alkylating agent that will both conjugate GSH and inhibit glutathione reductase, limiting auto-oxidation effects during sample preparation. The tissue homogenate is then split into two derivatization pathways for the detection of GSH and GSSG. For GSH derivatization, 280 μL of the homogenate was deproteinated with 1:10 (v/v) 15% trichloroacetic acid and then centrifuged for 5 min at 20,000 × g. The supernatant was transferred to an autosampler vial for processing by HPLC. GSH samples were run on freshly made mobile phase containing 92.5% of a 0.25% (v/v) glacial acetic acid mixed with 7.5% pure HPLC-grade acetonitrile. Samples were run using a Shimadzu Prominence HPLC system equipped with a Premier C18 column (4.6 × 150 mm. 5 μm; part 220-91199-12; Shimadzu) at flow rate of 1.0 mL/min. GSH–NEM conjugate was detected by ultraviolet chromatography at a wavelength of 265 nmol/L (SPD-20A; Shimadzu). Samples were quantified using standards prepared under identical conditions and normalized to the protein content measured in the muscle homogenate by bicinchoninic acid assay.
For GSSG derivatization, 200 μL cell homogenate was deproteinized in 200 μL 15% perchloric acid, and centrifuged for 5 min at 20,000 × g. The resulting supernatant (200 μL) was diluted in 1,000 μL of 0.1 mol NaOH twice to increase pH before reacting with 0.1% O-phthaladehyde. O-phthaladehyde reacts with GSSG at high pH (∼12) to form a fluorescent product detectable at excitation/emission wavelengths of 350/420. GSSG samples were processed using a 25 mmol/L sodium phosphate buffer containing 15% HPLC-grade methanol at pH of 6. Samples were run through a Shimadzu Prominence HPLC system equipped with a Purospher STAR RP-18 endcapped column (4.6 × 150 mm, 3 μm; EMD Millipore) at flow rate of 0.5 mL/min. Samples were quantified using standards prepared under identical conditions and normalized to the protein content measured in the muscle homogenate by bicinchoninic acid assay.
Western Blotting and Malondialdehyde Assay
Tibialis anterior muscles and livers were homogenized in RIPA buffer (#89901; Thermo Scientific), supplemented with protease/phosphatase inhibitor cocktails (Roche) for detection of catalase, superoxide dismutase 2 (SOD2), isocitrate dehydrogenase 2 (IDH2), and 4-hydroxynonenol (HNE) by Western blotting. For experiments involving insulin-stimulated tissues, gastrocnemius muscles and livers were homogenized in SDS lysis buffer (20 mmol/L Tris-HCl, 10 mmol/L NaF, 1 mmol/L EDTA, 4% SDS, and 20% glycerol [pH 6.8]), supplemented with protease/phosphatase inhibitor cocktails (Roche). Primary antibodies used were purchased from Abcam (catalog numbers ab1877; SOD2, ab13533; and IDH2, ab131263), Percipio Biosciences (HNE; 24325), Cell Signaling Technology (phosphorylated [p]-Akt, 4060; Akt, 9272; p-GSK-3β, 9336; and GSK-3β, 9315), and Sigma-Aldrich (GAPDH; G8795). Malondialdehyde (MDA) was assessed in tibialis anterior and liver lysates using a commercially available assay kit (Northwest Life Science Specialties).
Statistics
Data are presented as mean ± SEM. Statistical analyses were performed using t tests or one-way ANOVA with Student-Newman-Keuls methods for analysis of significance among groups. The level of significance was set at P < 0.05.
Results
Mitochondrial Peroxide Buffering Is Compromised in Skeletal Muscle of 6J Mice
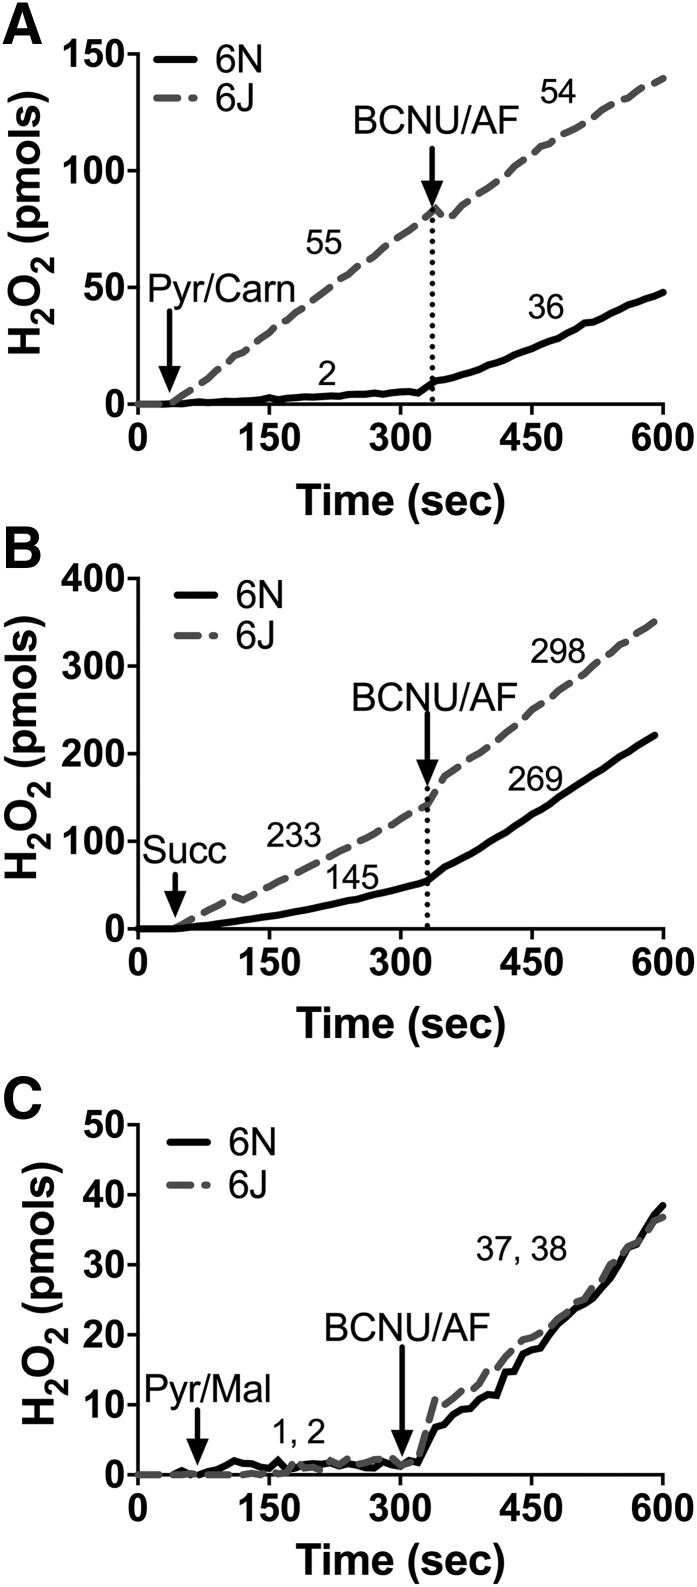
Mitochondrial glutathione and thioredoxin in conjunction with their respective peroxidase and reductase enzyme systems carry out the reduction of H2O2 to water within the matrix. Both systems rely on NNT, NADP+ linked isocitrate dehydrogenase, and malic enzyme to supply the NADPH required for H2O2 detoxification. The capacity of each mitochondrial NADPH source to support peroxide buffering can be measured in situ by manipulating the type of carbon substrate supplied and assessing net mitochondrial H2O2 emission in the absence and presence of reductase inhibitors. To determine the impact of NNT loss on mitochondrial peroxide emission, permeabilized skeletal muscle fiber bundles were prepared from 6J and 6N mice and studied during respiration supported by pyruvate plus carnitine or succinate, two substrate conditions that isolate NNT as the primary source of NADPH. With pyruvate plus carnitine: 1) entry of acetyl-CoA into the tricarboxylic acid (TCA) cycle is limited due to low oxaloacetate, 2) product inhibition is minimized by conversion of acetyl-CoA to acetyl-carnitine via the carnitine acetyl-transferase reaction (18), 3) H2O2 is produced directly by the pyruvate dehydrogenase complex (23), and 4) sufficient NADH is generated to charge the mitochondrial membrane potential (ΔΨm) and support NNT activity (18). With succinate: 1) electrons feed directly into the quinone pool via complex II to charge ΔΨm, 2) high rates of H2O2 are generated by complex I due to reverse electron flow from the quinone pool to complex I, 3) elevated NADH/NAD+ supports NADPH production from NNT, and 4) malate–phosphate exchange limits the contribution of malic enzyme to the matrix NADPH pool. Under both substrate conditions, initial rates of H2O2 emission were markedly higher in fibers from 6J versus 6N mice (Fig. 1A, Pyr/Carn; Fig. 1B, Succ). Subsequent inhibition of glutathione reductase (carmustine) and thioredoxin reductase 2 (auranofin [AF]) raised H2O2 emission rates in 6N fibers to near rates obtained in 6J fibers (Fig. 1A and B), confirming that the higher rates of H2O2 emission initially evident in 6J fibers result from lower peroxide buffering capacity (presumably due to NNT absence) rather than increased H2O2 production. Fibers were also studied during respiration supported by pyruvate in the presence of malate, which allows entry of acetyl-CoA into the TCA cycle and NADPH generation from IDH2. Under these conditions, no differences in H2O2 emission were observed between 6J and 6N fibers (Fig. 1C), indicating NADPH generated by the TCA cycle fully compensates for the absence of NNT in 6J fibers. Together, these data highlight the contribution of NNT to regulating skeletal muscle mitochondrial peroxide emission and confirm NNT loss of function in the 6J mice.
Figure 1.
Loss of NNT increases JH2O2 emitting potential in permeabilized fibers. Permeabilized fibers were prepared from RG of 6N and 6J mice. JH2O2 emission was assessed via the Amplex Ultra Red/horseradish peroxidase system, and resorufin fluorescence was converted to pmoles of H2O2 via an H2O2 standard curve. A: Representative trace of an JH2O2 emission experiment performed in the presence of pyruvate (Pyr; 1 mmol) plus carnitine (Carn; 5 mmol) in 6N and 6J fibers. After 5 min, carmustine (BCNU; 100 μmol) and AF (1 μmol) were added to inhibit peroxide buffering. Numbers above each trace section correspond to the mean rates of JH2O2 emission (pmol/s/mg dry weight) for that condition from N = 5 experimental replicates. B and C: Same experimental design as in A, except substrate condition was succinate (10 mmol) (B) or pyruvate (1 mmol) plus malate (2 mmol) (C). For C, the first number listed is for 6N mice, followed by 6J.
Glucose Intolerance Develops Within 24 Hours Following HFD Treatment in 6J and 6N Mice
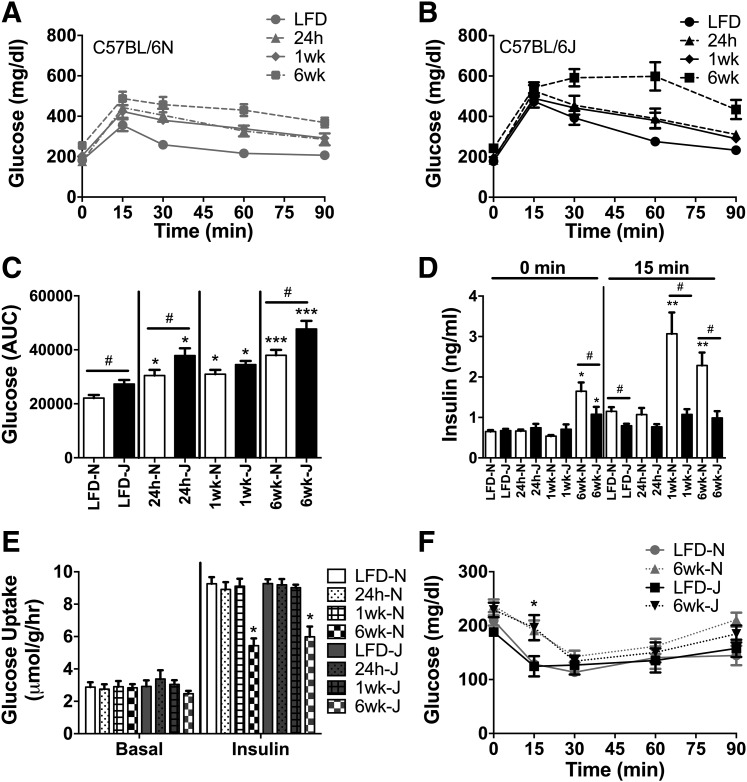
To examine whether the absence of NNT increases the susceptibility to diet-induced glucose intolerance/insulin resistance, metabolic responses were assessed in 6J and 6N mice 24 h, 1 week, and 6 weeks after beginning a 45% HFD. Glucose tolerance decreased in both strains within 24 h and continued to worsen at the 1- and 6-week time points (Fig. 2A–C). As previously reported (8,18), 6J mice were less glucose tolerant than 6N mice prior to starting the diet, and this difference persisted through the 6 weeks of HFD. The lower glucose intolerance in 6J mice is generally attributed to impaired glucose-stimulated insulin secretion from pancreatic islets (24,25). Consistent with this, blood insulin responses were lower during the intraperitoneal glucose tolerance tests (IPGTT) under LFD conditions in 6J mice (Fig. 2D, 15 min). Elevated fasting insulin was evident in both strains after 6 weeks on the HFD, although the effect was more pronounced in the 6N line (Fig. 2D, 0 min). Insulin responses during the IPGTT were also increased in the 6N mice after 1 and 6 weeks on the HFD, consistent with the development of whole-body insulin resistance (Fig. 2D, 15 min). Insulin responses to the IPGTT were negligible in the 6J mice over the entire 6 weeks (Fig. 2D, 15 min). Collectively, these data confirm the mild glucose-intolerant phenotype of 6J relative to 6N mice on a chow diet. This difference in glucose tolerance between the genetic lines persisted over the 6-week HFD. However, contrary to the hypothesis, 6J and 6N mice were equally susceptible to the HFD, undergoing similar relative increases in glucose intolerance over the 6-week feeding period.
Figure 2.
HFD-induced glucose intolerance develops rapidly in 6N and 6J mice. IPGTT (2 g glucose/kg FFM) were performed in 6N (A) and 6J (B) mice fed a low-fat control diet or HFD for 24 h, 1 week, or 6 weeks following a 4-h fast. C: Area under the curve (AUC) during the IPGTT for all groups from 6N and 6J mice. D: Insulin during the IPGTT test, assessed at baseline (0 min) and 15 min following glucose injection (15 min). E: [3H]2-DG uptake in the absence and presence of insulin (50 mU/mL) in isolated extensor digitorum longus muscles from 6N and 6J mice fed an LFD or HFD for 24 h, 1 week, or 6 weeks. F: Changes in blood glucose following intraperitoneal insulin injection (0.6 U/kg FFM) in 6N and 6J mice fed an LFD or HFD for a period of 6 weeks. Different from respective low-fat control group: *P < 0.05, **P < 0.001, ***P < 0.0001; difference between 6N and 6J mice within a respective diet group: #P < 0.05. Data are mean ± SEM; N = 8–10/group.
Strain Differences in HFD-Mediated Impairments in Skeletal Muscle/Liver Insulin Action
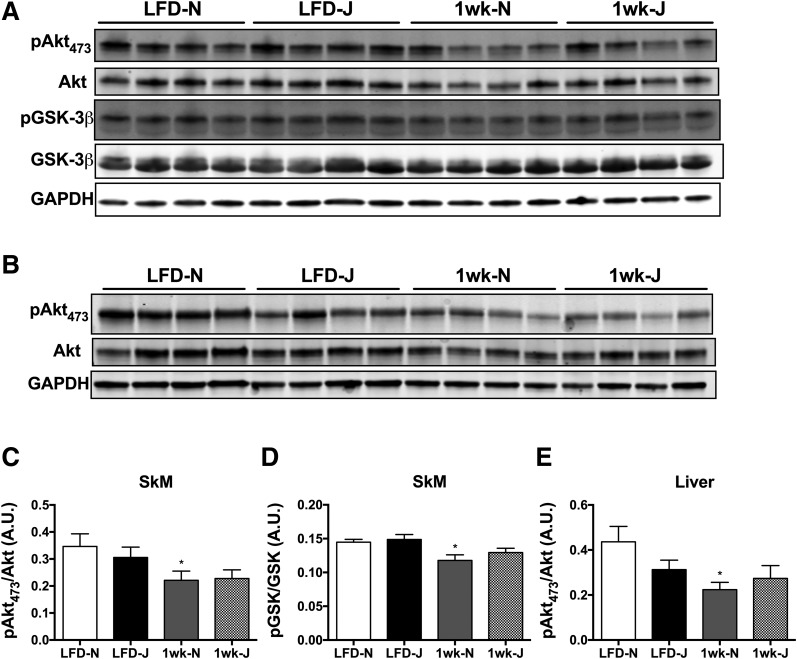
To determine potential strain differences in skeletal muscle insulin action as well as the contribution of skeletal muscle to diet-induced glucose intolerance, insulin-stimulated [3H]2-DG uptake was assessed in extensor digitorum longus muscles from 6J and 6N mice. Basal 2-DG uptake was similar between strains and was unaffected by HFD (Fig. 2E, Basal). Insulin-stimulated 2-DG uptake was unaltered following 24 h or 1 week on an HFD, but was significantly reduced in both strains to a similar degree at the 6-week mark (Fig. 2E, Insulin). Consistent with the 2-DG uptake data, the rate of decrease in plasma glucose during the first 15 min of an insulin tolerance test was blunted to a similar degree in both 6J and 6N mice after 6 weeks on an HFD (Fig. 2F). To determine if strain differences were apparent within the insulin-signaling pathway, insulin-stimulated Akt signaling was assessed in skeletal muscle and livers of 6J and 6N mice fed an LFD or HFD for 1 week. For these experiments, tissues were extracted 20 min following intraperitoneal insulin injection. Insulin-stimulated phosphorylation of Akt, as well as glycogen synthase kinase, was blunted by the HFD in skeletal muscle (Fig. 3A, C, and D) and liver (Fig. 3B and E) of the 6N line. Interestingly, phosphorylation of Akt tended to be lower in both skeletal muscle and liver of 6J compared with 6N mice on the LFD, suggesting potential strain differences within the insulin-signaling pathway.
Figure 3.
Differences in insulin-stimulated Akt signaling in skeletal muscle and liver of 6J and 6N mice fed an HFD for 1 week. Representative blots from skeletal muscle (A) and liver (B) lysates probed for p-Akt (serine 473), total Akt, p-GSK-3β, total GSK-3β, and GAPDH. C–E: Quantitation of p-Akt and p-GSK-3β blots normalized to total Akt and GSK-3β, respectively. *Different from respective low-fat control group (P < 0.05). Data are mean ± SEM; N = 7 to 8/group. A.U., arbitrary units. SkM, skeletal muscle.
Differences in Whole-Body Calorimetry and Body Composition Between 6J and 6N Mice
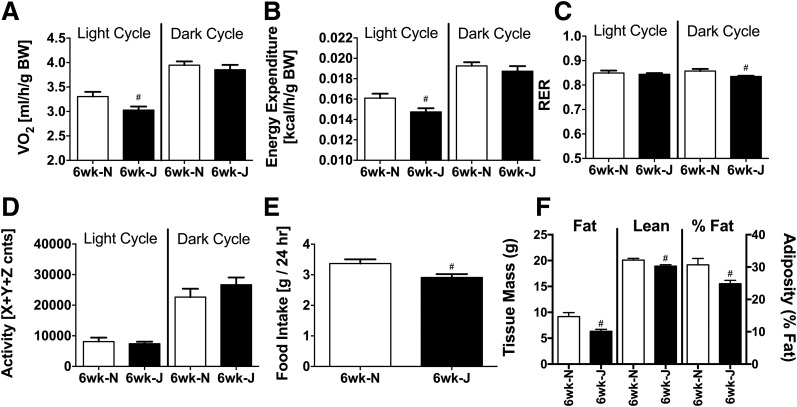
In addition to serving as a model for diet-induced glucose intolerance, 6J mice are commonly used in metabolic studies because of their propensity to gain excess body fat when fed an HFD compared with other inbred strains (2,10). Recent evidence suggests that NNT activity may contribute to energy expenditure, providing a potential mechanism for the greater rate of fat accumulation and weight gain when NNT is missing (2,8,10,18). Consistent with this notion, and similar to 6Js on an LFD (8,18), 6Js on the HFD were characterized by lower whole-body oxygen consumption (Fig. 4A) and energy expenditure (Fig. 4B), specifically during the light cycle. Surprisingly, however, the rate of body weight gain was slightly lower in 6J versus 6N mice over the 6-week HFD period (data not shown). 6J mice were also characterized by lower fat mass, lean mass, and percent adiposity (Fig. 4F). Food intake (Fig. 4E) and respiratory exchange ratio (Fig. 4C) were also slightly lower in the 6Js, whereas ambulatory activity (Fig. 4D) was not different between the two lines.
Figure 4.
Lower whole-body oxygen consumption/energy expenditure in 6J mice fed an HFD. A–D: Indirect metabolic calorimetry in 6N and 6J mice fed an HFD for 6 weeks. Oxygen consumption (A) and calculated energy expenditure (B) per gram of body mass. Respiratory exchange ratio (RER; C) and ambulatory activity (D). cnts, counts. #Difference between 6N and 6J mice within a given light cycle (P < 0.05). E: Food intake in grams recorded over a 48-h period. #Difference between 6N and 6J mice (P < 0.05). F: Lean mass, fat mass, and percent adiposity in 6N and 6J mice fed an HFD for 6 weeks. #Difference between 6N and 6J mice (P < 0.05). Data are mean ± SEM; N = 6–8/group. BW, body weight.
Elevations in Mitochondrial H2O2 Emitting Potential Coincide With Skeletal Muscle Insulin Resistance
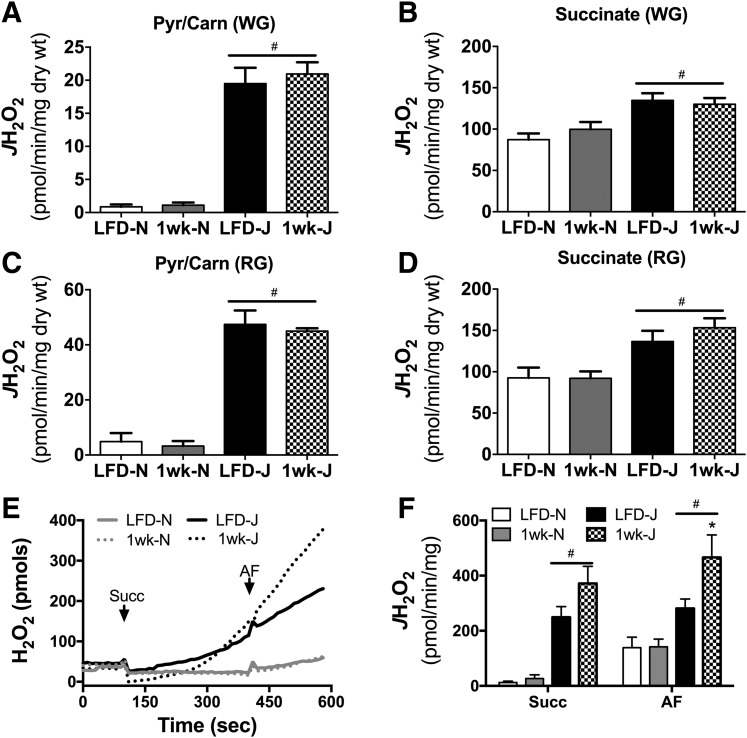
Given NNT’s role in peroxide buffering, it was hypothesized that loss of NNT in the 6J line might potentiate diet-induced changes in mitochondrial H2O2 emitting potential and whole-cell redox status. To address this question, mitochondrial JH2O2 emitting potential was measured in permeabilized fiber bundles and isolated mitochondria prepared from livers of 6J and 6N mice fed an HFD for 1 week or 6 weeks, as well as LFD controls. In fibers, 1 week of HFD did not alter JH2O2 emission supported by pyruvate/carnitine (Fig. 5A and C) or succinate (Fig. 5B and D), regardless of muscle type (RG or WG) or strain. As expected, absolute H2O2 emission rates were higher for all substrate conditions in fibers from 6J compared with 6N mice. In mitochondria isolated from liver, absolute rates of H2O2 emission energized with succinate were higher in 6J versus 6N mice (Fig. 5E and F). Interestingly, JH2O2 emission in the presence of pyruvate plus carnitine was undetectable in liver mitochondria (data not shown). In contrast with skeletal muscle, 1 week of HFD increased succinate-supported H2O2 emission/production in 6J liver mitochondria relative to LFD-fed 6J controls (Fig. 5E and F).
Figure 5.
JH2O2 emitting potential in response to a 1-week HFD in 6N and 6J mice. Permeabilized fibers were prepared from WG (A and B) and RG muscle (C and D) of 6N and 6J mice fed a low-fat control diet or HFD for 1 week. JH2O2 emission was assessed in the presence of pyruvate (Pyr; 1 mmol) plus carnitine (Carn; 5 mmol) (A and C) and succinate (10 mmol) (B and D). #Difference between 6N and 6J mice within a respective diet group (P < 0.05). Isolate mitochondria were prepared from livers of 6N and 6J mice fed a low-fat control diet or HFD for 1 week. JH2O2 emission was assessed in the presence of succinate and succinate plus AF (E and F). E: Representative trace of an H2O2 emission experiment. F: Succinate and succinate/AF-supported JH2O2 emission. *Different from respective low-fat control group (P < 0.05), #difference between 6N and 6J mice (P < 0.05). Data are mean ± SEM; N = 6–8/group. Succ, succinate; wt, weight.
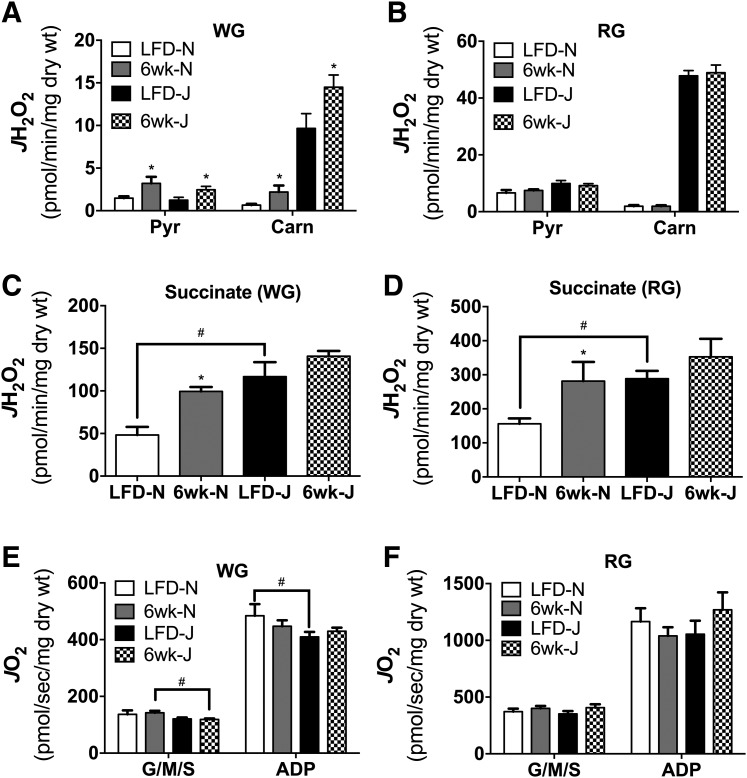
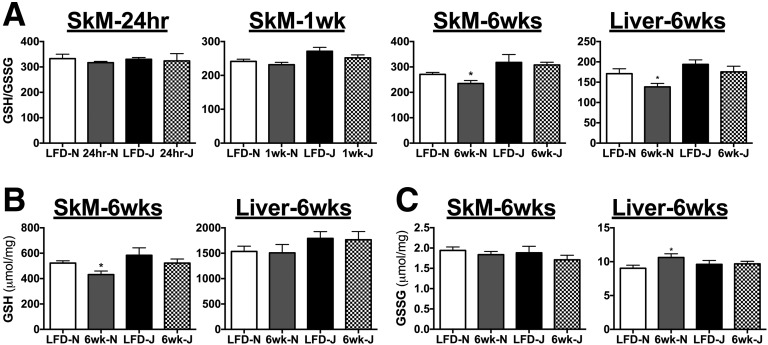
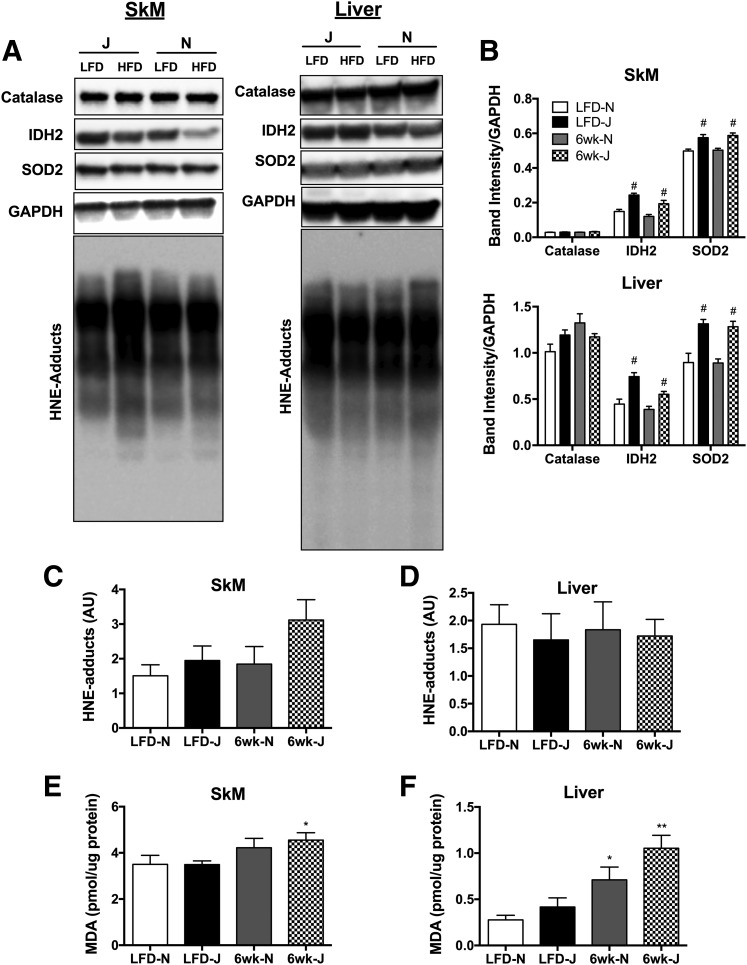
Six weeks of HFD feeding lead to significant elevations in pyruvate and pyruvate/carnitine-supported JH2O2 emission in fibers from WG but not RG in both strains (Fig. 6A and B). Again, although absolute H2O2 emission rates were higher in fibers from 6J mice, the impact of the diet on peroxide emission was similar between the two strains. By contrast, succinate-supported JH2O2 emission was higher in response to HFD only in fibers from 6N but not 6J mice (Fig. 6C and D). Maximal ADP-supported respiratory capacity was relatively unaffected by diet regardless of muscle type or strain, with the exception of modest decreases in WG state 4 respiration (Fig. 6E, G/M/S) in HFD 6J mice, and lower state 3 (Fig. 6E, ADP) respiration in LFD 6J mice. Assessment of skeletal muscle GSH/GSSG redox poise revealed no effect of strain under LFD conditions, as well as in response to a 24-h or 1-week HFD (Fig. 7A). After 6 weeks of HFD, GSH/GSSG was significantly reduced in both skeletal muscle and liver of 6N mice; however, this effect was absent in 6J mice. Interestingly, the reduction in GSH/GSSG in muscle appeared to be driven by a loss of reduced GSH, whereas in liver, the effect was due to an increase in oxidized GSSG (Fig. 7B and C). To determine if potential upregulations in other antioxidant defense systems were responsible for the lack of impact of HFD on redox poise in the 6J mice, protein expression of IDH2, SOD2, and catalase was measured in skeletal muscle and liver. Both IDH2 and SOD2 were higher in 6J mice in both skeletal muscle and liver, regardless of diet, compared with 6N mice (Fig. 8A and B). Catalase levels were similar for all groups (Fig. 8A and B). To test if changes in redox homeostasis were sufficient to drive oxidative damage, lipid peroxidation was probed in skeletal muscle and liver of mice fed an HFD for 6-week via HNE–protein adduct formation and MDA. No differences in HNE adducts were apparent across the groups (Fig. 8A, C, and D); however, HFD increased MDA levels in skeletal muscle of 6-week HFD 6J mice (Fig. 8E), as well as in livers of 6-week HFD 6N and 6J mice, relative to LFD controls (Fig. 8F).
Figure 6.
Six-week HFD alters skeletal muscle mitochondrial JH2O2 emitting potential. Permeabilized fibers were prepared from WG (A, C, and E) and RG (B, D, and F) of 6N and 6J mice fed a low-fat control diet or HFD for 6 weeks. JH2O2 emission was assessed in the presence of pyruvate (Pyr; 1 mmol) and pyruvate (1 mmol) plus carnitine (Carn; 5 mmol) (A and B) and succinate (10 mmol) (C and D). JO2 was assessed in permeabilized fibers prepared from WG (E) and RG (F) of 6N and 6J mice fed a low-fat control diet or HFD for 6 weeks. Substrate conditions were glutamate (10 mmol), malate (2 mmol), and succinate (10 mmol) in the absence (G/M/S) and presence (ADP) of ADP (2 mmol). *Different from respective low-fat control group (P < 0.05). #Difference between 6N and 6J mice within a respective diet group (P < 0.05). Data are mean ± SEM; N = 8–10/group. wt, weight.
Figure 7.
HFD feeding alters redox poise in skeletal muscle (SkM) and liver of 6N mice. A: The ratio of GSH to GSSH was assessed in tibialis anterior muscle and livers of 6N and 6J mice fed an HFD or low-fat control diet for 24 h, 1 week, or 6 weeks. Absolute GSH (B) and GSSG (C) levels that were used to generate the GSH/GSSG ratios in A. *Different from respective low-fat control group (P < 0.05). Data are mean ± SEM; N = 6–10/group.
Figure 8.
Markers of lipid peroxidation in skeletal muscle and liver lysates from 6J and 6N mice fed an HFD for 6 weeks. A: Skeletal muscle (SkM) and liver lysates were probed for catalase, IDH2, SOD2, GAPDH, and HNE. B: Quantitation of catalase, IDH2, and SOD2 blots from SkM and liver normalized to GAPDH. Quantitation of HNE blots from SkM (C) and liver (D). MDA levels in SkM (E) and liver (F). Different from respective low-fat control group: *P < 0.05, **P < 0.001; difference between 6N and 6J mice within a respective diet group: #P < 0.05. Data are mean ± SEM; N = 6/group.
Discussion
In aggregate, the present findings indicate that both 6J and 6N mice are highly susceptible to diet-induced glucose intolerance and metabolic disease. Although it was anticipated that the absence of NNT would exacerbate disease progression in the 6J line, no evidence was found for this across multiple phenotypic indices of metabolic disease. 6J mice were less glucose tolerant than 6N mice initially and at all time points during the HFD, but the impairments in glucose tolerance and skeletal muscle/liver insulin action in response to the HFD were similar in both strains. However, a variety of other metabolic/redox indices (e.g., blood insulin, whole-body oxygen consumption, adiposity, and tissue redox status) were differentially altered in 6J versus 6N mice. The most striking of these variables was that of HFD-mediated elevations in blood insulin, as 6J mice were completely resistant to diet-induced increases in glucose-stimulated insulin secretion and partially protected from diet-induced fasting hyperinsulinemia. With respect to redox status, skeletal muscle mitochondrial H2O2 emitting potential was initially higher in 6J mice, but did not increase further in response to HFD, whereas in 6N mice, mitochondrial H2O2 emitting potential doubled in response to HFD. In contrast, liver mitochondrial H2O2 emitting potential was increased in 6J mice following a 1-week HFD. Although evidence of increased peroxide exposure was apparent for both 6J and 6N mice at some point over the course of the HFD, contrary to the initial hypothesis, the impact of the diet on redox homeostasis was far more pronounced in the 6N line. Although surprising, these findings likely reflect compensatory upregulation of other antioxidant defense systems in the 6J line such as SOD2 and IDH2. Collectively, NNT status appears unrelated to the previously reported propensity of the C57BL/6 strain to develop diet-induced metabolic disease, as both 6J and 6N substrains present with multiple characteristics of the metabolic syndrome when fed an HFD. Given this similarity in disease susceptibility, coupled with the fact that humans express functional NNT, the 6N strain appears to be the more logical genetic background of choice for metabolic studies.
The present findings are in agreement with a recent time-course study using 6J mice in which skeletal muscle insulin resistance was not observed until 3 weeks into an HFD intervention, despite evidence of glucose intolerance as soon as 3 days (26). In this study, the authors linked the early onset of glucose intolerance to defects in both liver and/or white adipose tissue insulin action (26). The current findings clearly demonstrate that both 6J and 6N mice are highly susceptible to diet-induced glucose intolerance, as both lines display symptoms of impaired glucose clearance in as little as 1–3 days into an HFD regimen. The early (1–3 days) onset of glucose intolerance occurs independent of changes in skeletal muscle insulin action, as longer dietary interventions (≥1 week) are required to induce skeletal muscle insulin resistance in these strains.
In the current study, diet-induced increases in adiposity were found to be lower in the 6J line following 6 weeks of high-fat feeding. Both 6J and 6N mice were purchased from The Jackson Laboratory as “pool-weaned” groups of 20 mice/strain. Upon arrival, the mice were initially group housed (five mice per cage), but due to extensive fighting, particularly in the 6N line, the mice had to be individually housed ∼2 weeks into the HFD until the conclusion of the study. Interestingly, the observed increase in aggression within the 6N line is consistent with previous behavioral studies that detail greater anxiety in the 6N compared with 6J substrain (8,27). Although the possibility exists that the stress of individualized housing exerted differential effects on each line, all of the mice continued to gain weight throughout the 6-week diet intervention. In the only other two studies to directly compare 6J and 6N mice on an HFD, Nicholson et al. (10) found that 6J mice had a greater rate of weight gain than 6N mice on an HFD, whereas Rendina-Ruedy et al. (11) observed the opposite. In the former study, mice were group housed (10 mice/cage), the diet intervention was much longer in duration (i.e., 14 weeks), and the diet used was higher in fat content (i.e., 60%) (10), all factors that could account for the differences between studies.
Disparity in the development of hyperinsulinemia over the course of the HFD could also have contributed to the differences in adiposity observed between strains. Postprandial hyperinsulinemia precedes fasting hyperinsulinemia in humans and serves as a hallmark signature of the metabolic syndrome (28). In addition to promoting glucose uptake, insulin exerts control over whole-body metabolic balance by regulating satiety/feeding behavior at the level of the hypothalamus (29), as well as by influencing adipose tissue lipogenesis/lipolysis. Consistent with this, insulin resistance within the hypothalamus has been shown to contribute to diet-induced obesity in rodents by promoting a hyperphagic phenotype (30). Moreover, elevations in blood insulin promote chronic inhibition of adipose tissue lipolysis and adipose tissue expansion (31) in mice. Thus, it is reasonable to suspect that the insulin secretion defect in the 6J strain (25) influences brain/adipose tissue responses that contribute to the regulation of adiposity, depending on the metabolic state of the animal.
Elevations in peroxide exposure and consequent alterations in cellular redox poise have been causally linked to the development of insulin resistance, particularly as it relates to that induced by excess nutrients (14–16). In line with this, several human studies have reported increases in mitochondrial H2O2 emitting potential coupled with oxidative shifts in skeletal muscle redox homeostasis in insulin-resistant obese subjects relative to lean controls (14,32–34). To date, much of the literature has focused on the potential consequence of elevated peroxide production in terms of contributing to human disease. However, given the organization/structural characteristics of redox signaling networks (35,36), protein redox status may be primarily dictated by the supply of reducing power (i.e., NADPH) rather than H2O2 production per se (18,37). That is, oxidative shifts within the cysteine proteome in the context of a redox-mediated signaling event could just as easily be propagated via a reduction in NADPH supply as by an increase in H2O2 production. In the current study, it was hypothesized that loss of NNT-mediated reducing power in 6J mice would exacerbate potential derangements in skeletal muscle redox status and accelerate metabolic disease progression. Similar to previous findings (18), the H2O2 emitting potential was indeed much greater in mitochondria from skeletal muscle and liver of LFD 6J mice, but this did not translate into a greater rate of decline in glucose tolerance after 1 week of HFD, nor did it accentuate glucose intolerance after 6 weeks of an HFD relative to 6N mice. These data suggest that perhaps NNT does not contribute to the defense of redox homeostasis under conditions of nutrient overload or that alternative NADPH generating reactions compensate for the lack of NNT in 6J mice. Because 6J mice are a model of whole-body, germline NNT deficiency, future research directed at dissecting the role of NNT in contributing to metabolic disease will likely require tissue-specific, inducible models of NNT loss.
Given the large disparity in the development of hyperinsulinemia between 6N and 6J mice over the course of the diet intervention, another possibility is that changes in skeletal muscle redox status were confounded by differences in circulating insulin levels. In line with this notion, hyperinsulinemia in insulin-resistant human subjects has recently been shown to promote hyperphosphorylation of forkhead box O (FOXO) transcription factor, as well as downregulation of various FOXO-dependent genes within skeletal muscle (38). FOXO regulates a host of stress-resistant genes, including several involved in peroxide buffering (e.g., peroxiredoxin 3 and Mn-superoxide dismutase) (38). Consistent with this notion, both SOD2 and IDH2 were upregulated in 6J relative to 6N mice regardless of diet.
In conclusion, impairments in glycemia manifest after 1-day exposure to HFD feeding in both 6J and 6N mice. Although both strains possess similar susceptibilities to the development of glucose intolerance in the context of HFD, several diet-induced phenotypic indices of the metabolic syndrome were differentially impacted by HFD. Hyperinsulinemia was the most notable of these markers, as 6J mice appear relatively resistant to elevations in blood insulin over the course of a short-term HFD. These findings highlight the overt differences between 6N and 6J mice, which are often mistakenly referred to interchangeably as “C57BL/6” mice (12). Future metabolic studies incorporating the 6J line, specifically those involving genetic manipulations, should consider the interplay of the gene of interest in the context of background strain, particularly as it relates to NNT loss of function.
Article Information
Funding. This work was supported by National Institutes of Health grants 1F32-AR-061946 (to L.A.A.G.) and 1-R01-096907 (to P.D.N.).
Duality of Interest. No potential conflicts of interest relevant to this article were reported.
Author Contributions. K.H.F.-W. researched data, contributed to discussion, and wrote and edited the manuscript. T.E.R., C.D.S., L.A.A.G, C.-T.L., L.R.R., and M.J.T. researched data and edited the manuscript. P.D.N. contributed to discussion and wrote and edited the manuscript. P.D.N. is the guarantor of this work and, as such, had full access to all the data in the study and takes responsibility for the integrity of the data and the accuracy of the data analysis.
References
- 1.Kaku K, Fiedorek FT Jr, Province M, Permutt MA. Genetic analysis of glucose tolerance in inbred mouse strains. Evidence for polygenic control. Diabetes 1988;37:707–713 [DOI] [PubMed] [Google Scholar]
- 2.Surwit RS, Kuhn CM, Cochrane C, McCubbin JA, Feinglos MN. Diet-induced type II diabetes in C57BL/6J mice. Diabetes 1988;37:1163–1167 [DOI] [PubMed] [Google Scholar]
- 3.Surwit RS, Seldin MF, Kuhn CM, Cochrane C, Feinglos MN. Control of expression of insulin resistance and hyperglycemia by different genetic factors in diabetic C57BL/6J mice. Diabetes 1991;40:82–87 [DOI] [PubMed] [Google Scholar]
- 4.Toye AA, Lippiat JD, Proks P, et al. A genetic and physiological study of impaired glucose homeostasis control in C57BL/6J mice. Diabetologia 2005;48:675–686 [DOI] [PubMed] [Google Scholar]
- 5.Freeman HC, Hugill A, Dear NT, Ashcroft FM, Cox RD. Deletion of nicotinamide nucleotide transhydrogenase: a new quantitive trait locus accounting for glucose intolerance in C57BL/6J mice. Diabetes 2006;55:2153–2156 [DOI] [PubMed] [Google Scholar]
- 6.Huang TT, Naeemuddin M, Elchuri S, et al. Genetic modifiers of the phenotype of mice deficient in mitochondrial superoxide dismutase. Hum Mol Genet 2006;15:1187–1194 [DOI] [PubMed] [Google Scholar]
- 7.Rydström J. Mitochondrial transhydrogenase--a key enzyme in insulin secretion and, potentially, diabetes. Trends Biochem Sci 2006;31:355–358 [DOI] [PubMed] [Google Scholar]
- 8.Simon MM, Greenaway S, White JK, et al. A comparative phenotypic and genomic analysis of C57BL/6J and C57BL/6N mouse strains. Genome Biol 2013;14:R82. [DOI] [PMC free article] [PubMed] [Google Scholar]
- 9.Montgomery MK, Hallahan NL, Brown SH, et al. Mouse strain-dependent variation in obesity and glucose homeostasis in response to high-fat feeding. Diabetologia 2013;56:1129–1139 [DOI] [PubMed] [Google Scholar]
- 10.Nicholson A, Reifsnyder PC, Malcolm RD, et al. Diet-induced obesity in two C57BL/6 substrains with intact or mutant nicotinamide nucleotide transhydrogenase (Nnt) gene. Obesity (Silver Spring) 2010;18:1902–1905 [DOI] [PMC free article] [PubMed] [Google Scholar]
- 11.Rendina-Ruedy E, Hembree KD, Sasaki A, et al. A comparative study of the metabolic and skeletal response of C57BL/6J and C57BL/6N mice in a diet-induced model of type 2 diabetes. J Nutr Metab 2015;2015:758080. [DOI] [PMC free article] [PubMed] [Google Scholar]
- 12.Fontaine DA, Davis DB. Attention to background strain is essential for metabolic research: C57BL/6 and the International Knockout Mouse Consortium. Diabetes 2016;65:25–33 [DOI] [PMC free article] [PubMed] [Google Scholar]
- 13.Bourdi M, Davies JS, Pohl LR. Mispairing C57BL/6 substrains of genetically engineered mice and wild-type controls can lead to confounding results as it did in studies of JNK2 in acetaminophen and concanavalin A liver injury. Chem Res Toxicol 2011;24:794–796 [DOI] [PMC free article] [PubMed] [Google Scholar]
- 14.Anderson EJ, Lustig ME, Boyle KE, et al. Mitochondrial H2O2 emission and cellular redox state link excess fat intake to insulin resistance in both rodents and humans. J Clin Invest 2009;119:573–581 [DOI] [PMC free article] [PubMed] [Google Scholar]
- 15.Houstis N, Rosen ED, Lander ES. Reactive oxygen species have a causal role in multiple forms of insulin resistance. Nature 2006;440:944–948 [DOI] [PubMed] [Google Scholar]
- 16.Hoehn KL, Salmon AB, Hohnen-Behrens C, et al. Insulin resistance is a cellular antioxidant defense mechanism. Proc Natl Acad Sci USA 2009;106:17787–17792 [DOI] [PMC free article] [PubMed] [Google Scholar]
- 17.Ronchi JA, Figueira TR, Ravagnani FG, Oliveira HC, Vercesi AE, Castilho RF. A spontaneous mutation in the nicotinamide nucleotide transhydrogenase gene of C57BL/6J mice results in mitochondrial redox abnormalities. Free Radic Biol Med 2013;63:446–456 [DOI] [PubMed] [Google Scholar]
- 18.Fisher-Wellman KH, Lin CT, Ryan TE, et al. Pyruvate dehydrogenase complex and nicotinamide nucleotide transhydrogenase constitute an energy-consuming redox circuit. Biochem J 2015;467:271–280 [DOI] [PMC free article] [PubMed] [Google Scholar]
- 19.Perry CG, Kane DA, Lin CT, et al. Inhibiting myosin-ATPase reveals a dynamic range of mitochondrial respiratory control in skeletal muscle. Biochem J 2011;437:215–222 [DOI] [PMC free article] [PubMed] [Google Scholar]
- 20.Kand’ár R, Záková P, Lotková H, Kucera O, Cervinková Z. Determination of reduced and oxidized glutathione in biological samples using liquid chromatography with fluorimetric detection. J Pharm Biomed Anal 2007;43:1382–1387 [DOI] [PubMed] [Google Scholar]
- 21.Giustarini D, Dalle-Donne I, Milzani A, Fanti P, Rossi R. Analysis of GSH and GSSG after derivatization with N-ethylmaleimide. Nat Protoc 2013;8:1660–1669 [DOI] [PubMed] [Google Scholar]
- 22.Ferdaoussi M, Dai X, Jensen MV, et al. Isocitrate-to-SENP1 signaling amplifies insulin secretion and rescues dysfunctional β cells. J Clin Invest 2015;125:3847–3860 [DOI] [PMC free article] [PubMed] [Google Scholar]
- 23.Fisher-Wellman KH, Gilliam LA, Lin CT, Cathey BL, Lark DS, Neufer PD. Mitochondrial glutathione depletion reveals a novel role for the pyruvate dehydrogenase complex as a key H2O2-emitting source under conditions of nutrient overload. Free Radic Biol Med 2013;65:1201–1208 [DOI] [PMC free article] [PubMed] [Google Scholar]
- 24.Freeman H, Shimomura K, Horner E, Cox RD, Ashcroft FM. Nicotinamide nucleotide transhydrogenase: a key role in insulin secretion. Cell Metab 2006;3:35–45 [DOI] [PubMed] [Google Scholar]
- 25.Fergusson G, Ethier M, Guévremont M, et al. Defective insulin secretory response to intravenous glucose in C57Bl/6J compared to C57Bl/6N mice. Mol Metab 2014;3:848–854 [DOI] [PMC free article] [PubMed] [Google Scholar]
- 26.Turner N, Kowalski GM, Leslie SJ, et al. Distinct patterns of tissue-specific lipid accumulation during the induction of insulin resistance in mice by high-fat feeding. Diabetologia 2013;56:1638–1648 [DOI] [PubMed] [Google Scholar]
- 27.Bryant CD, Zhang NN, Sokoloff G, et al. Behavioral differences among C57BL/6 substrains: implications for transgenic and knockout studies. J Neurogenet 2008;22:315–331 [DOI] [PMC free article] [PubMed] [Google Scholar]
- 28.Bock G, Dalla Man C, Campioni M, et al. Pathogenesis of pre-diabetes: mechanisms of fasting and postprandial hyperglycemia in people with impaired fasting glucose and/or impaired glucose tolerance. Diabetes 2006;55:3536–3549 [DOI] [PubMed] [Google Scholar]
- 29.Morton GJ, Cummings DE, Baskin DG, Barsh GS, Schwartz MW. Central nervous system control of food intake and body weight. Nature 2006;443:289–295 [DOI] [PubMed] [Google Scholar]
- 30.De Souza CT, Araujo EP, Bordin S, et al. Consumption of a fat-rich diet activates a proinflammatory response and induces insulin resistance in the hypothalamus. Endocrinology 2005;146:4192–4199 [DOI] [PubMed] [Google Scholar]
- 31.Tan SX, Fisher-Wellman KH, Fazakerley DJ, et al. Selective insulin resistance in adipocytes. J Biol Chem 2015;290:11337–11348 [DOI] [PMC free article] [PubMed] [Google Scholar]
- 32.Fisher-Wellman KH, Weber TM, Cathey BL, et al. Mitochondrial respiratory capacity and content are normal in young insulin-resistant obese humans. Diabetes 2014;63:132–141 [DOI] [PMC free article] [PubMed] [Google Scholar]
- 33.Konopka AR, Asante A, Lanza IR, et al. Defects in mitochondrial efficiency and H2O2 emissions in obese women are restored to a lean phenotype with aerobic exercise training. Diabetes 2015;64:2104–2115 [DOI] [PMC free article] [PubMed] [Google Scholar]
- 34.Lefort N, Glancy B, Bowen B, et al. Increased reactive oxygen species production and lower abundance of complex I subunits and carnitine palmitoyltransferase 1B protein despite normal mitochondrial respiration in insulin-resistant human skeletal muscle. Diabetes 2010;59:2444–2452 [DOI] [PMC free article] [PubMed] [Google Scholar]
- 35.Go YM, Duong DM, Peng J, Jones DP. Protein Cysteines Map to Functional Networks According to Steady-state Level of Oxidation. J Proteomics Bioinform 2011;4:196–209 [DOI] [PMC free article] [PubMed] [Google Scholar]
- 36.Go YM, Roede JR, Walker DI, et al. Selective targeting of the cysteine proteome by thioredoxin and glutathione redox systems. Mol Cell Proteomics 2013;12:3285–3296 [DOI] [PMC free article] [PubMed] [Google Scholar]
- 37.Fisher-Wellman KH, Neufer PD. Linking mitochondrial bioenergetics to insulin resistance via redox biology. Trends Endocrinol Metab 2012;23:142–153 [DOI] [PMC free article] [PubMed] [Google Scholar]
- 38.Tonks KT, Ng Y, Miller S, et al. Impaired Akt phosphorylation in insulin-resistant human muscle is accompanied by selective and heterogeneous downstream defects. Diabetologia 2013;56:875–885 [DOI] [PubMed] [Google Scholar]


