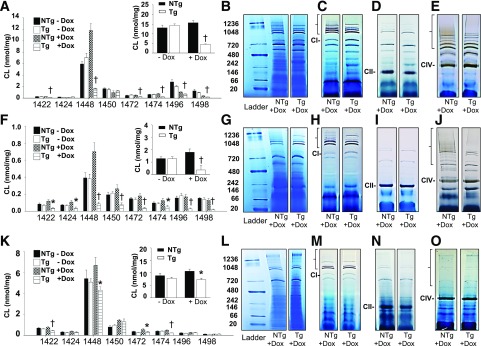
Figure 4.
The quantitation of individual cardiolipin species and determination of mitochondrial supercomplex formation in various mouse tissues. Molecular species of CL were determined by mass spectrometry–mass spectrometry and arranged by mass for heart (A), skeletal muscle (F), and liver (K) of 4-month-old animals. Total CL content is shown in the inset for each tissue. Values are means ± SEMs (n = 5–9). Supercomplexes were separated by Blue Native PAGE for heart (B), skeletal muscle (G), and liver (L) before conducing in-gel activity assays for mitochondrial complexes I (C, H, and M), II, (D, I, and N), and IV (E, J, and O) (heart, skeletal muscle, and liver, respectively). The location of each individual complex is indicated as CI, CII, or CIV, respectively. The supercomplexes that contain the complex of interest (i.e., the active complex) are indicated with brackets at the top of each gel. The ladder size is indicated in kilodaltons on the left, and each lane is representative of 3–6 animals per group. *P < 0.05 compared with NTg age-matched mice fed an identical diet; †P < 0.05, Tg + dox compared with all other groups.

