

Abstract
Purpose
To evaluate the validity of the Patient-Reported Outcomes Measurement Information System (PROMIS) Physical Function measures in a diverse, population-based cancer sample.
Methods
Cancer patients 6–13 months post diagnosis (n=4,840) were recruited for the Measuring Your Health (MY-Health) study. Participants were diagnosed between 2010–2013 with non-Hodgkin lymphoma or cancers of the colorectum, lung, breast, uterus, cervix, or prostate. Four PROMIS Physical Function short forms (4a, 6b, 10a, and 16) were evaluated for validity and reliability across age and race-ethnicity groups. Covariates included gender, marital status, education level, cancer site and stage, comorbidities, and functional status.
Results
PROMIS Physical Function short forms showed high internal consistency (Cronbach’s α =0.92 – 0.96), convergent validity (Fatigue, Pain Interference, FACT Physical Well-Being all r≥0.68) and discriminant validity (unrelated domains all r≤0.3) across survey short forms, age, and race-ethnicity. Known group differences by demographic, clinical, and functional characteristics performed as hypothesized. Ceiling effects for higher-functioning individuals were identified on most forms.
Conclusions
This study provides strong evidence that PROMIS Physical Function measures are valid and reliable in multiple race-ethnicity and age groups. Researchers selecting specific PROMIS short forms should consider the degree of functional disability in their patient population to ensure that length and content are tailored to limit response burden.
Keywords: Patient-Reported Outcomes, Oncology, Validation Studies, Physical Function
Introduction
Over half of cancer survivors are likely to experience significant physical limitations [1]. Decline in physical function is often associated with a cancer diagnosis and the ensuing initial treatment [2; 3], and such decline can have long-lasting effects extending past treatment and is associated with lower quality of life and increased risk of mortality [4].
Physical Function is a key patient-reported outcome (PRO) used to characterize and better understand overall health, level of physical disability and general well-being. Physical function is a foundation for many commonly-used general and cancer-specific (e.g., SF-36 and FACT-G, respectively) PRO measures [5; 6] and the Patient-Reported Outcomes Measurement Information System® (PROMIS®) [7–9]. These measures provide a systematic report of functional well-being, similar to physician-rated performance status measures that are known to have low inter-rater reliability [10]. Physical function PROs offer a comprehensive assessment of body function, impact of disability on physical participation, activity level, and environmental and personal characteristics [11; 12] and incorporate the patient perspective.
PROMIS, a U.S. National Institutes of Health Common Fund initiative, has developed an extensive item response theory (IRT)-calibrated item bank, a collection of self-administered questions, and multiple short form questionnaires available to measure physical function. This physical function domain was developed to measure a full range of function on one common standardized scale, minimizing ceiling and floor effects where the score is higher or lower than the survey can identify [12; 13], and has demonstrated conceptual validity and reliability [8; 14]. Initial validation of this domain in rheumatoid arthritis and osteoarthritis populations and normal aging cohorts showed that PROMIS physical function measures outperformed legacy instruments (i.e., the Health Assessment Questionnaire [HAQ]) [15]. Subsequent work validated this PROMIS physical function item bank in a more diverse general population sample [16]. The item banks were designed to allow customized short forms of variable length and item content to be created, yet yield comparable, standardized scores across the short forms [17]. However, the comparability of PROMIS Physical Function short forms in a community-based sample encompassing a broad range of age, disability level, and race-ethnicity has not been extensively tested.
Our study objectives were to evaluate (1) the applicability of the PROMIS physical function measures for a diverse sample of cancer patients, and (2) the psychometric performance of commonly-used PROMIS physical function short forms.
Methods
Recruitment
The Measuring Your Health (MY-Health) study recruited a population-based sample of cancer patients from four Surveillance, Epidemiology, and End Results (SEER) Program cancer registries (The Greater Bay Area Cancer Registry covering the San Francisco Bay and surrounding area, the Cancer Registry of Greater California covering the rest of the state except Los Angeles County, the Louisiana Tumor Registry, and the New Jersey State Cancer Registry). We stratified sampling by 4 race-ethnicity groups (Non-Hispanic White [NHW], Hispanic, Non-Hispanic Black [Black], Non-Hispanic Asian [Asian]) and 3 age groups (21–49, 50–64, 65–84), based on base incidence rates at each registry. The study was approved by Institutional Review Boards at all participating institutions.
Population
Participants in this cohort were identified based on the following SEER eligibility criteria: 21–84 years of age at diagnosis; diagnosed with one of seven cancers (prostate, colorectal, non-small cell lung, Non-Hodgkin lymphoma, female breast, uterine or cervical); no prior cancer diagnosis (except non-melanoma skin cancer); currently within 6–13 months of diagnosis and able to read English, Spanish, or Mandarin. Patients without cancer stage information, age, or race-ethnicity information were excluded from this analysis (N=662, figure 1) to ensure all known groups comparisons were done across a single uniform cohort.
Fig. 1.
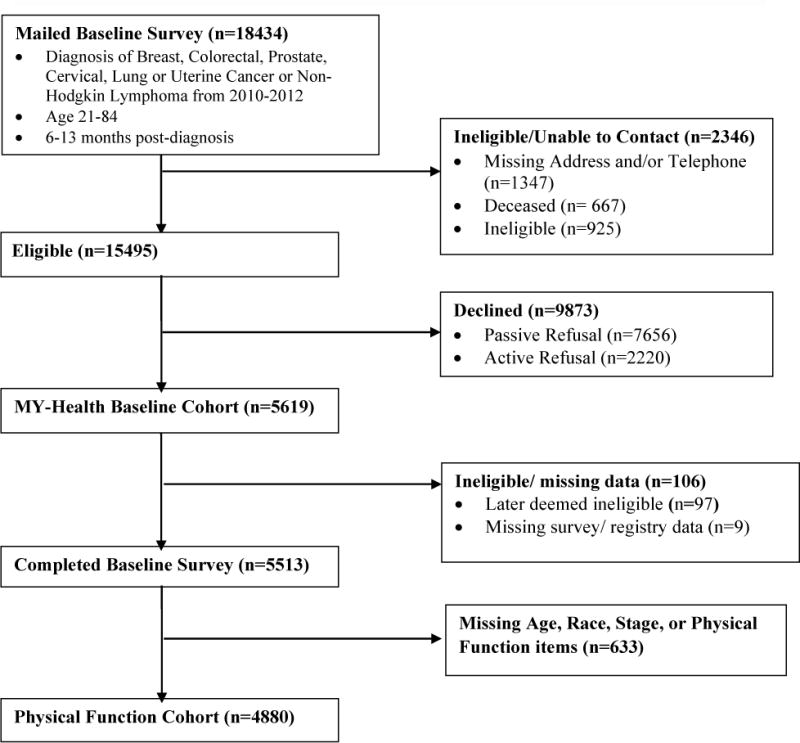
MY-Health Cohort Flow Chart
MY-Health Survey
Survey items included self-reported sociodemographic characteristics, receipt of recent treatments, comorbidities, patient-reported outcomes and selected health behaviors. Pilot testing was conducted in 35 respondents to identify and correct any errors or unclear language and skip patterns in the survey. The SEER registry sites mailed a survey to eligible participants, with an additional Spanish and Mandarin Chinese translations sent to persons based on surname or made available upon request. Cover letters in the same language as the survey were sent explaining the reason for the study and requesting participation. Along with a second mailing, phone follow-up was initiated for all non-responders after 3 weeks to encourage return of the survey. When contacted, participants were given the option to complete the survey over the phone in English, Spanish, or Mandarin Chinese. All Spanish and Mandarin translations of PROMIS items followed a strict translation protocol [18] and were done in coordination with the PROMIS Statistical Center at Northwestern University. Participants received a $30 gift card or check after completing the survey.
Demographic and Clinical Variables
We merged the patient survey data with SEER registry variables. SEER registry variables include: age, sex, date of cancer diagnosis, cancer type, and cancer stage. In addition we included the following self-reported survey variables: receipt of chemotherapy, radiation therapy, or hormonal therapy; surgery, comorbid conditions (number and type); education level; current employment status; annual income; marital status; insurance coverage; and whether the patient was born in the U.S. We used the following self-reported race-ethnicity categories (NHW, Black, Hispanic, Asian), created following U.S. Census (2010) classification algorithms [19]. When self-reported race-ethnicity was missing (<0.4% of patients) SEER registry information was used.
Patient-Reported Outcomes
We evaluated three established PROMIS Physical Function (PF) short form measures (PF 4a, PF 6b, PF 10a, and custom 16-item form). PROMIS PF short forms are fixed assessments, administered either on paper or electronically. Two forms evaluated here (PF 4a, PF 6b) are the physical function sub-scale of the PROMIS Adult Profile 29 v2 and PROMIS Adult Profile 43 v2, respectively [20]. We selected items for inclusion in the MY-Health survey instrument based on either their inclusion in commonly used short forms, or their frequent selection in the online PROMIS Computer Adaptive Testing (CAT) format. We examined CAT item selection for two different patient groups (0.5 and 1.0 SD below the population mean). Convergent and discriminant validity (types of construct validity) were evaluated with respect to the following variables (each showing high internal consistency α in this cohort) [21]: Ability to Participate in Social Roles and Activities v1 (10 items, α=0.98); Emotional Distress – Anxiety (11 items, α=0.97); Emotional Distress—Depression (10 items, α=0.97); Fatigue (14 items, α=0.96); and Pain Interference (11 items, α=0.98). PROMIS measures are reported as T-scores (0–100 scale) with a mean of 50 and SD of 10. All PROMIS measures except Ability to Participate in Social Roles and Activities are normalized to the general US population [7]. High scores for Physical Function and Social Roles and Activity represent better functioning and high scores for the symptoms represent greater symptom burden. To address convergent and discriminant validity, we also administered the 7-item FACT Physical Well-Being (PWB) subscale (α=0.84) [5]. Spirituality, comprised of two sub-domains (faith and peace) measured by the FACIT-SP-12 v4 (α=0.85) [22]; a 5-item financial burden subscale from the PSQ-III (α=0.83) [23]; an 8-item acculturation scale for U.S. immigrants (α=0.94) [24]; To address known groups validity, questions on the use of assistive devices, a single-item Patient Self-Report ECOG Performance Status Scale used in cancer clinical trials to assess disease impact on daily living abilities [25], comorbid medical conditions (asthma, COPD, arthritis, and overall number), physical activity, stage of disease, cancer site, and demographic variables were included. Hypotheses are described below.
Reliability and Validity Testing
We used standard psychometric procedures to evaluate reliability and validity [26] of each PROMIS PF short form across 3 age (21–49, 50–64, 65–84) and 4 race-ethnicity (NHW, Black, Hispanic, Asian) groups. We evaluated overall and item-level performance. We estimated internal consistency using Cronbach’s Coefficient alpha, with α > 0.70 and α > 0.90 the thresholds for reliable group and individual level (inter-individual comparisons at a single time point) measurement, respectively. For structural validity, we evaluated unidimensionality of the PROMIS PF short forms using factor analysis methods, with a mean- and variance-adjusted weighted least square (WLSMV) estimator. Goodness of model fit indicators and thresholds included: comparative fit index (CFI), and the Tucker-Lewis Index (TLI). We tested multiple types of construct validity across age and race-ethnicity groups. We examined convergent and discriminant construct validity by calculating Pearson correlations between Physical Function and other administered scales. The PROMIS PF short forms were expected to be positively correlated with social role participation and another measure of physical function (the FACT - Physical Wellbeing subscale) and negatively correlated with symptom severity (e.g., more fatigue or pain) and weakly correlated other non-physical function measures (e.g., FACIT Spirituality, Financial Burden, and Acculturation). We used chi-square tests to evaluate known-group validity of expected a priori differences in physical function (all forms), for the total sample. Specific variables, hypotheses and supporting citations are described in table 5, any minimally important differences between race-ethnicity or age groups (PROMIS physical function T-score ≥4, a meaningful important score difference [27], are also identified). Factor analysis was conducted using Mplus (version 7.1, Los Angeles, CA); all other analyses were conducted using SAS (v. 9.3, SAS Institute, Cary, NC).
Table 5.
Known Groups Validity, Score Differences in Physical Function (PF 16 short form)
| Known Groups Comparisons | Hypothesized Lower Physical Function | Group 1: Mean (SD) | Group 2: Mean (SD) | Mean Group Difference* | Large sub-group differences** (±4 or more points vs. ref. group) | Citations |
|---|---|---|---|---|---|---|
| Demographic | ||||||
| Sex: Women vs. Men | Women | 43.8 (9.7) | 46.6 (10.1) | −2.88 | [35] | |
| Age: Old (65–84) vs. Young (21–49) | Older | 43.7 (9.9) | 46.4 (9.6) | −2.70 | [36] | |
| Education: Low (<HS) vs. High (College) | Lower Education | 41.0 (10.0) | 48.6 (8.9) | −7.60 | [37] | |
| Clinical | ||||||
| Site: Lung vs. Prostate | Lung Cancer | 39.1 (8.5) | 49.6 (9.5) | −10.6 | 21–50 years (−6.7) Asian (+4.3) | [38,39] |
| Stage: Advanced vs. Localized | Advanced Stage | 41.1 (9.8) | 45.5 (9.9) | −4.40 | [38,40] | |
| Treatment: Chemotherapy (Yes vs. No) | Chemotherapy | 42.2 (9.0) | 47.5 (10.1) | −5.35 | [41,42] | |
| Asthma (Yes vs. No) | History of Asthma | 41.5 (10.1) | 45.5 (9.8) | −4.00 | [43] | |
| COPD (Yes vs. No) | History of COPD | 37.9 (9.0) | 46.0 (9.7) | −8.10 | [44] | |
| Arthritis (Yes vs. No) | History of Arthritis | 41.0 (9.2) | 47.0 (9.8) | −6.00 | [45] | |
| Functional | ||||||
| Difficulty Walking (Yes vs. No) | Any Dif. Walking | 34.5 (6.3) | 48.4 (8.4) | −13.9 | [46] | |
| Number of Conditions (2+ vs. 0) | Multi-morbidity | 40.3 (9.2) | 49.1 (9.1) | −8.82 | [47] | |
| Performance Status : >50% Bed Rest vs. Normal | Bed Rest | 40.4 (7.2) | 51.4 (8.2) | −11.0 | Black (+4.2) ; Asian (+4.5) | [46] |
| Vigorous exercise: None vs. >4 Times a week | No Exercise | 42.1 (9.1) | 54.3 (8.4) | −12.2 | [48] |
All known group differences p<0.001;
Reference Groups: White (race/ethnicity), 65–84 (age)
Results
Overall, participants in the MY-Health cohort are demographically and clinically diverse, important for establishing generalizability to other cancer populations (Table 1). Non-White participants comprised 57% percent of the total cohort and 59% of participants were under 65 years of age. Eighteen percent of the cohort reported less than a high school education (Hispanics, 37%; Blacks, 22%; and Asians, 14%), 15% and 50% of the cohort reported household income levels under $60,000. Thirty percent were not born in the U.S., and 9% of surveys were completed in Spanish or Mandarin Chinese. Cancer incidence by type ranged from cervix (3%) to breast (30%); 12% of patients were diagnosed with stage IV cancer; and about half reported the receipt of chemotherapy (48%).
Table 1.
Demographics and Clinical Characteristics by Race-ethnicity
| Overall | Non-Hispanic White | Black | Hispanic | Asian | ||
|---|---|---|---|---|---|---|
|
| ||||||
| n | %* | % | % | % | % | |
|
| ||||||
|
Demographics
| ||||||
| Age at Diagnosis (years) | ||||||
| 21–49 | 1057 | 22 | 19 | 19 | 29 | 25 |
| 50–64 | 1812 | 37 | 33 | 46 | 35 | 39 |
| 65–84 | 2011 | 42 | 49 | 35 | 36 | 36 |
|
| ||||||
| Sex | ||||||
| Male | 1988 | 41 | 43 | 44 | 39 | 33 |
| Female | 2892 | 59 | 57 | 56 | 61 | 67 |
|
| ||||||
| Comorbidities (Number) | ||||||
| 0 | 1714 | 35 | 33 | 33 | 33 | 46 |
| 1 | 1246 | 26 | 25 | 25 | 25 | 28 |
| 2+ | 1920 | 39 | 42 | 42 | 42 | 26 |
|
| ||||||
| Married | 2868 | 59 | 65 | 42 | 53 | 70 |
|
| ||||||
| Education Level | ||||||
| < High School Degree | 865 | 18 | 8 | 22 | 37 | 14 |
| High School Degree | 909 | 19 | 22 | 21 | 18 | 10 |
| Some College | 1558 | 32 | 36 | 37 | 28 | 21 |
| College Degree | 887 | 18 | 20 | 11 | 9 | 33 |
| Graduate Degree | 577 | 12 | 14 | 7 | 6 | 20 |
|
| ||||||
| Income Level | ||||||
| < $10,000 | 497 | 10 | 5 | 17 | 16 | 9 |
| $10,000 to $59,999 | 1924 | 40 | 36 | 47 | 47 | 32 |
| $60,000 to $99,999 | 812 | 17 | 22 | 12 | 12 | 15 |
| $100,000 to $199,999 | 611 | 13 | 17 | 6 | 6 | 18 |
| > $200,000 | 172 | 4 | 5 | 1 | 2 | 5 |
|
| ||||||
| Current Employment | ||||||
| Working | 2121 | 43 | 45 | 37 | 44 | 100 |
| Retired | 1886 | 39 | 43 | 38 | 32 | 36 |
| Unemployed/Disabled | 813 | 17 | 12 | 23 | 22 | 16 |
|
| ||||||
| Born in U.S. | 3420 | 70 | 94 | 93 | 41 | 16 |
|
| ||||||
| Survey Language | ||||||
| English | 4450 | 91 | 100 | 100 | 68 | 85 |
| Spanish | 302 | 6 | 0 | 0 | 31 | 0 |
| Chinese | 128 | 3 | 0 | 0 | 1 | 15 |
|
| ||||||
| TOTAL | 4880 (100%) |
2079 (43%) |
1019 (21%) |
960 (19%) |
822 (17%) |
|
|
| ||||||
|
Clinical Variables
| ||||||
| Cancer Type | ||||||
| Breast | 1450 | 30 | 25 | 27 | 30 | 44 |
| Prostate | 1065 | 22 | 20 | 29 | 22 | 17 |
| Colorectal | 824 | 17 | 16 | 18 | 18 | 18 |
| Lung | 641 | 13 | 20 | 11 | 6 | 6 |
| NHL | 413 | 8 | 11 | 6 | 9 | 6 |
| Uterus | 358 | 7 | 6 | 7 | 10 | 7 |
| Cervix | 129 | 3 | 2 | 2 | 5 | 2 |
|
| ||||||
| Cancer Stage | ||||||
| I | 1851 | 38 | 39 | 33 | 38 | 39 |
| II | 1583 | 32 | 29 | 37 | 32 | 35 |
| III | 866 | 18 | 18 | 18 | 18 | 17 |
| IV | 580 | 12 | 13 | 12 | 11 | 9 |
|
| ||||||
| Initial Treatment | ||||||
| Surgery | 3354 | 69 | 69 | 64 | 66 | 76 |
| Chemotherapy | 2335 | 48 | 46 | 48 | 51 | 50 |
| Radiation | 2003 | 41 | 42 | 40 | 39 | 43 |
|
| ||||||
| Performance Status | ||||||
| No Symptoms | 2213 | 46 | 48 | 43 | 37 | 54 |
| Some Symptoms | 1782 | 37 | 37 | 38 | 40 | 32 |
| ≤ 50% Bed Rest | 581 | 12 | 12 | 12 | 16 | 8 |
| >50% Bed Rest | 214 | 4 | 3 | 5 | 7 | 4 |
|
| ||||||
| Walking Support | ||||||
| No Help | 3731 | 77 | 79 | 70 | 73 | 84 |
| Cane or Some Support | 531 | 11 | 9 | 17 | 13 | 7 |
| Walker | 123 | 3 | 2 | 4 | 3 | 1 |
| Wheelchair | 270 | 6 | 6 | 5 | 7 | 4 |
due to missing values numbers may not equal 100%
This cohort reported a mean PROMIS Physical Function score (using the PF 16-item short form score) of 44.9 (Table 2), one half standard deviation lower than the overall U.S. population mean. Mean differences in PROMIS PF short form scores and the 16-item MY-Health form ranged from 0.05 (PF 10a) to 0.80 points (PF 4a), all well-within the mean standard error of measurement (2.2 – 3.9 points). These differences remained consistent across age and race-ethnicity groups. Reliability of all PROMIS Physical Function short forms was high (α=0.92–0.96, Table 2), and remained >0 .90 when restricted to subgroups based on age and race/ethnic groups (not shown in tables). Floor effects were minimal across all forms, but ceiling effects were evident in PF 4a (34.5%) and PF 6a (25%).
Table 2.
Item-Level and Short-Form Properties
| PROMIS Item Identifier | Short Form | Floor (%) | Ceiling (%) | Mean* | SD | Item Text | ||||||
|---|---|---|---|---|---|---|---|---|---|---|---|---|
| PF 4a | PF 6b | PF 10a | PF 16 | |||||||||
| PFA1 | – | – | X | X | 25.1 | 16.2 | 2.7 | 1.4 | Does your health now limit you in doing vigorous activities, such as running, lifting heavy objects, participating in strenuous sports? | |||
| PFC36 | – | – | X | X | 18.7 | 36.8 | 3.3 | 1.5 | Does your health now limit you in walking more than a mile? | |||
| PFC37 | – | – | X | X | 6.6 | 47.5 | 3.8 | 1.3 | Does your health now limit you in climbing one flight of stairs? | |||
| PFA5 | – | – | X | X | 6.7 | 43.1 | 3.8 | 1.3 | Does your health now limit you in lifting or carrying groceries? | |||
| PFA3 | – | – | X | X | 6.6 | 37.6 | 3.6 | 1.3 | Does your health now limit you in bending, kneeling, or stooping? | |||
| PFA7 | – | – | – | X | 4.7 | 34.7 | 3.6 | 1.3 | How much do physical health problems now limit your usual physical activities (such as walking or climbing stairs)? | |||
| PFB1 | – | X | – | X | 5.5 | 44.5 | 3.8 | 1.3 | Does your health now limit you in doing moderate work around the house like vacuuming, sweeping floors or carrying in groceries? | |||
| PFC12 | – | X | – | X | 16.5 | 30.8 | 3.3 | 1.5 | Does your health now limit you in doing two hours of physical labor? | |||
| PFA11 | X | X | X | X | 11.1 | 39.4 | 3.7 | 1.4 | Are you able to do chores such as vacuuming or yard work? | |||
| PFA16 | – | – | X | X | 1.1 | 76.9 | 4.6 | 0.8 | Are you able to dress yourself, including tying shoelaces and doing buttons? | |||
| PFB26 | – | – | X | X | 1.7 | 85.6 | 4.7 | 0.8 | Are you able to shampoo your hair? | |||
| PFA55 | – | – | X | X | 0.8 | 84.2 | 4.7 | 0.7 | Are you able to wash and dry your body? | |||
| PFC45 | – | – | X | X | 0.5 | 84.1 | 4.8 | 0.7 | Are you able to get on and off the toilet? | |||
| PFA21 | X | X | – | X | 6.5 | 54.2 | 4.1 | 1.2 | Are you able to go up and down stairs at a normal pace? | |||
| PFA23 | X | X | – | X | 7.1 | 60.9 | 4.2 | 1.2 | Are you able to go for a walk of at least 15 minutes? | |||
| PFA53 | X | X | – | X | 6.3 | 59.9 | 4.2 | 1.2 | Are you able to run errands and shop? | |||
| By Short Form | By Race (PF 16) | By Age (PF 16) | ||||||||||
| PF 4a | PF 6b | PF 10a | PF 16 | White | Black | Hisp. | Asian | 21–49 | 50–64 | 65–84 | ||
| Total Floor (%) | 2.2 | 1.7 | 0.2 | 0.2 | 0.1 | 0.3 | 0.3 | 0.1 | 0.2 | 0.1 | 0.3 | |
| Total Ceiling (%) | 34.5 | 25.0 | 13.1 | 12.2 | 13.7 | 12.0 | 9.3 | 12.3 | 14.2 | 14.4 | 9.2 | |
| Mean | 45.8 | 45.3 | 44.9 | 44.9 | 45.7 | 43.6 | 43.5 | 46.4 | 46.3 | 45.5 | 43.7 | |
| SEM mean | 3.9 | 3.1 | 2.7 | 2.2 | 2.2 | 2.1 | 2.0 | 2.2 | 2.3 | 2.3 | 2.0 | |
| SD | 9.7 | 9.9 | 9.9 | 10.0 | 9.9 | 10.3 | 10.0 | 9.3 | 9.6 | 10.1 | 9.9 | |
| Cronbach’s α | 0.92 | 0.94 | 0.92 | 0.96 | 0.96 | 0.96 | 0.96 | 0.96 | 0.96 | 0.96 | 0.96 | |
Note: X indicates item included on short form.
Item scores ranged from 1–5.
All items use the following response scale: 5=Without any difficulty, 4=With a little difficulty, 3=With some difficulty, 2=With much difficulty, 1=Unable to do.
Abbreviations: PF, Physical Function; SD, standard deviation; SEM, = standard error of measurement
For structural validity, confirmatory factor analysis for a one factor model fit to all 16 items generally showed good fit (CFI and TLI = 0.99). Exploratory factor analysis identified one strong factor (Eigenvalue=12.7) and high factor loadings (>0.6) for all items. A second, highly correlated factor (r=0.83) was identified for items that ask about self-care actions (e.g., wash and dry your body, shampoo your hair) that are only found on the PF 10a (Table 3).
Table 3.
Physical Function Factor Loadings (Oblique Rotation) and Correlations
| Item | Factor
|
|
|---|---|---|
| 1 | 2 | |
|
| ||
| PFA1 | 0.85 | 0.59 |
| PFC36 | 0.89 | 0.65 |
| PFC37 | 0.89 | 0.74 |
| PFA5 | 0.91 | 0.77 |
| PFA3 | 0.86 | 0.73 |
| PFA7 | 0.92 | 0.75 |
| PFB1 | 0.94 | 0.79 |
| PFC12 | 0.90 | 0.67 |
| PFA11 | 0.93 | 0.79 |
| PFA16 | 0.79 | 0.92 |
| PFB26 | 0.79 | 0.95 |
| PFA55 | 0.81 | 0.99 |
| PFC45 | 0.78 | 0.91 |
| PFA21 | 0.89 | 0.82 |
| PFA23 | 0.90 | 0.78 |
| PFA53 | 0.91 | 0.83 |
|
| ||
| Eigenvalue | 12.57 | 1.08 |
|
| ||
| Factor Correlations | ||
| 1 | 2 | |
|
| ||
| 1 | 1 | |
| 2 | 0.83 | 1 |
For convergent and discriminant validity, physical function was correlated with other PRO domains as hypothesized (see Table 4), and consistent with previous literature. There were strong correlations (r≥0.67) with ability to participate in social roles, fatigue, pain, and functioning on the FACT-G PWB scale. The domain was moderately associated (r=−0.38 to −0.50) with depression, anxiety, and sleep disturbance scores. Physical function showed weak to moderate correlations (r≤0.26) with spirituality, financial burden, and acculturation.
Table 4.
Convergent and Discriminant Validity by Physical Function Short Form
| Score Correlations | PF [16] | PF [4a] | PF [6b] | PF [10a] | Hypothesized Association |
|---|---|---|---|---|---|
| PROMIS Domains | |||||
| Ability to Participate in Social Roles | 0.76 | 0.74 | 0.76 | 0.75 | + |
| Fatigue | −0.72 | −0.67 | −0.70 | −0.70 | + |
| Pain Interference | −0.67 | −0.64 | −.065 | −0.67 | + |
| Depression | −0.50 | −0.47 | −0.49 | −0.50 | * |
| Anxiety | −0.48 | −0.45 | −0.47 | −0.48 | * |
| Sleep Disturbance | −0.41 | −0.38 | −0.40 | −0.41 | * |
| Validated Measures | |||||
| FACT – Physical Well-Being Subscale | 0.71 | 0.70 | 0.71 | 0.70 | + |
| Spirituality | 0.26 | 0.25 | 0.26 | 0.25 | − |
| Faith | 0.03 | 0.03 | 0.04 | 0.03 | − |
| Meaning/Peace | 0.37 | 0.35 | 0.36 | 0.36 | − |
| Financial Burden | 0.20 | 0.19 | 0.19 | 0.20 | − |
| Acculturation (n=1280)** | −0.14 | −0.13 | −0.14 | −0.15 | − |
+ Strong (r≥0.70);
Moderate (0.30< r <0.70);
− Weak (r≤0.30);
Non U.S. Born Only
Known-groups testing confirmed our a priori hypothesis about differences in physical function (Table 5). Only two sub-group comparisons (cancer site, and performance status) showed age and race-ethnic differences that were 4 or more points higher or lower than the reference groups. Among cancer clinical variables, cancer patients diagnosed with advanced cancer and those who received chemotherapy both reported significantly lower physical function scores (−4.40 and −5.35 points, respectively). Of all cancer types, lung cancer patients had the lowest mean physical function scores (39.1), while men with prostate cancer reported the highest mean scores (49.6).
Self-reported comorbidities were associated with large decreases in physical function by both the number of other conditions reported and whether COPD or asthma was reported. As expected, the largest differences in physical function (13 points, p<0.001) were found if a person indicated they had any trouble walking. These findings also were consistent when physical function was evaluated by ECOG performance status, covering a large range of disability. Overall each decrease in performance status level (normal, some symptoms, <50% bed rest, >50% bed rest), was also a large, statistically significant decrease in physical function, while the scores and standard deviations were consistent across each level (Figure 2).
Fig. 2.
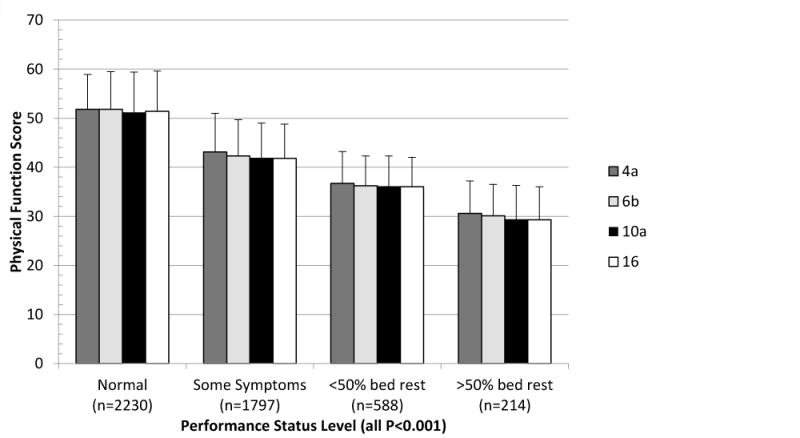
PROMIS Physical Function Short Form Mean and Standard Deviation by ECOG Performance Status
We found that scores near the floor and ceiling of this domain were similar across all short forms examined. Groups anticipated to be very low functioning near the floor of this domain (>50% bed rest) reported similar scores (<0.5 of a point) across all physical function short forms. The highest-functioning group (reported vigorous activity 5 or more times a week) had a two-point mean difference between 4-item and the full 16-item measures, still within the standard error of measurement for both forms (data not shown).
Discussion
This study demonstrated the validity and reliability of PROMIS Physical Function short forms in a socio-demographically diverse, population-based cohort of cancer patients. We found that scores across all short forms performed consistently across race-ethnic and age groups. Reliability and validity criteria were met for race-ethnic and age groups across all tested physical function forms, providing strong evidence that these measures are accurate, precise, and comparable in a diverse cohort of cancer patients.
Previous work validating the PROMIS Physical Function bank suggested that, like virtually all extant measures of self-reported physical function, there may be content gaps at the ceiling of the measure (i.e., items that can measure high levels of physical function and athleticism) [28]. We observed similar findings in this lower physical functioning cohort. Ceiling effects were identified for all physical function short forms in use, and were notably higher in the 4-item form; floor effects were minimal across all short forms. This suggests that when physical function short forms are administered in higher-functioning populations a full standard deviation above U.S. population (60) or higher, custom item selection for higher functioning individuals becomes increasingly important to ensure accurate measurement. Assessment administration method (fixed item short form vs. CAT) should also be considered in selection, as recent studies show that CAT administration of the PROMIS Physical Function item bank in both clinical and general population samples reduces this ceiling effect [29; 30] and new items have been added that directly address ceiling and floor effects [31; 32]. However, when the administration of a fixed short form is necessary, our findings suggest that increasing short form length (i.e., 6b or higher) reduces ceiling effects.
Factor analyses suggest that the 4 items measuring self-care (e.g., washing hair) may form a separate factor; however, the high correlations with the other physical function items support the unidimensionality of the PROMIS Physical Function item bank. This replicates results from the initial validation and calibration of the full physical function item bank recommending a parsimonious one factor solution [15; 30]. Questions focusing on self-care actions may not be as relevant for a general ambulatory cancer population. Because these 4 self-care items are administered on one short form (10a), understanding the clinical needs of the population is important prior to a short-form selection. The PROMIS physical function domain has addressed some of these issues, offering tailored assessment for upper extremity function and use of mobility aids [33], increasing flexibility and relevance of this domain across a broad range of physical function.
PROMIS currently offers a wide range of physical function short forms, geared toward different patient groups and functional ability. This study confirmed the expectation that longer forms reduce the standard error of measurement (i.e., reliability increased with longer short forms). However, the 6b form reported better internal consistency than the 10a form, with a smaller ceiling effect than that identified in the 4a form. While all forms performed well, the results presented here suggest diminishing gains in precision in the 10a and 16 forms (but lower floor and ceiling effects) compared to the 6b form in this population. Recent work has confirmed these findings [12; 15; 28; 30–32], extending the range of items at the floor and the ceiling When high precision is necessary in research settings, the PROMIS PF-20 (an extension of the PF 10a form tested here) is coming into broad use as a replacement for the traditional HAQ-DI. It has been found to be more sensitive to change and requires smaller sample sizes without increasing questionnaire burden.
This study has a few notable strengths and limitations. This population is limited to participants diagnosed with cancer, measuring average or lower physical function, limiting the generalizability of these findings to very-high functioning individuals. However this population is also a strength of this study as the broad cancer inclusion criteria (7 cancers, all stages) allowed for a wide range of disability levels encountered in many medical conditions. In addition, by using a large, community-based patient cohort with verified diagnoses and clinical characteristics, this study extends previous work that reported only self-report illness status or small clinical samples to a diverse community-based cohort. Furthermore, PROMIS measures are designed to provide cross-condition comparisons using a standard, non-cancer specific scale of measurement. Therefore these findings are relevant and applicable across a full range of physical function from individuals with little to no impairment to those on bed rest.
An additional limitation regarding the sample is the relatively low participation rate of eligible patients. The overall response rate (this includes those unable to be contacted, died or later deemed ineligible) for this study was approximately 31%, higher among those able to be reached by study staff (53%). While low these rates are consistent with large, SEER-based surveys of recently diagnosed cancer patients [34–36]. Additionally, this study specifically targeted and oversampled patients from under-represented populations and patients with metastatic disease. As a result, these groups reported lower response rates (5–7% lower), than younger, white, or non-metastatic study participants.
A third limitation is that this paper focused on reliability and validity of common short forms across age and race-ethnic groups using classical test theory methods. Further work evaluating this domain with psychometric criteria such as differential item function (DIF) that identifies systematic differences in how groups respond to specific items is an important and complementary effort, currently underway. For example, past evaluations have determined that DIF by age group may be especially important for physical function [37].
Finally, it is important to note that while clinical characteristics about cancer type and stage were reported from the registry, treatment and comorbidity information was self-reported by patients. These two variables may be less accurate than other methods of data collection, such as medical record abstraction, and can be associated with an information bias. However, these are standard questions used in other national cancer surveys [34]. Therefore we feel confident this information is sufficient to evaluate known group validity.
The final study limitation is the inability to evaluate the PF 8b, an 8-item PROMIS PF short form, because we did not administer all 8 items in this survey. Therefore, these findings cannot be extended to this short form. However, the 6b short form entirely overlaps the 8b, suggesting it will perform as well, if not better than the 6b.
Conclusions
This study confirms the validity and reliability of the PROMIS Physical Function item back and short forms across a wide range of age and race-ethnic groups reflecting the extensive diversity of the U.S. population. It shows that these short forms can precisely measure meaningful group differences in cancer patient populations, accurately reflecting both disease burden and comorbidities across all versions. While some isolated measurement issues were identified, and should be considered when selecting a short form, their impact on the normalized scoring is minimal.
Acknowledgments
PROMIS II was funded by cooperative agreements with a Statistical Center (Northwestern University, PI: David Cella, PhD, 1U54AR057951), a Technology Center (Northwestern University, PI: Richard C. Gershon, PhD, 1U54AR057943), a Network Center (American Institutes for Research, PI: Susan (San) D. Keller, PhD, 1U54AR057926) and thirteen Primary Research Sites which may include more than one institution (State University of New York, Stony Brook, PIs: Joan E. Broderick, PhD and Arthur A. Stone, PhD, 1U01AR057948; University of Washington, Seattle, PIs: Heidi M. Crane, MD, MPH, Paul K. Crane, MD, MPH, and Donald L. Patrick, PhD, 1U01AR057954; University of Washington, Seattle, PIs: Dagmar Amtmann, PhD and Karon Cook, PhD, 1U01AR052171; University of North Carolina, Chapel Hill, PI: Darren A. DeWalt, MD, MPH, 2U01AR052181; Children’s Hospital of Philadelphia, PI: Christopher B. Forrest, MD, PhD, 1U01AR057956; Stanford University, PI: James F. Fries, MD, 2U01AR052158; Boston University, PIs: Stephen M. Haley, PhD and David Scott Tulsky, PhD (University of Michigan, Ann Arbor), 1U01AR057929; University of California, Los Angeles, PIs: Dinesh Khanna, MD and Brennan Spiegel, MD, MSHS, 1U01AR057936; University of Pittsburgh, PI: Paul A. Pilkonis, PhD, 2U01AR052155; Georgetown University, PIs: Arnold L. Potosky, PhD and Carol. M. Moinpour, PhD (Fred Hutchinson Cancer Research Center, Seattle), U01AR057971; Children’s Hospital Medical Center, Cincinnati, PI: Esi M. Morgan DeWitt, MD, MSCE, 17 1U01AR057940; University of Maryland, Baltimore, PI: Lisa M. Shulman, MD, 1U01AR057967; and Duke University, PI: Kevin P. Weinfurt, PhD, 2U01AR052186). NIH Science Officers on this project have included Deborah Ader, PhD, Vanessa Ameen, MD, Susan Czajkowski, PhD, Basil Eldadah, MD, PhD, Lawrence Fine, MD, DrPH, Lawrence Fox, MD, PhD, Lynne Haverkos, MD, MPH, Thomas Hilton, PhD, Laura Lee Johnson, PhD, Michael Kozak, PhD, Peter Lyster, PhD, Donald Mattison, MD, Claudia Moy, PhD, Louis Quatrano, PhD, Bryce B. Reeve, PhD, William Riley, PhD, Ashley Wilder Smith, PhD, MPH, Susana Serrate-Sztein, MD, Ellen Werner, PhD and James Witter, MD, PhD.
The Patient-Reported Outcomes Measurement Information System® (PROMIS®) is a National Institutes of Health Roadmap initiative to develop valid and reliable patient-reported outcome measures to be applicable across a wide range of chronic diseases and demographic characteristics. The content is solely the responsibility of the authors and does not necessarily represent the official views of the National Cancer Institute or the National Institutes of Health.
Funding: The project described above was supported by the following: U01AR057971 (PIs: Potosky, Moinpour), National Cancer Institute supplement P30CA051008, NCI P30CA051008, UL1TR000101 (previously UL1RR031975) from the National Center for Advancing Translational Sciences (NCATS), National Institutes of Health, through the Clinical and Translational Science Awards Program (CTSA).
Footnotes
Conflict of Interest: The authors have no conflicts of interest to disclose.
Contributor Information
Roxanne E. Jensen, Cancer Prevention and Control Program, Lombardi Comprehensive Cancer Center, Georgetown University, 3300 Whitehaven Street NW, Suite 4100, Washington, DC 20007, USA
Arnold L. Potosky, Cancer Prevention and Control Program, Lombardi Comprehensive Cancer Center, Georgetown University, DC, USA
Bryce B. Reeve, Lineberger Comprehensive Cancer Center, University of North Carolina, Chapel Hill, NC, USADepartment of Health Policy and Management, University of North Carolina, Chapel Hill, NC, USA
Elizabeth Hahn, Northwestern University Feinberg School of Medicine, Chicago, IL, USA.
David Cella, Northwestern University Feinberg School of Medicine, Chicago, IL, USA.
James Fries, Stanford University, Palo Alto, CA, USA.
Ashley Wilder Smith, Division of Cancer Control and Population Sciences, National Cancer Institute, USA.
Theresa H.M. Keegan, Cancer Prevention Institute of California, Fremont, CA, USADepartment of Health Research and Policy, Stanford University School of Medicine, Stanford, CA, USA
Xiao-Cheng Wu, Louisiana State University Health Sciences Center School of Public Health, New Orleans, LA, USA.
Lisa Paddock, Rutgers Cancer Institute of New Jersey, New Brunswick, NJ, USA.
Carol M. Moinpour, Public Health Sciences Division, Fred Hutchinson Cancer Research Center, Seattle, WA, USA
References
- 1.Ness KK, Wall MM, Oakes JM, Robison LL, Gurney JG. Physical performance limitations and participation restrictions among cancer survivors: a population-based study. Annals of Epidemiology. 2006;16(3):197–205. doi: 10.1016/j.annepidem.2005.01.009. [DOI] [PubMed] [Google Scholar]
- 2.Courneya KS, Friedenreich CM. Physical activity and cancer control. Seminars in Oncology Nursing. 2007;23(4):242–252. doi: 10.1016/j.soncn.2007.08.002. [DOI] [PubMed] [Google Scholar]
- 3.Stafford RS, Cyr PL. The impact of cancer on the physical function of the elderly and their utilization of health care. Cancer. 1997;80(10):1973–1980. doi: 10.1002/(sici)1097-0142(19971115)80:10<1973::aid-cncr15>3.0.co;2-v. [DOI] [PubMed] [Google Scholar]
- 4.Izano M, Satariano WA, Hiatt RA, Braithwaite D. The impact of functional limitations on long-term outcomes among African-American and white women with breast cancer: a cohort study. BMJ Open. 2013;3(10):e003232. doi: 10.1136/bmjopen-2013-003232. [DOI] [PMC free article] [PubMed] [Google Scholar]
- 5.Cella DF, Tulsky DS, Gray G, Sarafian B, Linn E, Bonomi A, Silberman M, Yellen SB, Winicour P, Brannon J. The Functional Assessment of Cancer Therapy scale: development and validation of the general measure. Journal of Clinical Oncology. 1993;11(3):570–579. doi: 10.1200/JCO.1993.11.3.570. [DOI] [PubMed] [Google Scholar]
- 6.Ware JE, Jr, Sherbourne CD. The MOS 36-item short-form health survey (SF-36). I. Conceptual framework and item selection. Medical Care. 1992;30(6):473–483. [PubMed] [Google Scholar]
- 7.Cella D, Yount S, Rothrock N, Gershon R, Cook K, Reeve B, Ader D, Fries JF, Bruce B, Rose M. The Patient-Reported Outcomes Measurement Information System (PROMIS): progress of an NIH Roadmap cooperative group during its first two years. Medical Care. 2007;45(5 Suppl 1):S3–S11. doi: 10.1097/01.mlr.0000258615.42478.55. [DOI] [PMC free article] [PubMed] [Google Scholar]
- 8.DeWalt DA, Rothrock N, Yount S, Stone AA. Evaluation of item candidates: the PROMIS qualitative item review. Medical Care. 2007;45(5 Suppl 1):S12–S21. doi: 10.1097/01.mlr.0000254567.79743.e2. [DOI] [PMC free article] [PubMed] [Google Scholar]
- 9.Reeve BB, Hays RD, Bjorner JB, Cook KF, Crane PK, Teresi JA, Thissen D, Revicki DA, Weiss DJ, Hambleton RK, Liu H, Gershon R, Reise SP, Lai JS, Cella D. Psychometric evaluation and calibration of health-related quality of life item banks: plans for the Patient-Reported Outcomes Measurement Information System (PROMIS) Medical Care. 2007;45(5 Suppl 1):S22–S31. doi: 10.1097/01.mlr.0000250483.85507.04. [DOI] [PubMed] [Google Scholar]
- 10.Schag CC, Heinrich RL, Ganz PA. Karnofsky performance status revisited: reliability, validity, and guidelines. Journal of Clinical Oncology. 1984;2(3):187–193. doi: 10.1200/JCO.1984.2.3.187. [DOI] [PubMed] [Google Scholar]
- 11.Peus D, Newcomb N, Hofer S. Appraisal of the Karnofsky Performance Status and proposal of a simple algorithmic system for its evaluation. BMC Medical Informatics and Decision Making. 2013;13(1):72. doi: 10.1186/1472-6947-13-72. [DOI] [PMC free article] [PubMed] [Google Scholar]
- 12.Fries J, Rose M, Krishnan E. The PROMIS of better outcome assessment: responsiveness, floor and ceiling effects, and Internet administration. Journal of Rheumatology. 2011;38(8):1759–1764. doi: 10.3899/jrheum.110402. [DOI] [PMC free article] [PubMed] [Google Scholar]
- 13.Stucki G, Stucki S, Bruhlmann P, Michel BA. Ceiling effects of the Health Assessment Questionnaire and its modified version in some ambulatory rheumatoid arthritis patients. Annals of the Rheumatic Diseases. 1995;54(6):461–465. doi: 10.1136/ard.54.6.461. [DOI] [PMC free article] [PubMed] [Google Scholar]
- 14.Bruce B, Fries JF, Ambrosini D, Lingala B, Gandek B, Rose M, Ware JE., Jr Better assessment of physical function: item improvement is neglected but essential. Arthritis Research & Therapy. 2009;11(6):R191. doi: 10.1186/ar2890. [DOI] [PMC free article] [PubMed] [Google Scholar]
- 15.Rose M, Bjorner JB, Becker J, Fries JF, Ware JE. Evaluation of a preliminary physical function item bank supported the expected advantages of the Patient-Reported Outcomes Measurement Information System (PROMIS) Journal of Clinical Epidemiology. 2008;61(1):17–33. doi: 10.1016/j.jclinepi.2006.06.025. [DOI] [PubMed] [Google Scholar]
- 16.Liu H, Cella D, Gershon R, Shen J, Morales LS, Riley W, Hays RD. Representativeness of the Patient-Reported Outcomes Measurement Information System Internet panel. Journal of Clinical Epidemiology. 2010;63(11):1169–1178. doi: 10.1016/j.jclinepi.2009.11.021. [DOI] [PMC free article] [PubMed] [Google Scholar]
- 17.Hambleton RK, Swaminathan H, Rogers HJ. Fundamentals of Item Response Theory. Newbury Park, CA: Sage Publications; 1991. [Google Scholar]
- 18.Eremenco SL, Cella D, Arnold BJ. A comprehensive method for the translation and cross-cultural validation of health status questionnaires. Evaluation & the Health Professions. 2005;28(2):212–232. doi: 10.1177/0163278705275342. [DOI] [PubMed] [Google Scholar]
- 19.U.S.Census Bureau, U.S. Department of Commerce, & Economics and Statistics Administration. Overview of Race Hispanic Origin: 2010. 2010 Census Briefs. Issued March 2011. Available at: http://www.census.gov/prod/cen2010/briefs/c2010br-02.pdf. Accessed July 2, 2014.
- 20.Assessment Center. Instruments available for use in Assessment Center. 2014 Jan 23; Retrieved August 14, 2014, from http://www.assessmentcenter.net/documents/instrumentLibrary.pdf.
- 21.Nunnally JC, Bernstein IH. Psychometric Theory. 3rd. New York: McGraw-Hill; 1994. [Google Scholar]
- 22.Peterman AH, Fitchett G, Brady MJ, Hernandez L, Cella D. Measuring spiritual well-being in people with cancer: the functional assessment of chronic illness therapy–Spiritual Well-being Scale (FACIT-Sp) Annals of Behavioral Medicine. 2002;24(1):49–58. doi: 10.1207/S15324796ABM2401_06. [DOI] [PubMed] [Google Scholar]
- 23.Ware JE, Jr, Davies-Avery A, Stewart AL. The measurement and meaning of patient satisfaction. Health & Medical Care Services Review. 1978;1(1):1, 3–15. [PubMed] [Google Scholar]
- 24.Marin G, Sabogal F, Marin BV, Otero-Sabogal R, Perez-Stable EJ. Development of a short acculturation scale for Hispanics. Hispanic Journal of Behavioral Sciences. 1987;9(2):183–205. doi: 110.1177/07399863870092005. [Google Scholar]
- 25.Oken MM, Creech RH, Tormey DC, Horton J, Davis TE, McFadden ET, Carbone PP. Toxicity and response criteria of the Eastern Cooperative Oncology Group. American Journal of Clinical Oncology. 1982;5(6):649–655. [PubMed] [Google Scholar]
- 26.Nunnally J. Psychometric Theory. New York: McGraw-Hill; 1978. [Google Scholar]
- 27.Yost KJ, Eton DT, Garcia SF, Cella D. Minimally important differences were estimated for six Patient-Reported Outcomes Measurement Information System-Cancer scales in advanced-stage cancer patients. Journal of Clinical Epidemiology. 2011;64(5):507–516. doi: 10.1016/j.jclinepi.2010.11.018. [DOI] [PMC free article] [PubMed] [Google Scholar]
- 28.Fries JF, Krishnan E, Rose M, Lingala B, Bruce B. Improved responsiveness and reduced sample size requirements of PROMIS physical function scales with item response theory. Arthritis Research & Therapy. 2011;13(5):R147. doi: 10.1186/ar3461. [DOI] [PMC free article] [PubMed] [Google Scholar]
- 29.Hung M, Baumhauer JF, Latt LD, Saltzman CL, SooHoo NF, Hunt KJ, National Orthopaedic F, Ankle Outcomes Research N. Validation of PROMIS (R) Physical Function computerized adaptive tests for orthopaedic foot and ankle outcome research. Clin Orthop Relat Res. 2013;471(11):3466–3474. doi: 10.1007/s11999-013-3097-1. [DOI] [PMC free article] [PubMed] [Google Scholar]
- 30.Rose M, Bjorner JB, Gandek B, Bruce B, Fries JF, Ware JE., Jr The PROMIS Physical Function item bank was calibrated to a standardized metric and shown to improve measurement efficiency. Journal of Clinical Epidemiology. 2014;67(5):516–526. doi: 10.1016/j.jclinepi.2013.10.024. [DOI] [PMC free article] [PubMed] [Google Scholar]
- 31.Bruce B, Fries J, Lingala B, Hussain YN, Krishnan E. Development and assessment of floor and ceiling items for the PROMIS physical function item bank. Arthritis Research & Therapy. 2013;15(5):R144. doi: 10.1186/ar4327. [DOI] [PMC free article] [PubMed] [Google Scholar]
- 32.Fries JF, Lingala B, Siemons L, Glas CA, Cella D, Hussain YN, Bruce B, Krishnan E. Extending the floor and the ceiling for assessment of physical function. Arthritis & Rheumatology. 2014;66(5):1378–1387. doi: 10.1002/art.38342. [DOI] [PMC free article] [PubMed] [Google Scholar]
- 33.PROMIS (Patient-Reported Outcomes Measurement Information System) PROMIS Adult Profile Instruments. 2014 Apr 28; Available at: http://www.assessmentcenter.net/documents/PROMIS%20Profile%20Scoring%20Manual.pdf. Accessed July 2, 2014.
- 34.Arora NK, Reeve BB, Hays RD, Clauser SB, Oakley-Girvan I. Assessment of quality of cancer-related follow-up care from the cancer survivor’s perspective. J Clin Oncol. 2011;29(10):1280–1289. doi: 10.1200/JCO.2010.32.1554. [DOI] [PMC free article] [PubMed] [Google Scholar]
- 35.Catalano PJ, Ayanian JZ, Weeks JC, Kahn KL, Landrum MB, Zaslavsky AM, Lee J, Pendergast J, Harrington DP, Cancer Care Outcomes Research Surveillance C Representativeness of participants in the cancer care outcomes research and surveillance consortium relative to the surveillance, epidemiology, and end results program. Med Care. 2013;51(2):e9–15. doi: 10.1097/MLR.0b013e318222a711. [DOI] [PMC free article] [PubMed] [Google Scholar]
- 36.Harlan LC, Lynch CF, Keegan TH, Hamilton AS, Wu XC, Kato I, West MM, Cress RD, Schwartz SM, Smith AW, Deapen D, Stringer SM, Potosky AL, Group A.H.S.C Recruitment and follow-up of adolescent and young adult cancer survivors: the AYA HOPE Study. J Cancer Surviv. 2011;5(3):305–314. doi: 10.1007/s11764-011-0173-y. [DOI] [PMC free article] [PubMed] [Google Scholar]
- 37.Paz SH, Spritzer KL, Morales LS, Hays RD. Age-related Differential Item Functioning for the Patient-Reported Outcomes Information System (PROMIS(R)) Physical Functioning Items. Prim Health Care. 2013;3(131) doi: 10.4172/2167-1079.1000131. [DOI] [PMC free article] [PubMed] [Google Scholar]