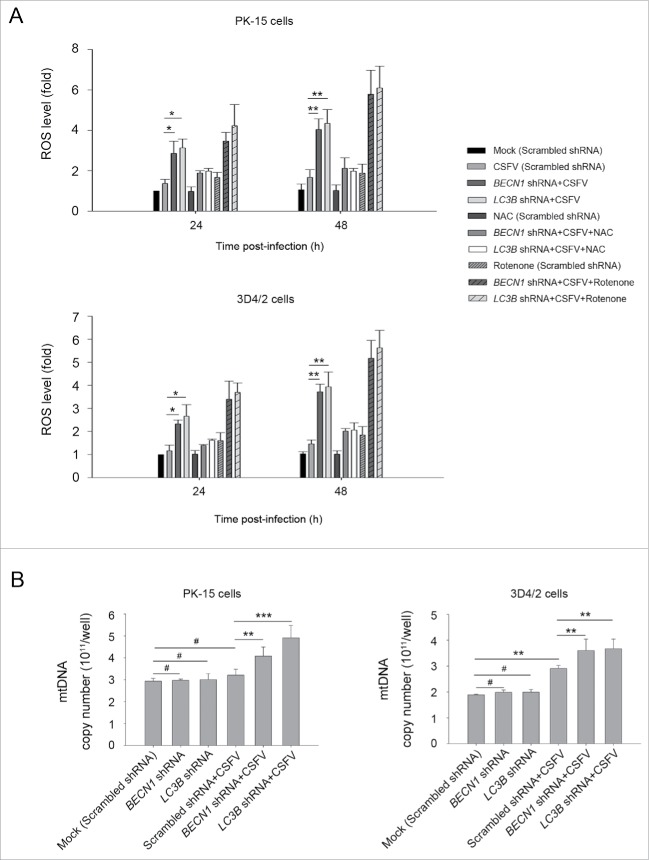
Figure 9.
CSFV infection increases ROS levels in autophagy knockdown cells. (A) PK-15 and 3D4/2 cells were transfected with the scrambled, BECN1 or LC3B shRNAs for 48 h. After 1 h of mock infection or infection by CSFV at an MOI of 1, the cells were further cultured in fresh medium in the absence or presence of NAC (10 mM) or rotenone (1 μM) for 24 and 48 h. Levels of ROS in cultured cells were analyzed by MitoSOX staining as described in Materials and Methods. The data represent the mean ± SD of 3 independent experiments. One-way ANOVA test; test of homogeneity of variances, P< 0.05, Dunnett's T3 (3) was used for correction of post-hoc test. *, P < 0.05; **, P < 0.01. (B) PK-15 and 3D4/2 cells were transfected and infected as described in the legend to Fig. 2A and C. After 48 h, the copy number of mitochondrial DNA was assessed by qPCR as described in Materials and Methods. The data represent the mean ± SD of 3 independent experiments. One-way ANOVA test; test of homogeneity of variances, P > 0.05, LSD (L) was used for correction of post-hoc test. **, P < 0.01; ***, P < 0.001; #, P > 0.05.

